Stem Taper Functions for Betula platyphylla in Daxing’anling
Shahzad Muhammad Khurram Hussain Amna He Pei Jiang Lichun
(Key Laboratory of Sustainable Forest Ecosystem Management of Ministry of Education School of Forestry, Northeast Forestry University Harbin 150040)
Abstract: 【Objective】 Stem taper functions are important components in forest management and planning systems. Currently, there is no taper function for Betula platyphylla in northeast China, therefore, it is necessary to develop the taper function for this species. Eight commonly used taper functions in forestry were compared to evaluate which would provide a better prediction for diameter at a specific height and total volume for B. platyphylla in northeast China.【Method】 The data used in this study were collected from 253 destructively felled sample trees with 3 795 diameter/height measurements in the northwest of the northern slope of Yilehuli Mountains of northeast China. A first-order continuous autoregressive error structure was used to model the error term and account for autocorrelation. Multicollinearity was also evaluated with condition number. Coefficient of determination (R2), mean absolute bias (MAB), root mean square error (RMSE) and mean percentage of bias (MPB) were selected as evaluation criteria of models. Comparison of the taper models was carried out using goodness-of-fit statistics, box plots of diameter and volume residual distributions and validation statistics. 【Result】 1) In terms of model fitting statistics, the models of Kozak (2004)-2, Fang et al. (2000) and Max et al. (1976) were the top three models. The model of Sharma et al. (2001) showed the poorest performance. 2) Based on the box plots of diameter and volume residuals, the models of Bi (2000), Max et al. (1976), Kozak(2004)-2 and Fang et al. (2000) were more accurate in diameter and volume prediction with smaller errors and almost similar residual diameter and volume distribution. The models of Sharma et al. (2001), Sharma et al. (2004), Sharma et al. (2009) and Kozak (2004)-1 had non homogeneous distribution of the diameter residuals along different sections of the stem. 3) Model validation also confirmed that Max et al. (1976), Kozak (2004)-2 and Fang et al. (2000) showed better performances. In general, the model of Kozak (2004)-2 showed consistent performances and was superior to other taper models in predicting diameter and volume.【Conclusion】 Based on the evaluation statistics of fitting and validation, graphic analysis and condition number, the model of Kozak (2004)-2 was recommended for estimating diameter at a specific height, total volume and merchantable volume for B. platyphylla in northeast China.
Key words: Betula platyphylla; taper; volume; autocorrelation; multicollinearity
Taper models are one of the essential component in current systems of forest management and planning (Heidarssonetal., 2011). Recently, the estimation of tree volume by using taper equations has gained popularity. As reported in previous studies, taper functions are a valuable tool to estimate the tree contents for a wide range of products. Taper models, owing to their flexibility, are extensively applied in forest inventories to estimate diameter and merchantable stem volume. Merchantable stem volume is of greater concern since it enables the classification of timber products by merchantable dimensions. Additionally, it was indicated by Lietal. (2010) and de-Migueletal. (2012) that taper equations stay ahead of existing volume tables in volume estimation. This benefit is attributed to the ability of taper functions to predict the diameter (over bark or inside bark) accurately at any height along stem. As a result of which, calculation of merchantable volume for any required specification is easily made possible. Besides the prediction of timber volume availability (Zhangetal., 2006), stem taper as a regressor variable, has also been applied to determine the number of growth rings in cross section (Wilhelmsson, 2006) and to evaluate the correct sampling design for the collection of stem diameter data (Newtonetal., 2008).
Broadly speaking, classification of taper functions exists on the basis of 1) their compatibility with volume equations (Reedetal., 1984); 2) their functional form (Thomasetal., 1991; Muhairweetal., 1994; Sharmaetal., 2001); 3) the origin of these functions such as empirical or geometric (Fangetal., 1999). Principally, taper functions have been arranged into three categories (Diéguez-Arandaetal., 2006). First group contains simple polynomial taper equations (Demaerschalk, 1972; Biging, 1984; Sharmaetal., 2001). Second group comprises of segmented taper functions (Maxetal., 1976; Fangetal. 2000; Jiangetal. 2005). Third type includes variable-form taper functions (Kozak, 1988; 2004; Muhairwe, 1999; Bi, 2000; Leeetal., 2003).
White birch (Betulaplatyphylla) is extensively distributed in northeast China. Currently, there is no taper function for this species in northeast China. A practical stem taper equation is required to estimate wood volume of white birch. Objectives of this study were to evaluate selected existing taper functions and to develop a taper equation for the prediction of diameter, total volume and merchantable volume of white birch.
1 Materials and methods
1.1 Data
Data used in this study were collected from uneven-aged white birch stands in the northwest of the northern slope of Yilehuli Mountains of northeast China. A total of 253 trees covering the existing range of stand conditions and densities were selected for destructive sampling. Before felling, diameter at breast height (D, 1.3 m above ground level) was measured for all trees. Each sample tree was felled to measure total tree height and their diameter near ground, and at 2%, 4%, 6%, 8%, 10%, 15%, 20%, 30%, 40%, 50%, 60%, 70%, 80% and 90% of total height. Measurement intervals along the stem fluctuate from 14 cm to 2.41 m depending upon the total height of the tree. Measurements for two perpendicular diameters (over bark) were taken in each part and arithmetically averaged. Smalian’s formula was used to calculate the log volumes in cubic meters. Stem top was considered as a cone. Total stem volume (over bark) above stump was computed by adding the logs volumes (over bark) and the volume of top section. The data was randomly split into two groups: 191 trees for model fitting and 62 trees for model validation. Summary statistics for tree diameter and total height are shown in Tab.1.
1.2 Methods
1.2.1 Functions selected for comparisonEight commonly used taper equations were selected. These models belong to the categories of simple taper function i.e. Sharmaetal. (2001), segmented taper functions i.e. Maxetal. (1976), Fangetal. (2000), and variable form taper functions i.e. Bi (2000), Kozak (2004)-1 and 2, Sharmaetal. (2004), Sharmaetal. (2009). Mathematical expressions of these models are presented in Tab.2.
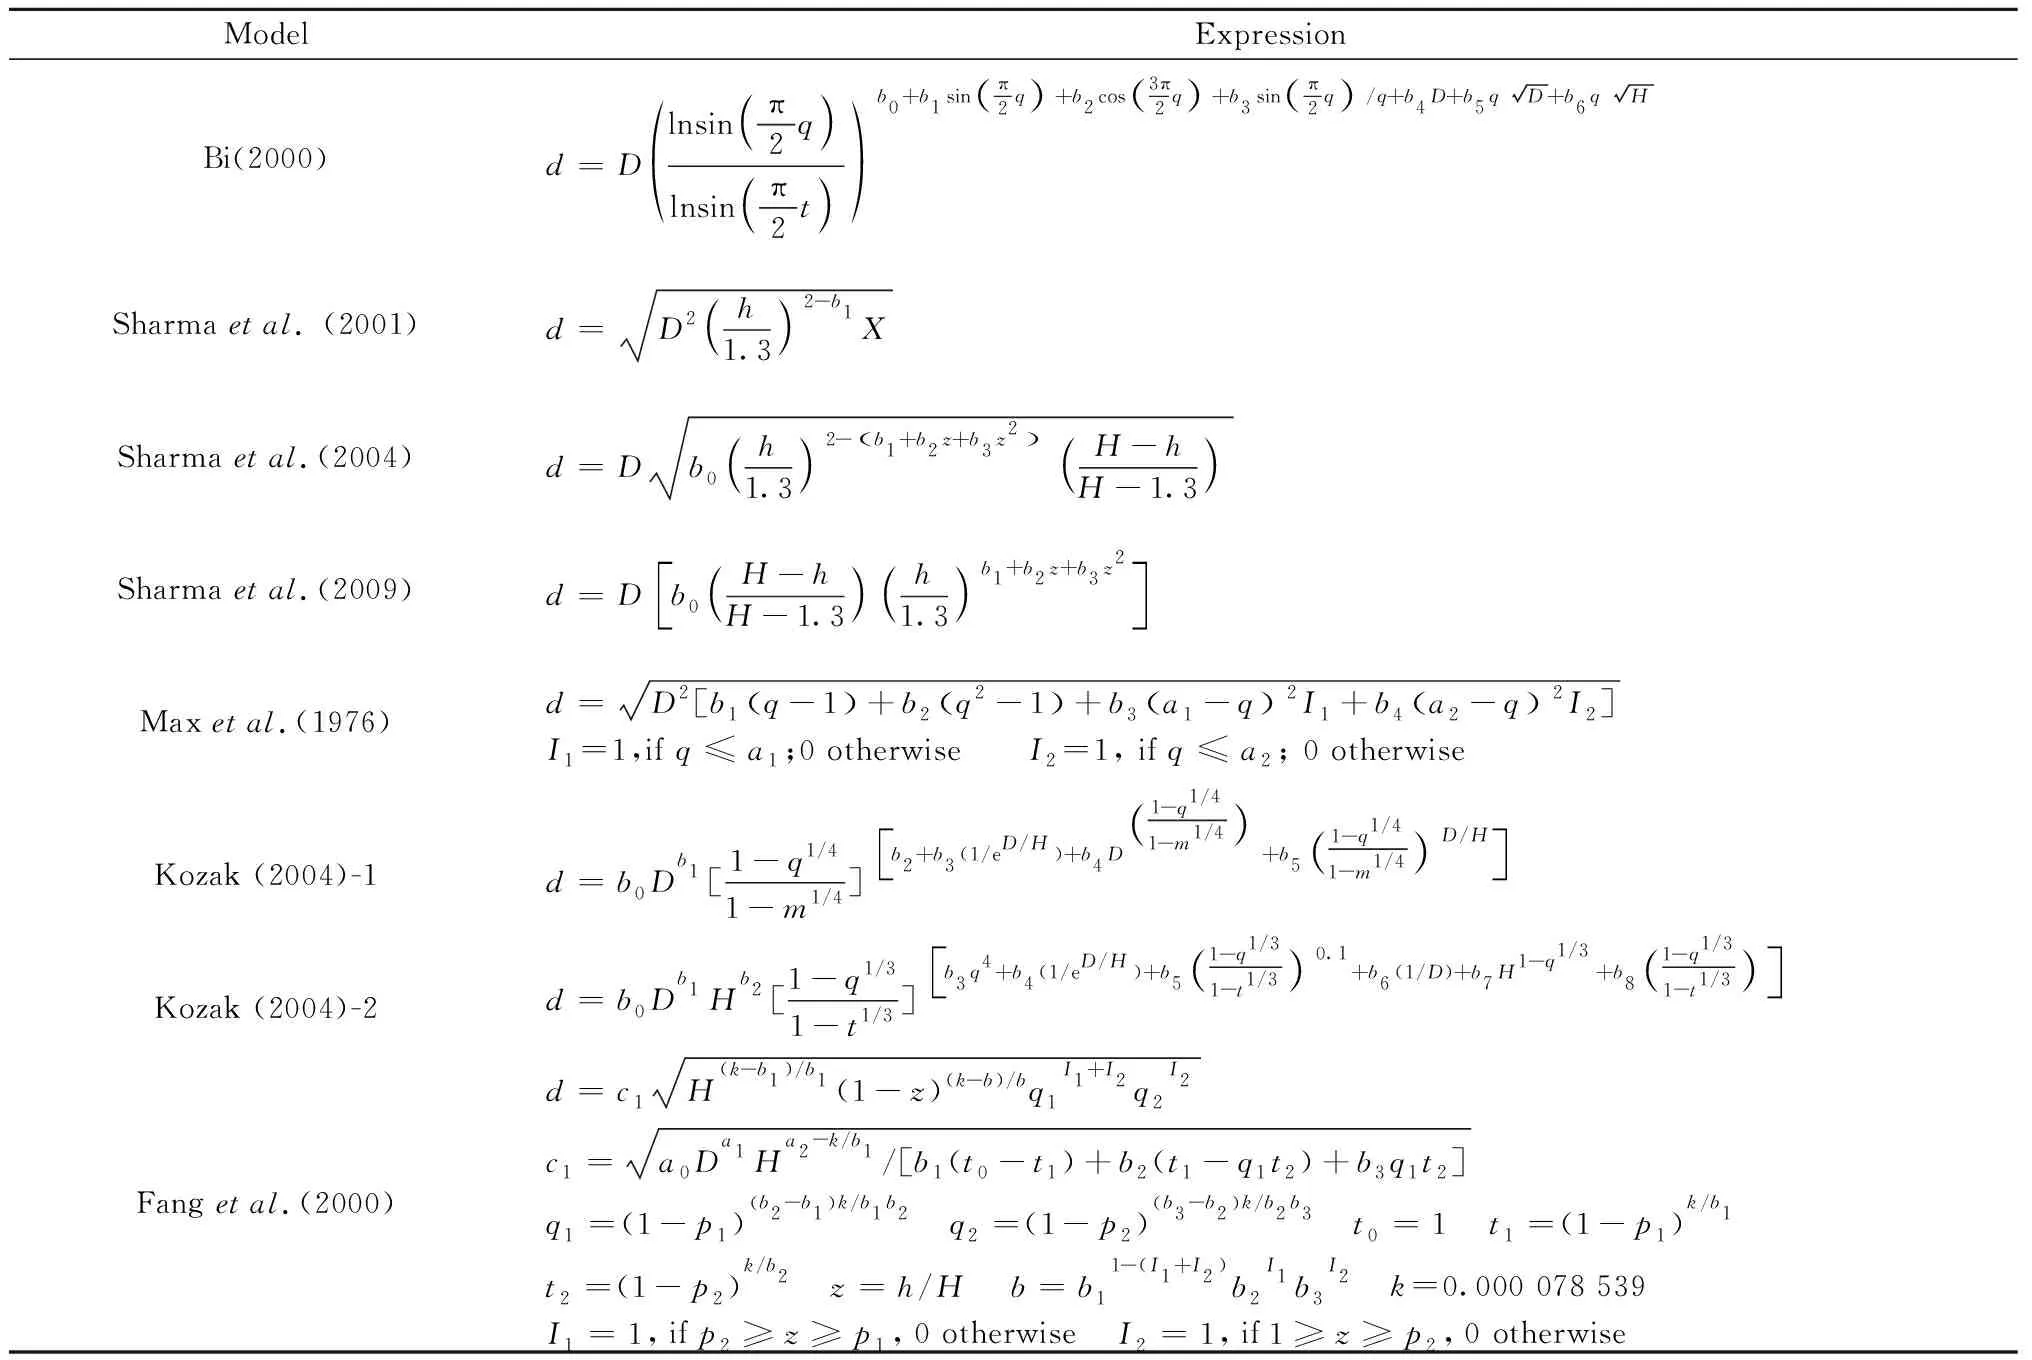
Tab.2 Analyzed taper functions①
1.2.2ModelevaluationTwo goodness-of-fit statistics were used: coefficient of determination (R2) and root mean square error (RMSE). Mean absolute bias (MAB), root mean square error (RMSE), and mean percentage of bias (MPB) were used for validation. The expressions of these statistics are as follows:
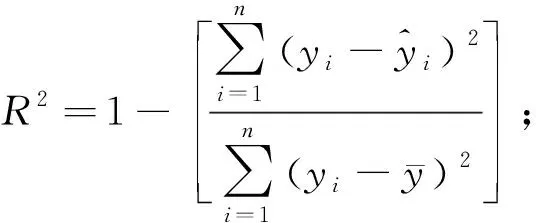
(1)

(2)

(3)
(4)

Multicollinearity and autocorrelation are two main problems for construction of taper functions. Multicollinearity is the presence of high inter-correlations among predictor variables during analysis of multiple regressions. The existence of multicollinearity in the taper functions was assessed by condition number (CN). CN is square root of the quotient between maximum and minimum eigenvalue of the correlation matrix. Belsley (1991) suggested that there should be no concern about collinearity provided the CN ranges from 5-10, collinearity associated problems are formed if CN values from 30-100 and the CN from 1 000-3 000 signifies a high degree of collinearity related problems. Autocorrelation refers to spatial correlation since taper function requires data collection from multiple observations within each tree (i.e. hierarchical data). Thus a first-order continuous autoregressive error structure CAR(1) was used to model the error terms of the hierarchical data (Lietal., 2010). The taper functions were also evaluated through the use of box and whisker plots ofdresiduals against relative heights along the stem (5%, 15%, 25%, so on up to 95%) and ofvresiduals against diameter classes.
1.2.3RankingofmodelsA common procedure of rankingmmodels is to assign numbers 1, 2, 3…,mduring comparison of different models. Though the numbers in such procedures show the respective order (descending or ascending) of the model, yet the exact place of a model with reference to other models is not known. For this study, the method proposed by Poudeletal. (2013) was used to get the specific and relative position of each model. The relative rank of the modeliis defined as
(5)
WhereRiis the relative rank of the modeli(i=1, 2, 3,…,m),siis the goodness-of-fit statistics produced by modeli,sminis the minimum value ofsi, andsmaxis the maximum value ofsi. The best and the poorest models have relative ranks of 1 andm, respectively in this method. This ranking system was applied forR2, RMSE, MAB and MPB statistics for all variables i.e. diameter and total volume, and average rank value was also calculated.
2 Results
Initially, taper functions were fitted with non-liner least squares method and autocorrelation was not taken into account. An example of observed autocorrelation in the model of Kozak (2004)-2 is given in Fig.1. As expected, a strong positive autocorrelation was observed. After a first order continuous autoregressive error structure CAR(1) was incorporated into the model of Kozak (2004)-2, no obvious correlation trend was observed, indicating that autocorrelation can be reduced through CAR(1) (Fig.1).
Most of the parameters were significant atP<0.05 (Tab.3), with the exception ofb5,b6in function Bi (2000),b2in function Sharmaetal. (2004), andb6in function Kozak (2004)-2. These insignificant parameters will not make any difference to the model. Therefore, taking the values of such parameters as 0, models were refitted.
The values of coefficient of determination (R2) and root mean squared error (RMSE) for all 8 models are shown in Tab.4. Above 97% of total variance of diameter was explained by five models i.e. Kozak (2004)-2, Fangetal. (2000), Bi (2000), Sharmaetal. (2009), and Maxetal. (1976). However, the models of Bi (2000) and Maxetal. (1976) displayed fairly high multicollinearity. The models of Kozak (2004)-2, Fangetal. (2000) and Maxetal. (1976) were top three models based on RMSE values. The model of Sharmaetal. (2001) showed the poorest performance. Tab.4 also describes the average ranks of 8 models besides the goodness of fit statistics. As a whole, Kozak (2004)-2 equation was ranked as the best model whereas the equation of Sharmaetal. (2001) was the poorest performer. The model of Fangetal. (2000) attained second position with Maxetal. (1976) and Bi (2000) at third and fourth ranks respectively.

Fig.1 Lagged residuals for the Kozak (2004)-2 model fitted without considering the autocorrelation parameters and using continuous-time autoregressive error structures of first order
The box plots ofdresiduals versus relative height classes (Fig.2) indicated that the distribution of error along the stem is not same among different taper functions. The models of Sharmaetal. (2001) and Sharmaetal. (2004) overestimated the diameter above 10% of relative height. The model of Sharmaetal. (2009) overestimated the diameter in the middle bole section (10%-90%). The model of Kozak (2004)-1 has non homogeneous distribution of the residuals along different sections of the stem. It underestimates the middle (30%-70%) and overestimates the upper portions (>80%) of the stem. The models of Bi (2000), Maxetal. (1976), Kozak (2004)-2 and Fangetal. (2000) are more accurate in diameter prediction with smaller errors and almost similar residual diameter distribution.
The box plots ofvresiduals against diameter classes (Fig.3) indicated that the models of Bi (2000), Maxetal. (1976), Kozak (2004)-2, Fangetal. (2000) and Sharmaetal. (2004) showed more accuracy and similar volume residual distribution since the medians and means of prediction errors are mainly scattered near zero. The model of Kozak (2004)-1 underestimated the volume throughout the diameter classes, especially for larger diameter classes (>20 cm). The models of Sharmaetal. (2001) and Sharmaetal. (2009) overestimated the volume throughout the diameter classes, especially for larger diameter classes (>20 cm).
Validation data was also used to evaluate the performance of the models for the prediction of diameter and total stem volume (Tab.5). According to the ranking, top three models in diameter prediction were Maxetal. (1976), Kozak (2004)-2, and Fangetal. (2000).
For total volume prediction, the scenario was a bit changed. The models of Kozak (2004)-1, Kozak (2004)-2 and Maxetal. (1976) were the best three models. The model of Kozak (2004)-2 also had a smaller volume prediction error in the lower section below 40% of total height when compared to the models of Kozak (2004)-1 and Maxetal. (1976). It was noticed that the model of Kozak (2004)-2 maintained its position and offered best results followed by the Fangetal. (2000) model in the prediction of diameter and total volume in overall ranking (Tab.5). The model of Sharmaetal. (2001) consistently displayed the poorest results in comparison with all candidate models.
3 Discussion
Numerous taper functions have been developed for many species. However, stem taper models for white birch have not been developed in northeast China. In the present study, a total of 8 commonly used stem taper functions from three groups (simple polynomial, segmented and variable form taper functions) were fitted to estimate the stem diameter and total volume of white birch. Autocorrelation and multicollinearity were considered in model fitting process. It should be noted that inclusion of autocorrelation was to improve the interpretation of statistical properties of taper models. There was no substantial difference between the estimation of the models fitted with and without autocorrelation. Multicollinearity is not a decisive factor for selecting a best taper model, however, models with lower CN should be preferred.
The goodness of fit statistics, validation statistics and box plots ofdandvresiduals put the models of Kozak (2004)-2 and Fangetal. (2000) at the higher position in estimating diameters along the stem and total stem volume for white birch. The model of Kozak (2004)-2 showed slightly better fitting and validation results than the model of Fangetal. (2000). Thus, the model of Kozak (2004)-2 was recommended for predicting diameters and volume of white birch in northeast China.

Tab.3 Parameter estimates (standard errors in bracket) of taper models for white birch

Tab.4 Goodness-of-fit statistics, rank of models, and condition number of taper models
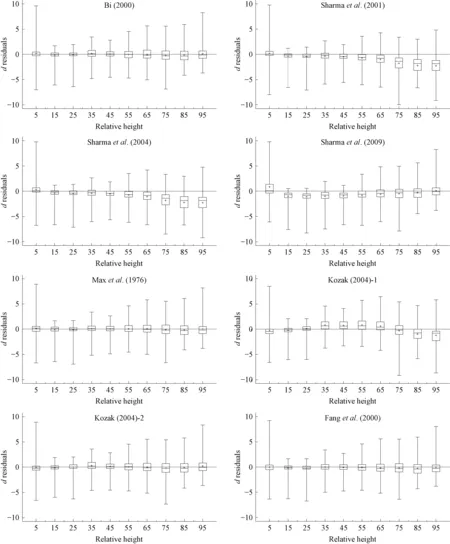
Fig.2 Box plots of d residuals (Y-axis, cm) against relative height classes (X-axis, percent) for different models The boxes represent interquartile ranges with their edges being 25th and 75th percentiles, maximum and minimum diameter over bark prediction errors are represented by the upper and lower small horizontal lines crossing the vertical bars, the plus sign represent the mean of prediction errors for the corresponding relative height classes.
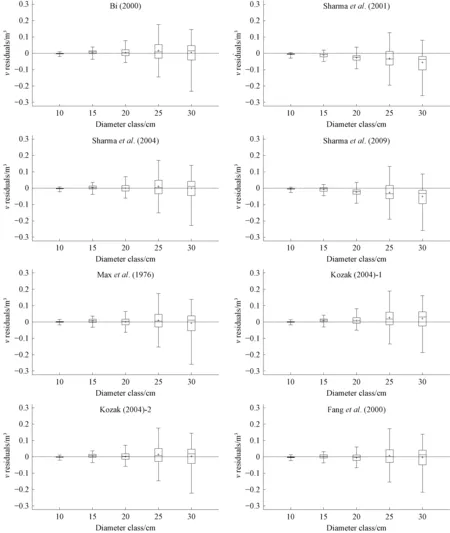
Fig.3 Residuals box plots of estimated total volume over bark against diameter classes for different models The boxes represent interquartile ranges with their edges being 25th and 75th percentiles, maximum and minimum prediction errors are represented by the upper and lower small horizontal lines crossing the vertical bars, the plus sign represent the mean of prediction errors for the corresponding diameter classes.

Tab.5 Evaluation statistics with ranking of different taper models in estimating diameter and volume
The results of this study are similar to those reported by Kozak (2004), Rojoetal. (2005), Antaetal. (2007), Corral-Rivasetal. (2007), Crecente-Campoetal. (2009), Lietal. (2010), Heidarssonetal. (2011), Jiangetal. (2016).
Kozak (2004) confirmed that the model of Kozak (2004)-2 was the best overall model for 38 species groups. In Galicia (northwestern Spain), 31 taper functions were assessed and the model of Kozak (2004)-2 was recommended forPinuspinaster(Rojoetal., 2005). Antaetal. (2007) reported that the model of Kozak (2004)-2 appeared to be the best option for stem profile description of Pedunculate oak in northwestern Spain. Corral-Rivasetal., (2007) found that the models of Fangetal. (2000) and Kozak (2004)-2 were equally precise in estimatingdat any position of the stem for the five pine species in El Salto, Mexico. Crecente-Campoetal. (2009) compared the models of Fangetal. (2000) and Kozak (2004)-2 and found no clear advantage of one model against the other forPinussylvestrisin Spain. Although Crecente-Campoetal. (2009) found that the condition number of the Fangetal. (2000) model was slightly less than that of the Kozak (2004)-2 model, in our study, the condition number of the Kozak (2004)-2 model was slightly less than that of the Fangetal. (2000) model. Heidarssonetal. (2011) suggested that the model of Kozak (2004)-2 was the best option forPinuscontortaandLarixsibiricain Iceland. In another study that included 10 taper functions to estimate DIB forPicearubensandPinusstrobus, in north america, this model was declared as the most accurate model (Lietal., 2010). Moreover, it served as a base equation for modeling stem taper equation for 11 conifer species in north America (Lietal., 2012) and forBetulapubescensin northwestern Spain (Gómez-Garcíaetal., 2013). Lately, Lumbresetal. (2016) indicated that Kozak (2004)-2 model out of six taper models showed best performance forCeltisluzonica,Diplodiscuspaniculatus,parashoreaandSwieteniamacrophyllain Philippines. Jiangetal. (2016) reported that the model of Kozak (2004)-2 was the best for describing the stem profile ofLarixgmeliniiin northeast China. In our analysis, we found minimal difference in estimating diameter and volume for the models of the Kozak (2004)-2 and Fangetal. (2000). It should be noted that Kozak(2004)-2 model cannot be directly integrated to calculate total and merchantable volume, numerical integration methods or classical volume formulate (e.g. Smalian or Huber) must be used for volume calculation.
4 Conclusions
In this study, a taper equation for white birch in northeast China was developed to estimate diameters at any position along the stem, total and merchantable volume. A total of eight well-known taper functions were evaluated: simple taper function of Sharmaetal. (2001), the segmented taper functions proposed by Maxetal. (1976) and Fangetal. (2000), the trignonmetric and variable form taper functions proposed by Bi (2000), Kozak (2004), Sharmaetal. (2004), and Sharmaetal. (2009). It is obvious from the summary statistics and graphical analysis that the model of Kozak (2004)-2 showed the best performance followed by Fangetal. (2000) with a marginal difference in the prediction of diameters along the stem and total stem volume. Thus, the model of Kozak (2004)-2 was recommended for estimating diameter at a specific height and total volume for white birch.

