Comparison of low-density lipoprotein cholesterol/high-density lipoprotein cholesterol and total cholesterol/high-density lipoprotein cholesterol for the prediction of thin-cap fibroatheroma determined by intravascular optical coherence tomography
Yao WANG*, Si-Si ZHANG*, Qing-Bo LV*, Ya LI Jin ZHAO, Jia HAN Guo-Sheng FUWen-Bin ZHANG#
1Department of Cardiology, Key Laboratory of Cardiovascular Intervention and Regenerative Medicine of Zhejiang Province, Sir Run Run Shaw Hospital,School of Medicine, Zhejiang University, Hangzhou, China
2Department of Infection Control, Sir Run Run Shaw Hospital, School of Medicine, Zhejiang University, Hangzhou, China
Abstract Background The correlation among the ratios of low-density lipoprotein cholesterol/high-density lipoprotein cholesterol (LDL-C/HDL-C), total cholesterol/high-density lipoprotein cholesterol (TC/HDL-C) and thin-cap fibroatheroma has not yet been established.Methods It was a single center, retrospective observational study.In total, we recruited 421 patients (82.4% men; mean age 65.73 ± 10.44 years) with one culprit vessel which determined by intravascular optical coherence tomography (OCT).The thinnest-capped fibroatheroma(TCFA) group was defined as lipid contents in > 2 quadrants, with the thinnest fibrous cap measuring less than 65 μm.Univariate and multivariate logistic regression were carried out to explore the relationship between lipoprotein ratios, TCFA and other characteristics of plaque.To compare different ratios, the area under curve (AUC) of receiver-operating characteristic (ROC) curve was assessed.Results OCT was performed in 421 patients (TCFA group (n = 109), non-TCFA group (n = 312)).LDL-C/HDL-C in the TCFA group was significantly higher than in the non-TCFA group (2.95 ± 1.20 vs.2.43 ± 0.92, P < 0.05), as was TC/LDL in TCFA and non-TCFA group (4.57 ± 1.58 vs.4.04 ±1.13, P < 0.05).Both LDL-C/HDL-C (OR: 1.002 (1.002-1.003), P < 0.05) and TC/HDL-C (OR: 1.001 (1.001-1.004), P < 0.05) were considered independent factors for the prediction of TCFA according to the logistic regression.Based on the AUC comparison, LDL-C/ HDL-C and TC/HDL-C had no significant difference statistically (LDL-C/HDL-C AUC: 0.63; TC/HDL-C AUC: 0.61; P = 0.10) for the prediction of TCFA.Conclusions LDL-C/HDL-C and TC/HDL-C could be the independent factors for predicting the presence of TCFA, indicating coronary plaque vulnerability in CAD patients.Moreover, TC/HDL-C also showed a comparative performance for the prediction of TCFA as LDL-C/HDL-C.
Keywords: Lipoproteins; Optical coherence tomography; Total cholesterol
1 Introduction
Coronary artery disease (CAD), a kind of cardiovascular disease (CVD), is one of the leading causes death all over the world.According to a global research,[1]approximately 17.3 million people died of such cardiovascular disease,which is a far higher rate than that in 1990.In the past few decades, it has become well-known that serum lipoprotein such as total cholesterol (TC),[2]low-density lipoprotein cholesterol (LDL-C)[3]and high-density lipoprotein cholesterol (HDL-C)[4]are the independent indicators for CVD presence.Moreover, some authors have shown the relationship between lipoproteins and the severity of CAD.[5,6]
Recently, some lipoprotein ratios have been shown to predict the presence and severity of CAD.[7-9]LDL-C is positively associated with both the presence and severity of CAD,[3]while HDL-C is negatively correlated with presence and severity of CAD,[4]meaning the ratio of LDL-C/HDL-C has an amplified prediction effect.The LDL-C/HDL-C ratio was initially put forward in the Helsinki HeartStudy,[7]where it was found to be the best predictor of cardiac events across the lipoproteins.Additionally, the LDLC/HDL-C ratio could be a positive predictor for coronary lipid-rich plaque and plaque vulnerability in patients with CAD.[9]However, TC/HDL-C is another significant predictor which includes all elevated lipoproteins, which may be associated with more substantial alterations for the prediction of ischemic heart diseases than LDL-C/HDL-C.[8]
It is accepted that optical coherence tomography (OCT)is a beneficial tool for cardiologists, especially who are carrying out diagnostic assessments of coronary atherosclerosis and guided coronary intervention.OCT is a catheter-based invasive imaging system which produces high-resolution,in vivoimages of coronary arteries.[10]Specifically, researchers have found that a fibrous cap thickness of < 65 μm is associated with the plaque rupture which leads to cardiac events.[11]Fortunately, OCT provides anin vivomeans to measure the fibrous cap thickness of culprit plaque.In a recent study, OCT was used to identify culprit artery plaque rupture in 65% of patients with acute coronary syndrome(ACS).[12]OCT made it possible to evaluate not only the thickness of coronary plaques, but also to record plaque characteristics, including macrophage area, lipid pool, calcium and so on.
Crucially, the relationship among LDL-C/HDL-C, TC/HDL-C and coronary plaque vulnerability has not been established by OCT.Therefore, the purpose of this study is to explore the relationship among LDL-C/HDL-C, TC/HDL-C and the characteristics of coronary plaque tissue, especially the thinnest-capped fibroatheroma (TCFA).
2 Methods
2.1 Study design and population
This research was a retrospective, single-center observational study.A total of 421 patients who were consecutively enrolled between January 2013 and December 2018.Inclusion criteria as follows: patients have proven CAD and have one culprit vessel in this coronary angiography, and had undergone OCT examination.Exclusion criteria as follows:(1) lesions with thrombolysis in myocardial infarction(TIMI) flow ≤ 2 after thrombectomy, with in-stent restenosis, in a bypass graft, or that were chronic total occlusions;(2) inability to pass the imaging catheter with or without pre-dilation; (3) patients with severe valve diseases, severe heart failure, previous myocardial infarction, any other revascularization procedures or strokes were excluded (Figure 1).All basic information of patients was collected, including acute coronary syndrome (ACS), diabetes mellitus (DM),hypertension (HP), estimated glomerular filtration rate(eGFR), white blood cells (WBC), triglyceride (TG), hemoglobin a1c (HbA1c), ejection fraction (EF), TC, LDL-C,HDL-C.Before the coronary angiography, all patients wereprescribed aspirin and clopidogrel maintenance for at least one week[13,14]under the standard process.All patients gave written informed consent before participation and all study protocols were in accordance with the Declaration of Helsinki.
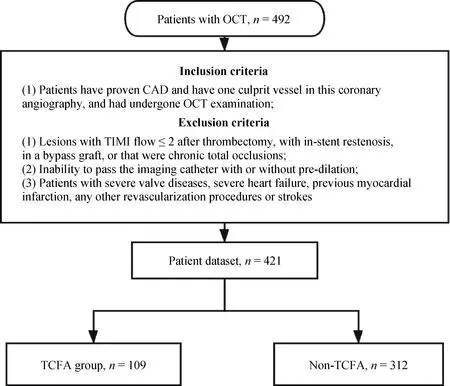
Figure 1.The study flowchart.CAD: coronary artery disease; OCT: optical coherence tomography; TCFA: thinnest-capped fibroatheroma; TIMI: thrombolysis in myocardial infarction.
2.2 Coronary angiography, OCT image acquisition and analysis
Coronary angiographies were performed following the standard processes in our department according to the conventional Judkins method.Two invasive cardiologists, who were blinded to the clinical statistical results, carried out the angiographical procedure.After angiography operation,frequency-domain OCT (C7-XR system, Saint Jude Medical, Westford, MA, USA) was used to obtain intravascular images.The data were collected and analyzed on the OCT Review Software by two experienced technicians.
Specifically, the morphologies of non-TCFA and TCFA(Figure 2) on OCT were analyzed using criteria established in 2012.[15-17]Firstly, when lipid was present at > 2 quadrants in any image along the pullback process, it was considered a lipid-rich plaque.Fibrous cap thickness was then measured at the thinnest part thrice, and the mean value was recorded.Additionally, TCFA was defined as a lipid plaque with a lipid arc > 2 quadrants with a fibrous cap thickness <65 μm.Fibro-atheroma is an atheroma that has a fibrous structure by OCT.Lipid-rich plaques (LRP), the precursor of vulnerable plaques, were defined as having more than one quadrant occupied with lipid pool.Ruptured plaque is characterized by a disrupted fibrous cap overlying a large necrotic core, and extensive inflammation.Macrophage was defined by signal-rich or distinct regions that exceeded the intensity of background speckle noise; calcifications were characterized as signal-poor or heterogeneous areas delimited by sharp borders; thrombus was a mass > 250 μm attached to the luminal surface or floating within the lumen.The total arc of macrophage, lipid, or calcium was calculated by the same way by analyzing every 1 mm using the center of mass of the lumen as the angle point.And the average macrophage arc and calcium arc were calculated by total arc in culprit vessel divided by the length of culprit lesion.
2.3 Statistical analysis
All data were collected and analyzed using Statistical Package for the Social Science (SPSS) for Mac OS, version 23 (SPSS Inc., Chicago, IL, USA).Continuous data were expressed as means ± SD, while categorical data were calculated as percentages.Continuous variables were tested by a Student’st-test or Mann-WhitneyUtest, while categorical variables were tested by a Chi-Square or Fisher’s exact test.Linear regression and logistic regression were performed to explore relationships between demographics, TC/HDL-C,LDL-C/HDL-C and TCFA, various demographic variables(gender, DM, hypertension, smoking status, age, HbA1c and EF) were adjusted in multi-factor regression.The optimal cut-off point of a variable was determined by ROC curve analysis on MedCalc, version 15.2.2, in the Windows platform (MedCalc Software, Ostend, Belgium).Area under curve(AUC) analysis of ROC was also compared in the MedCalc.Moreover, subgroups of Gender, Hypertension, Diabetes,and Smoking were analyzed individually in the process.Inter- and intra-observer reproducibility of OCT analysis was assessed using kappa statics or intraclass correlation coefficients for qualitative or quantitative analysis, respectively.APvalue of less than 0.05 was considered as statistically significant.
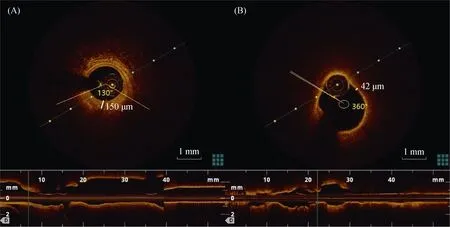
Figure 2.Representative optical coherence tomography images of non-TCFA (A) and TCFA (B).The angle of lipid in the image was measured between two yellow barriers and the thickness of the thinnest fibroatheroma was calculated in every image (150 μm for non-TCFA;42 μm for TCFA).TCFA: thinnest-capped fibroatheroma.
3 Results
There was good concordance for the inter- and intra-observer OCT assessment of the presence of TCFA (kappa =0.83, 0.87), plaque rupture (0.80, 0.90), MicroVessel (0.85,0.88), CholesterolCrystal (0.86, 0.93), and Thrombus (0.90,0.95).For quantitative data, there was good inter- and intra-observer concordance for the arc of lipidic plaque (intra-class correlation coefficientt= 0.89, 0.85), the arc of Calcium (0.90, 0.93) and the arc of macrophages (0.85, 0.94)by OCT.
Guided by the inclusion and exclusion criteria, we recruited a total of 421 patients (82.4% men; mean age 65.73± 10.44 years) with one culprit lesion.Following the cut-off value of the fibrous cap thickness 65 μm and lipid contents in > 2 quadrants, patients were divided into two groups: the TCFA group (n= 109) and the non-TCFA group (n= 312).
3.1 Demographics and clinical results
General demographic data was presented in Table 1.Multivariate logistic regression was used to explore relationships between all demographic variables and TCFA(Table 2).Multi-variate linear regression was carried out between demographic variables and fibrous cap thickness(Table 2).In the regression procedure, WBC (OR: 1.001(1.001-1.002),P< 0.05), LDL (OR: 1.021(1.002-1.041),P< 0.05), and TC (OR: 0.986 (0.970-0.999),P< 0.05) was considered as the independent indicator for TCFA and fibrous cap thickness (β = 0.001;P< 0.05) for WBC, (β =0.004;P< 0.05) for LDL, (β = -0.003;P< 0.05) for TC.HDL wasn’t significantly correlated with the incidence of TCFA or the fibrous cap thickness (P> 0.05).
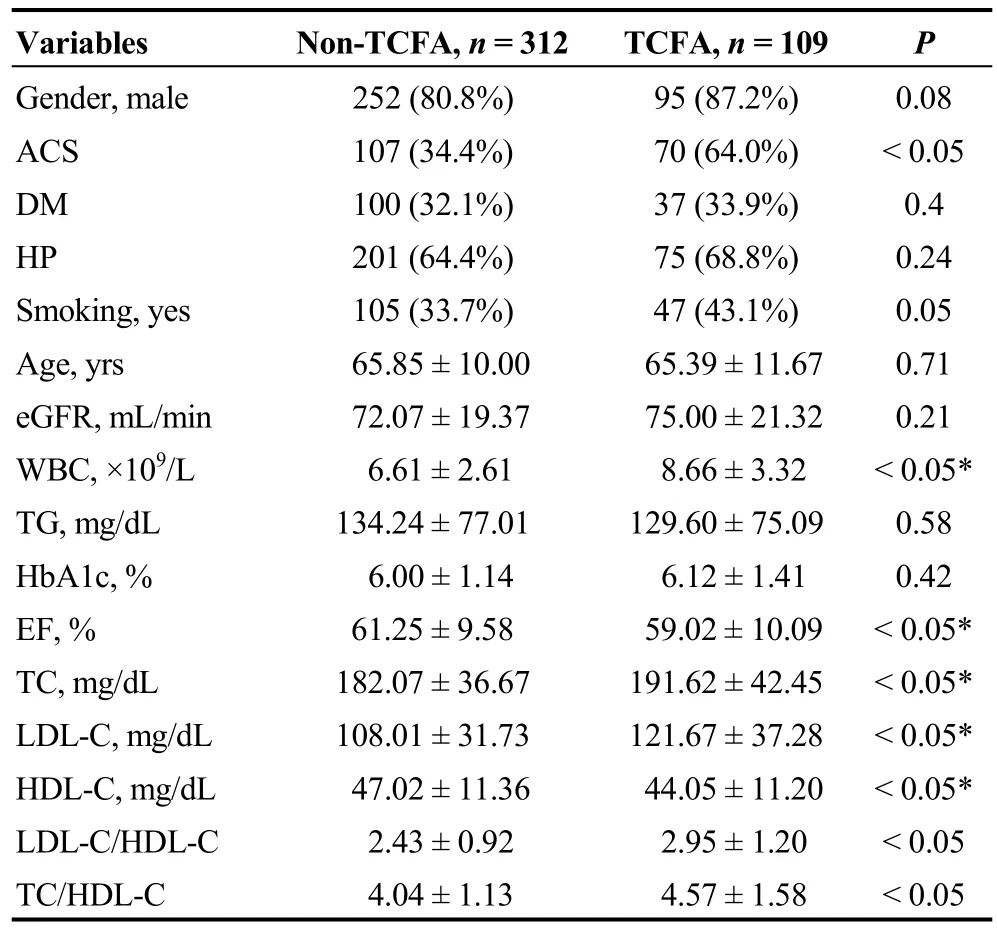
Table 1.Demographics and clinical results.
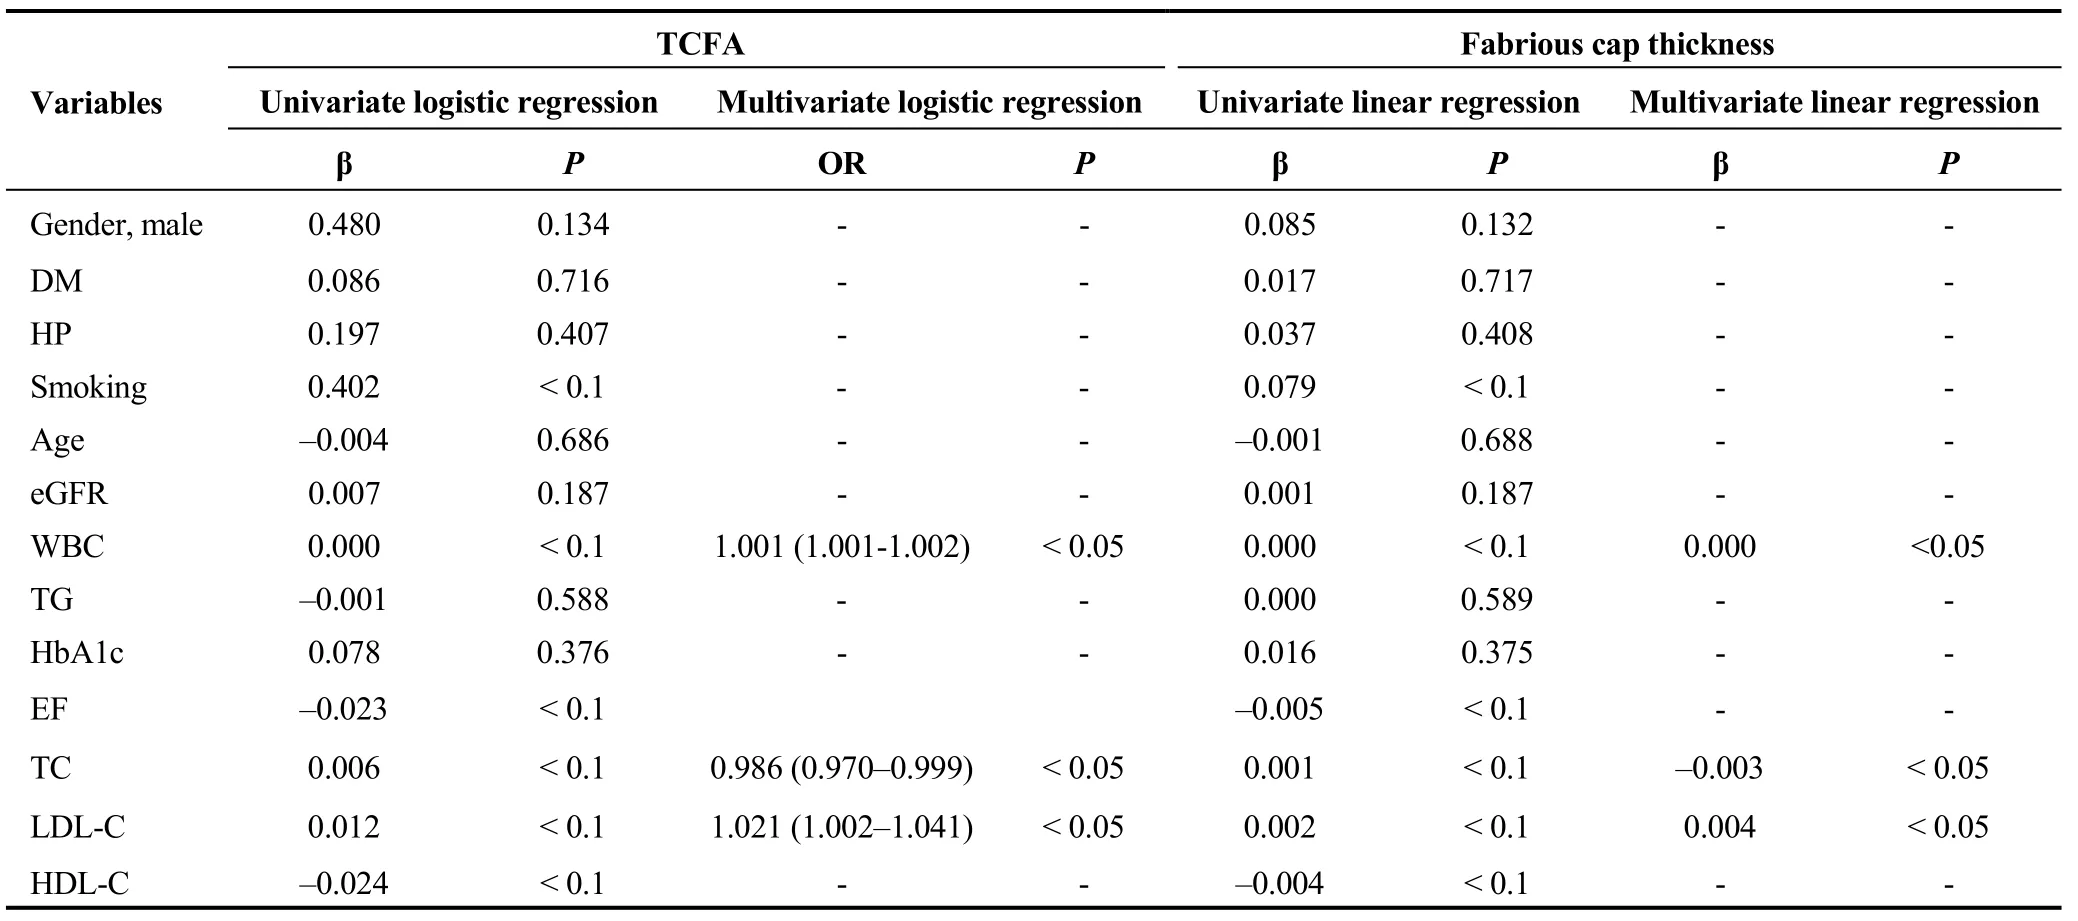
Table 2.Univariate and multivariate regression results of demographics for TCFA and fabrious cap thickness.
3.2 LDL-C/HDL-C, TC/HDL-C and OCT findings
Before acting OCT, angiographic characteristics were showed in the Table 3.There were statistically differences of lesion length and target vessel between TCFA and non-TCFA groups.
Comparisons of LDL-C/HDL-C, TC/HDL-C and some OCT findings in the TCFA and non-TCFA groups can be seen in Table 4.Except cholesterolcrystal findings (P=0.40), other OCT findings were all statically different between non-TCFA and TCFA group.For the logistic (TCFA and non-TCFA group) and linear regression (fibrous cap thickness as well as the average macrophage, lipid and calcium), various demographic variables (gender, DM, hypertension, smoking status, age, HbA1c and EF) were adjusted in multi-factor regression (Table 5).Both LDL-C/HDL-C(OR: 1.002 (1.002-1.003),P< 0.05) and TC/HDL-C (OR:1.001 (1.001-1.004),P< 0.05) were considered as independent factors for predicting TCFA (Table 5).Moreover,LDL-C/HDL-C (β = -7.96;P< 0.05) and TC/HDL-C (β =-5.44;P< 0.05) were also indicators for predicting the fibrous cap thickness.Respectively, LDL-C/HDL-C and TC/HDL-C were positive associated with average acrophage arc (LDL-C/HDL-C, β = 3.00,P< 0.05; TC/HDL-C, β =2.11,P< 0.05) and average lipid arc (LDL-C/HDL-C, β =10.54,P< 0.05; TC/HDL-C, β = 5.78,P< 0.05), while LDL-C/HDL-C (β = -6.48;P< 0.05) and TC/HDL-C (β =-4.63; P < 0.05) were negative associated with the average calcium arc.About the optimal cut-off values of LDL-C/HDL-C and TC/HDL-C were determined by ROC analysis based on the Youden’s index, respectively, 3.0732 for LDL-C/HDL-C(sensitivity: 44.4%, specificity: 80.9%), while 4.2623 for TC/HDL-C (sensitivity: 53.7%, specificity: 66.7%).
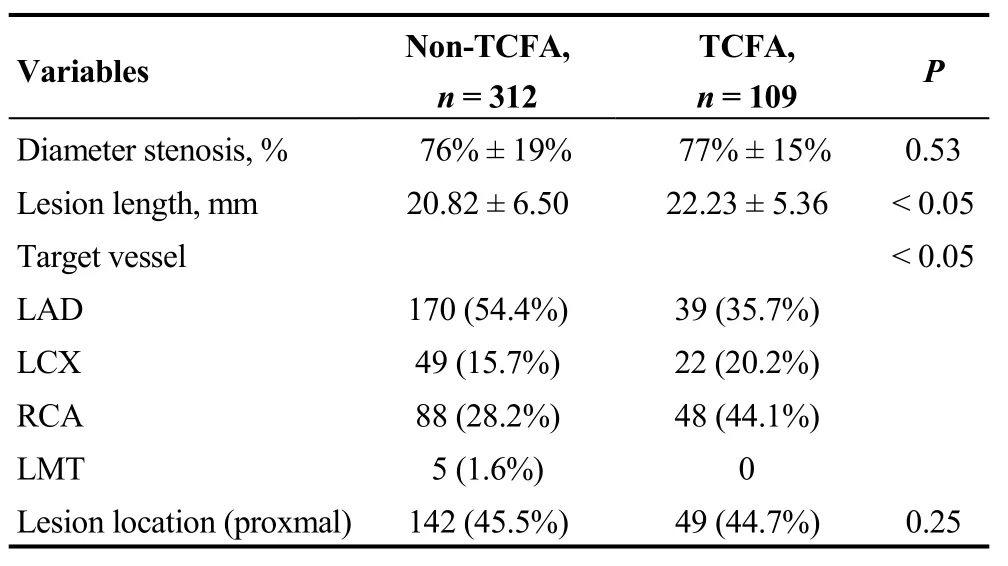
Table 3.Angiographic characteristic between non-TCFA and TCFA groups.

Table 4.OCT findings in different groups.
3.3 Comparison of the predictive value of LDL-C/HDL-C and TC/HDL-C in TCFA
To compare the validity of LDL-C/HDL-C and TC/HDL-C, ROC analysis was carried out.Figure 3 shows that LDL-C/HDL-C and TC/HDL-C had no statistical significance (LDL-C/HDL-C AUC: 0.63; TC/HDL-C AUC: 0.61;P= 0.10), based on the AUC comparison.Furthermore,when subgroups were analyzed, gender, DM, hypertension,and smoking status were analyzed for the prediction of TCFA (Table 6).Unfortunately, no subgroup demonstrated statistical significance.However, there was a marginally significant correlation between the non-DM (P= 0.06) and non-smoking subgroups (P= 0.06).

Table 5.Logistic and Linear regression results for LDL-C/HDL-C and TC/HDL-C.
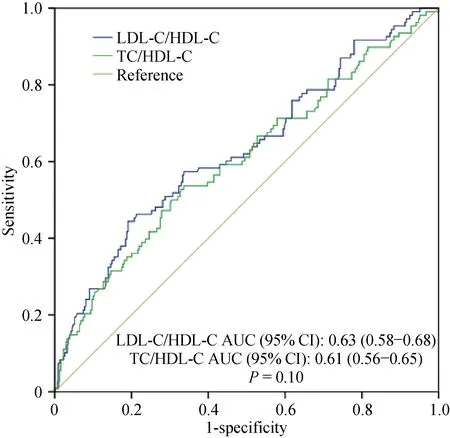
Figure 3.ROC analysis in LDL-C/HDL-C and TC/HDL-C.HDL-C: high-density lipoprotein cholesterol; LDL-C: low-density lipoprotein cholesterol; ROC: receiver-operating characteristic; TC:total cholesterol.
4 Discussion
We have demonstrated that LDL-C/HDL-C and TC/HDL-C could be independent factors for predicting the presence of TCFA which means plaque vulnerability in CAD patients.Moreover, TC/HDL-C showed a comparative performance for the prediction of TCFA as LDL-C/HDL-C either the overall population or in the gender, DM, hypertension, and smoking status subgroups.
Several demographic variables were initially associated with TCFA and fibrous cap thickness.In our study, WBC value was a predictor for the presence of TCFA and fibrous cap thickness.This result is consistent with another study about inflammatory markers with TCFA.[18]Patients with TCFA had a higher WBC count when compared to those without TCFA.However, other variables such as HDL-C revealed no effect in the regression results.In another study,[6]HDL-C was correlated with fibrous cap thickness of culprit lesions in patients with acute coronary syndrome,while the other studies found baseline characteristics results including gender, age, DM and some coronary risk factors,which were not statistically significant for coronary plaque characteristics.[19,20]Based on our results, we considered this inconsistence to come from the selective bias of using a single medical center.Therefore, multi-center studies should be carried out to prove this correlation between lipoproteins and the vulnerability of coronary plaque.
Secondly, we found that LDL-C/HDL-C and TC/HDL-C were independent predictors of TCFA and fibrous cap thickness.The relationship between LDL-C/HDL-C and the vulnerability of plaque has been confirmed in another two studies.[6,9]In an integrated-backscatter intravascular ultrasound study,[9]the LDL-C/HDL-C ratio was found to be a positive predicator for coronary lipid-rich plaque and plaquevulnerability, based on the characteristics of the lipid pool area.In another study,[6]investigators analyzed LDL-C/HDL-C between TCFA and non-TCFA groups, and found a significant result.However, these studies did not carry out a regression analysis to explore the LDL-C/HDL-C.Little studies have directly determined the correlation between TC/HDL-C and the vulnerability of plaque using OCT.We confirmed that LDL-C/HDL-C and TC/HDL-C are independent factors predicting the presence of TCFA and fibrous cap thickness.Based on this, both LDL-C/HDL-C and TC/HDL-C had an amplified predictive effect on the outcomes of CAD patients.However, while LDL, HDL, and TC didn’t show their predictive power for plaque vulnerability, the ratios still could predict the TCFA and fibrous cap thickness.

Table 6.Subgroups analysis with AUC comparison.
Thirdly, TC/HDL-C was only comparative but not better able to predict TCFA than LDL-C/HDL-C by ROC analysis.While authors of another study comparing TC/HDL-C and LDL-C/HDL-C in ischemic heart disease[8]found that TC/HDL-C was better to predict the presence of ischemic heart disease, researchers have suggested that TC value which includes other lipoproteins (very LDL-C, intermediate density lipoprotein cholesterol and so on) had an amplified effect, would be better able to predict the presence of ischemic heart diseases.However, in terms of the fibrous cap thickness in our study rather than the presence of ischemic heart diseases, we didn’t find the same results, meaning LDL-C may be the dominant indicator rather than other lipoproteins for causing vulnerability of lipid plaque.
4.1 Limitations
There are several limitations in our study.Firstly, this was a single-center, retrospective observational study based on patients who were admitted to our center, which will cause selective biases.Secondly, plaque vulnerability was only determined by OCT; adding IVUS results such as remodeling index and plaque burden would make the results more credible.[21]Thirdly, our study was a sectional observational study without follow up outcomes which will be carried out in future.Fourthly, statin therapies were used in every patient before enrollment of this study, and other drugs should be took into consideration into the future study.
4.2 Conclusion
LDL-C/HDL-C and TC/HDL-C could be the independent factors for predicting the presence of TCFA which indicating coronary plaque vulnerability in CAD patients.Moreover, TC/HDL-C also showed a comparative performance for the prediction of TCFA as LDL-C/HDL-C.
Acknowledgements
This work was supported by Zhejiang Natural Science Foundation (LY18H020007 and LQ16H020001) and National Natural Science Foundation of China (81500212 and 81800212).The authors declare no conflicts of interest.
 Journal of Geriatric Cardiology2020年11期
- Journal of Geriatric Cardiology的其它文章
- Incident frailty and cognitive impairment by heart failure status in older patients with atrial fibrillation: the SAGE-AF study
- Impact of proton pump inhibitors on clinical outcomes in patients after acute myocardial infarction: a propensity score analysis from China Acute Myocardial Infarction (CAMI) registry
- Plasma levels of Elabela are associated with coronary angiographic severity in patients with acute coronary syndrome
- Gender differences in clinical outcomes of acute myocardial infarction undergoing percutaneous coronary intervention: insights from the KAMIR-NIH Registry
- Ablation strategies for arrhythmogenic right ventricular cardiomyopathy:a systematic review and meta-analysis
- Medical management of symptomatic severe aortic stenosis in patients non-eligible for transcatheter aortic valve implantation
