
Identification of differentially expressed genes in ulcerative colitis and verification in a colitis mouse model by bioinformatics analyses
2020-12-11 07:10:46LeiShiXiaoHanJunXiangLiYuTingLiaoFuShunKouZhiBinWangRuiShiXingJieZhaoZhongMeiSunYuHao
World Journal of Gastroenterology 2020年39期
Lei Shi, Xiao Han, Jun-Xiang Li, Yu-Ting Liao, Fu-Shun Kou, Zhi-Bin Wang, Rui Shi, Xing-Jie Zhao, Zhong-Mei Sun, Yu Hao
Abstract
Key Words: Ulcerative colitis; Bioinformatics analysis; C-X-C motif chemokine ligand 13; Neuropeptide Y receptor Y1; C-X-C motif chemokine receptor 2; Colitis model mice
INTRODUCTION
Ulcerative colitis (UC), a nonspecific inflammatory disease that occurs in the colon or rectum, is the most common type of inflammatory bowel disease (IBD) and tends to occur in young and middle-aged people. Symptoms of UC, such as diarrhea, bloody stools with mucus-pus and abdominal pain, substantially affect quality of life[1,2]. Because UC is difficult to cure, readily relapses and has a high risk of cancer, UC has been classified as a refractory disease by the World Health Organization.
Epidemiological studies have confirmed that the annual incidence of UC worldwide is 10.5-14 cases per 100000 people, and the prevalence rate is approximately 246.7 cases per 100000 people[3]. Currently, the number of patients in Europe and the United States accounts for 0.5% of the global population, and the incidence and prevalence rates in urban areas have exceeded those in rural areas. Since the 1990s, the number of children who were initially treated for IBD in Western developed countries has gradually increased. In the past 20 years, the incidence and prevalence of IBD in developed countries have begun to stabilize and plateau, but in other countries an obvious increase in the incidence and prevalence still occurs, particularly in South America and East Asia[4,5]. Recently, a systematic review of 140 studies in 2018 showed that the incidence of IBD in children increased in both developed and developing countries[6].
模具中传感器可以对模具中的压力和温度进行组合测量。来自Arburg注塑机制造公司的应用技术部负责人Thomas Walther博士指出:“使用传感器归根结底就是为了使模腔内的状态可视化。”这意味着加工人员可以通过传感器获知“黑匣子”内当前的运行状况,机器操作人员则可通过模具传感器直接获取信息。
The pathogenesis of UC is complex, and the interaction of multiple factors may lead to its occurrence. With contributions from the environment, mental factors and intestinal flora, the intestinal barrier of genetically susceptible people is destroyed, and the immune system is dysfunctional, resulting in excessively hyperactive immune reactions and inflammation[7,8]. The combination of C-reactive protein and fecal calprotectin levels may be beneficial for dynamically diagnosing and monitoring the progress of UC at present[9]. However, the limited number of significant and specific biomarkers for UC has become an increasingly prominent problem in its diagnosis and treatment.
Microarray technology reveals numerous genes that are activated in different tissues as well as their physiological and pathological statuses and has been regarded as a novel approach for clarifying the mechanisms underlying different diseases[10]. In recent years with the optimization of gene sequencing platforms, differentially expressed genes (DEGs) have been identified using bioinformatics analyses[11]. To date, several studies have reported the bioinformatics analysis of IBD using arrays or chips[12,13], but the analysis of UC is still lacking. Thus, bioinformatics methods may help us study and more clearly understand the underlying mechanisms of UC[14].
In this study, we applied two databases from Gene Expression Omnibus (GEO), GEO2R and online tools for constructing Venn diagrams to identify the DEGs, including upregulated and downregulated genes. Then, the Database for Annotation, Visualization and Integrated Discovery (DAVID) was used to analyze the DEGs based on the molecular function (MF), cellular component (CC), and biological process (BP) and different Kyoto Encyclopedia of Genes and Genomes (KEGG) pathways[11]. Third, we constructed a protein-protein interaction (PPI) network using Cytoscape and the Molecular Complex Detection (MCODE) app for further analysis. Using these methods, core genes were chosen, and the KEGG pathway enrichment analysis was repeated. Finally, we verified the top three core genes in the first cluster selected by MCODE in colon tissues from mice with dextran sulfate sodium (DSS)-induced colitis using real-time polymerase chain reaction (PCR).
MATERIALS AND METHODS
Microarray data
Microarray data were obtained from the National Center for Biotechnology Information-GEO, a free public database of microarray and gene profiles, and we obtained the gene expression profiles of GSE92415 and GSE87466 in colon mucosal tissues from patients with UC and healthy individuals. Microarray data included in GSE92415 and GSE87466 were obtained from GPL13158 Platforms (HT_HGU133_Plus_PM] Affymetrix HT HG-U133+ PM Array Plate) and included 162 colonic mucosal tissues from patients with UC (who were treated with the anti-TNF agent golimumab and placebo) and 21 healthy colon mucosal tissues and 87 samples from patients with UC and 21 normal colon mucosal tissues, respectively.
DEG analysis
DEGs were identified between specimens from patients with UC and normal colonic mucosa using the GEO2R online tool with a |logFC| > 2 and adjustedPvalue < 0.05. Then, the raw data in TXT format were imported into the online tool to construct a Venn diagram and identify the common DEGs among the two datasets. The DEGs with a logFC < 0 were considered downregulated genes, while the DEGs with a logFC > 0 were considered upregulated genes.
Gene Ontology and KEGG pathway enrichment analyses
Gene Ontology (GO) analysis is a commonly used method for identifying the biological properties of high-throughput transcriptome or genome data for genes and their RNA or protein products[15]. KEGG is a collection of databases for genomes, diseases, biological pathways, drugs and chemical materials. DAVID is an online bioinformatics tool designed to identify a large number of gene or protein functions[10]. We used DAVID and performed a GO analysis to visualize the enrichment of DEGs in BP, MF, cellular components and KEGG pathways.
PPI network and module analysis
PPI information was evaluated using an online tool, the Search Tool for the Retrieval of Interacting Genes (STRING). A tab-separated file containing the values for the network from STRING was imported into Cytoscape (continuous mapping for columns depended on the frequency of genes; default size of the column = 30.0; upregulated genes were red and downregulated genes were blue), which was applied to detect the potential interactions between these DEGs[16]. In addition, the MCODE app in Cytoscape was used to assess the modules of the PPI network (cutoff = 2, max depth = 100, k-core = 2, node score cutoff = 0.2) and to identify the core genes in the top cluster in UC. Meanwhile, the KEGG pathway enrichment analysis of these core DEGs was repeated.
Establishment of the mouse model of colitis
We complied with the ethics standard for research activity established by the Animal Ethics Committee of Beijing University of Chinese Medicine in accordance with the guidelines issued by the Regulations of Beijing Laboratory Animal Management. Fourteen male specific-pathogen-free (SPF) C57BL/6 mice (weighing 20 ± 2 g) were procured from SPF Biological Technology Co., Ltd., Beijing, China (Certificate No. SCXK [jing] 2019-0010). They were housed in the SPF animal center of Beijing University of Chinese Medicine at a constant temperature of 20-26 °C and humidity of 50% to 60% in a light-controlled environment with a 12-h light/dark cycle. In addition, fodder and sterilized water were supplied. After adaptive feeding for 1 wk, these mice were divided into the control (n= 4) and model (n= 10) groups using the random number table method. Mice in the model group drank 3.5% (weight/volume) DSS (average molecular weight 36000-50000, MP Biomedicals) for 7 consecutive days[17].
Histological analysis of colon tissues from the colitis model mice
On the 7thd of the experiment, all the mice were fasted for 24 h. On the 8thd, mice were anesthetized by ether inhalation until the superficial reflex disappeared, and the mice were sacrificed by cervical spondylolisthesis. After disinfecting and preparing the skin, the abdomen was incised to separate the colon tissue. Specimens of colon tissues (three 1 cm pieces) from each mouse were fixed with a 10% neutral formaldehyde solution for at least 24 h. The lesion score was judged by the histological criterion after hematoxylin-eosin staining of 4 μm thick sections: 0, no signs of inflammation; 1, a low level of leukocyte infiltration (10-30 leukocytes per high-power field); 2, a moderate level of leukocyte infiltration (31-70 leukocytes per high-power field); 3, a high level of leukocyte infiltration (> 71 leukocytes per high-power field), high vascular density and thickening of the bowel wall; and 4, transmural infiltrations, loss of goblet cells, high vascular density, strong bowel wall thickening, ulcerations and cryptic abscesses[18].
Verification of top three core genes in the colitis model mice using real-time PCR
The other tissues were placed in cryotubes, frozen in liquid nitrogen overnight and stored at -80 °C. Total RNA was extracted from the colon tissues using TRIzol reagent (Invitrogen, United States). Specific primers were used to amplify the core genes (Table 1), and the expression of each gene was normalized toβ-actinwith the standard curve method. Reverse transcription was performed at 42 °C for 60 min, and reverse transcriptase was inactivated at 70 °C for 15 min. The relative quantitative analysis was performed using the 2-ΔΔCTapproach.
Statistical analysis
The histological lesion score and relative expression levels obtained using real-time PCR were analyzed with SPSS (version 22.0, IBM, Corp., Armonk, NY, United States). Data were distributed normally, and the two groups were compared with an independent-samplettest. APvalue < 0.05 indicated a statistically significant difference.

Table 1 Sequences of primers
RESULTS
Identification of DEGs
One hundred and ninety-six DEGs were identified in the GSE92415 database, including 130 upregulated and 66 downregulated genes. One hundred and eighty-four DEGs were identified in the GSE87466 database, including 122 upregulated and 62 downregulated genes. Among the two databases, 177 genes (118 upregulated and 59 downregulated) overlapped (Figure 1A and 1B).
Functional enrichment of DEGs in the GO analysis
Three categories of DEGs, MF, BP and CC, were classified by performing a GO analysis. Among these GO functions, extracellular region (GO: 0005576), defense response (GO: 0006952), extracellular region part (GO: 0044421), response to wounding (GO: 0009611), extracellular space (GO: 0005615) and inflammatory response (GO: 0006954) were the top six terms associated with UC with more than 30 genes identified in each category (Figure 1C). Upregulated genes were mainly enriched in defense response, inflammatory response, response to wounding, extracellular region, extracellular region part, extracellular space, cytokine activity, chemokine activity and chemokine receptor binding and were the top three enriched terms, depending on thePvalue of the respective categories (Table 2,P< 0.05). Downregulated genes were mainly enriched in transmembrane transport, carboxylic acid transport, organic acid transport, cell fraction, membrane fraction, insoluble fraction, symporter activity, xenobiotic-transporting ATPase activity and multidrug transporter activity and were the top three enriched terms, based on thePvalue of the respective categories (Table 3,P< 0.05). The KEGG pathway enrichment analysis suggested that DEGs predominantly participated in inflammation-related pathways, including the chemokine signaling pathway, cytokine-cytokine receptor interaction and complement and coagulation cascades (Table 4,P< 0.05).
Analysis of the PPI network using Cytoscape
One hundred and seventy-seven DEGs were entered into the PPI network using the Search Tool for the Retrieval of Interacting Genes, including 130 nodes and 639 edges. The thickness of the edges was adjusted based on the level of the combined score. The larger the area of a protein node, the more protein nodes that interacted with it. Upregulated genes were shown in red, and downregulated genes were shown in blue (Figure 2A). Then, we applied the MCODE app for further analysis and identified seven clusters with close interactions in patients with UC. Seventeen core genes were upregulated [C-X-C motif chemokine ligand 13(CXCL13),C-X-C motif chemokine receptor 2(CXCR2),CXCL9,CXCL5,C-C motif chemokine ligand 18(CCL18),interleukin 1 beta(IL1B),matrix metallopeptidase 9(MMP9),CXCL3,formyl peptide receptor 1(FPR1),complement c o m p o n e n t 3(C3),CXCL8,CXCL1,CXCL10,CXCL2,CXCL6,C X C L 1 1a n dhydroxycarboxylic acid receptor 3(HCAR3)], and one gene was downregulated [neuropeptide Y receptor Y1(NPY1R)] in the first significant cluster (Figure 2B).

Table 2 Top three enriched terms in the respective categories of upregulated differentially expressed genes identified in ulcerative colitis (P < 0.05)
Repeated KEGG pathway enrichment analysis of 18 core genes
The KEGG pathway enrichment analysis was repeated using the DAVID GO analysis to identify the pathways in which these 18 core DEGs in the top cluster (18 nodes, 142 edges, and a score of 16.706) were involved (P< 0.05). These DEGs were markedly enriched in the cytokine-cytokine receptor interaction and chemokine signaling pathways (Table 5).
Verification of the top three genes in the colitis model mice
Finally, we verified the top three genes (CXCL13,NPY1RandCXCR2) among the 18 core DEGs in the colitis model mice. Four mice in the model group were sacrificed during the experimental period because of the severity of disease, and the colon tissues of all the remaining mice (control:n= 4; colitis model:n= 6) were observed under a microscope. The normal four-layer structure of intestinal tissues, goblet cells and crypts disappeared, and inflammatory cells had infiltrated the submucosa in themodel group compared with the control group (Figure 3A-D). Histological lesions indicated the successful establishment of the colitis model (Figure 3E). TheCXCL13andCXCR2mRNAs were expressed at higher levels in the colon tissues from the colitis model mice than in the mice from the control group (Figure 4), and the difference in CXCR2 expression was significant (P< 0.01). These manifestations were consistent with the results of the bioinformatics analysis in the present study. Interestingly, higher expression of theNPY1RmRNA was also observed in the colitis model mice (Figure 4), which differed from our bioinformatics results.
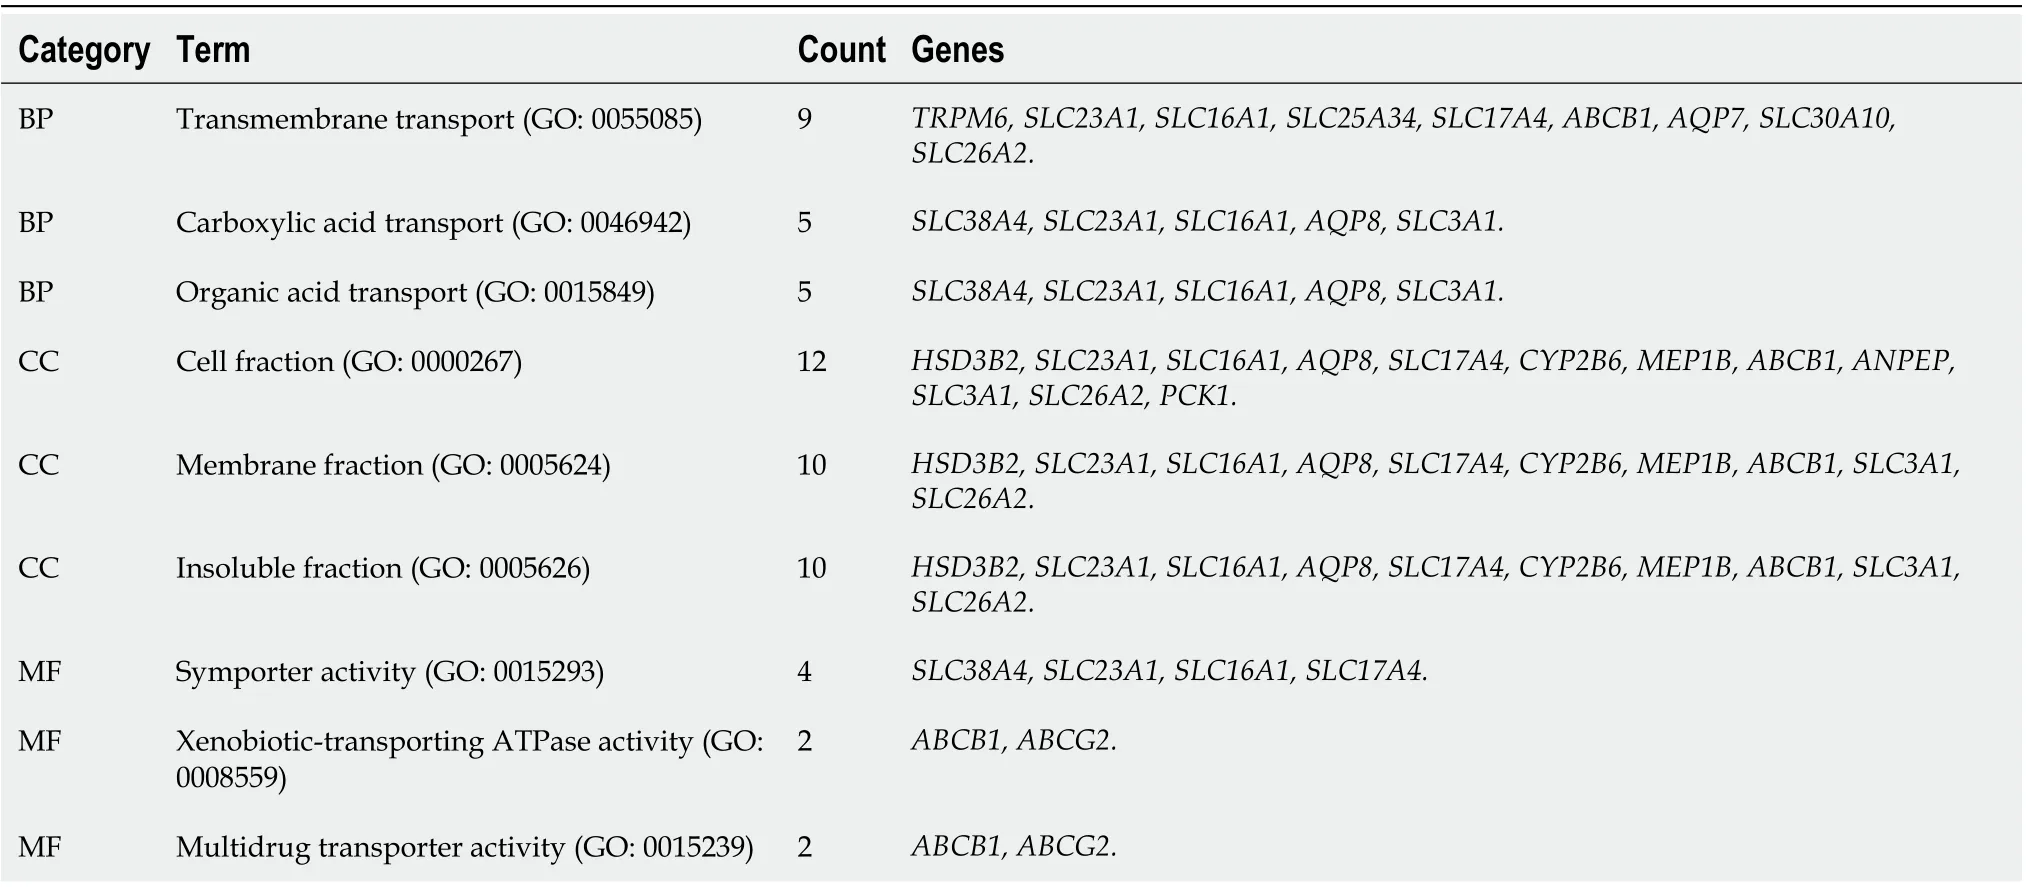
Table 3 Top three enriched terms in the respective categories of downregulated differentially expressed genes identified in ulcerative colitis (P < 0.05)
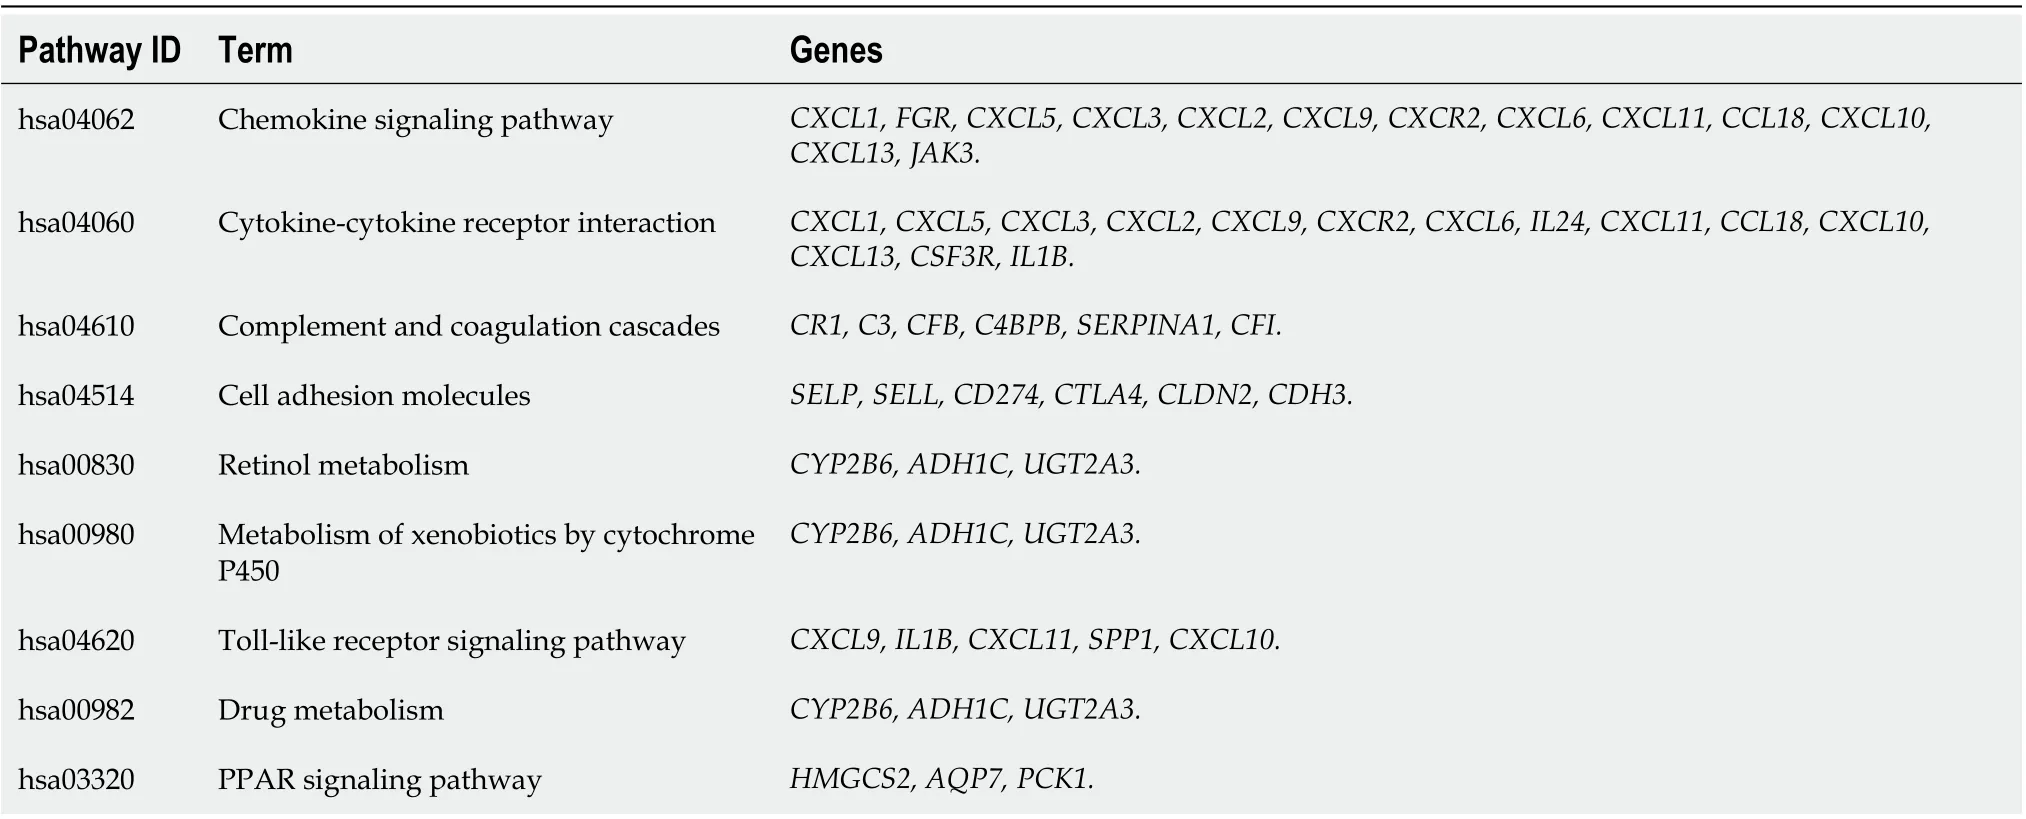
Table 4 Enriched terms in the Kyoto Encyclopedia of Genes and Genomes pathways for differentially expressed genes identified in ulcerative colitis (P < 0.05)
DISCUSSION
The incidence of UC in China and other Asian countries is gradually increasing[19], but due to the complicated pathogenesis, accurate molecular biomarkers for diagnosing UC are still lacking. In the past, biomarkers such as the C-reactive protein level anderythrocyte sedimentation rate were used to judge the degree of inflammation in patients with UC but are generally nonspecific[20], which greatly complicated the determination of the clinical diagnosis, recurrence and prognosis. The lack of biomarkers has increased the medical burden and physical and psychological discomfort of patients and accelerated the waste of public social health resources. Therefore, the identification and excavation of relatively specific molecular biomarkers is a bottleneck problem that must be solved in the diagnosis of UC[21]. Focusing on methods to solve this problem, our study chose the GEO database for an in-depth analysis of biological information.

Table 5 Repeated Kyoto Encyclopedia of Genes and Genomes pathway enrichment analysis of 18 core genes in the first cluster (P < 0.05)
GEO is an international public repository for high-throughput microarray and nextgeneration sequencing functional genomic datasets submitted by the research community[22]. We selected two microarray datasets from the GEO database, combined GEO2R and Venn diagram analyses and initially identified 177 DEGs, including 118 upregulated and 59 downregulated genes. Next, we annotated these genes by function and signaling pathways and found that they were mainly related to inflammation, such as chemokines, cytokine receptors and complement proteins. The PPI analysis helped us identify 18 core genes based on their functional annotations, and cytokinecytokine receptor interactions and chemokine signaling pathways were maximally enriched.
We established colitis model mice and verified the transcript levels of the top three genes in the first cluster in colon tissues using real-time PCR to clarify the expression of these core genes and their main pathophysiological functions. The expression of theCXCL13andCXCR2mRNAs, particularly theCXCR2mRNA, was increased in the colitis model mice, consistent with our bioinformatics analysis.
Chemokines and cytokines play pivotal roles in regulating mucosal inflammation and the immune system by promoting neutrophil migration to sites of inflammation, ultimately leading to tissue damage and destruction[23,24]. Carlsenet al[25]reported the expression of CXCL13 in both healthy individuals and patients with UC, in addition to reports in rodents from published studies; however, differences in the expression of CXCL13 between patients with UC and healthy individuals were unclear. Singhet al[23]reported significantly increased expression of CXCL13 in patients with IBD, including patients with UC and Crohn’s disease, compared to healthy controls.
On the other hand, CXCR2 has been reported to regulate the migration and recruitment of neutrophils to the site of inflammation[26]. A review also suggested that in addition to calprotectin, CXCR2, a neutrophil-related protein, may have potential roles in diagnosis and treatment[27]. As shown in the study by Farooqet al[28], CXCR2-positive mice have more severe symptoms, such as the infiltration of polymorphonuclear neutrophils(PMNs), than CXCR2-deficient mice with DSSinduced colitis. The mechanism of increased CXCR2 expression in colitis has not been conclusively determined, as the infiltration of increased numbers of PMNs in the mucosa or submucosa is a feature of DSS-induced colitis. CXCR2 functions as a PMNchemokine receptor, which would lead to a significantly higher level in individuals with colitis. Our study verified this hypothesis by showing neutrophil infiltration and a high level of theCXCR2mRNA.
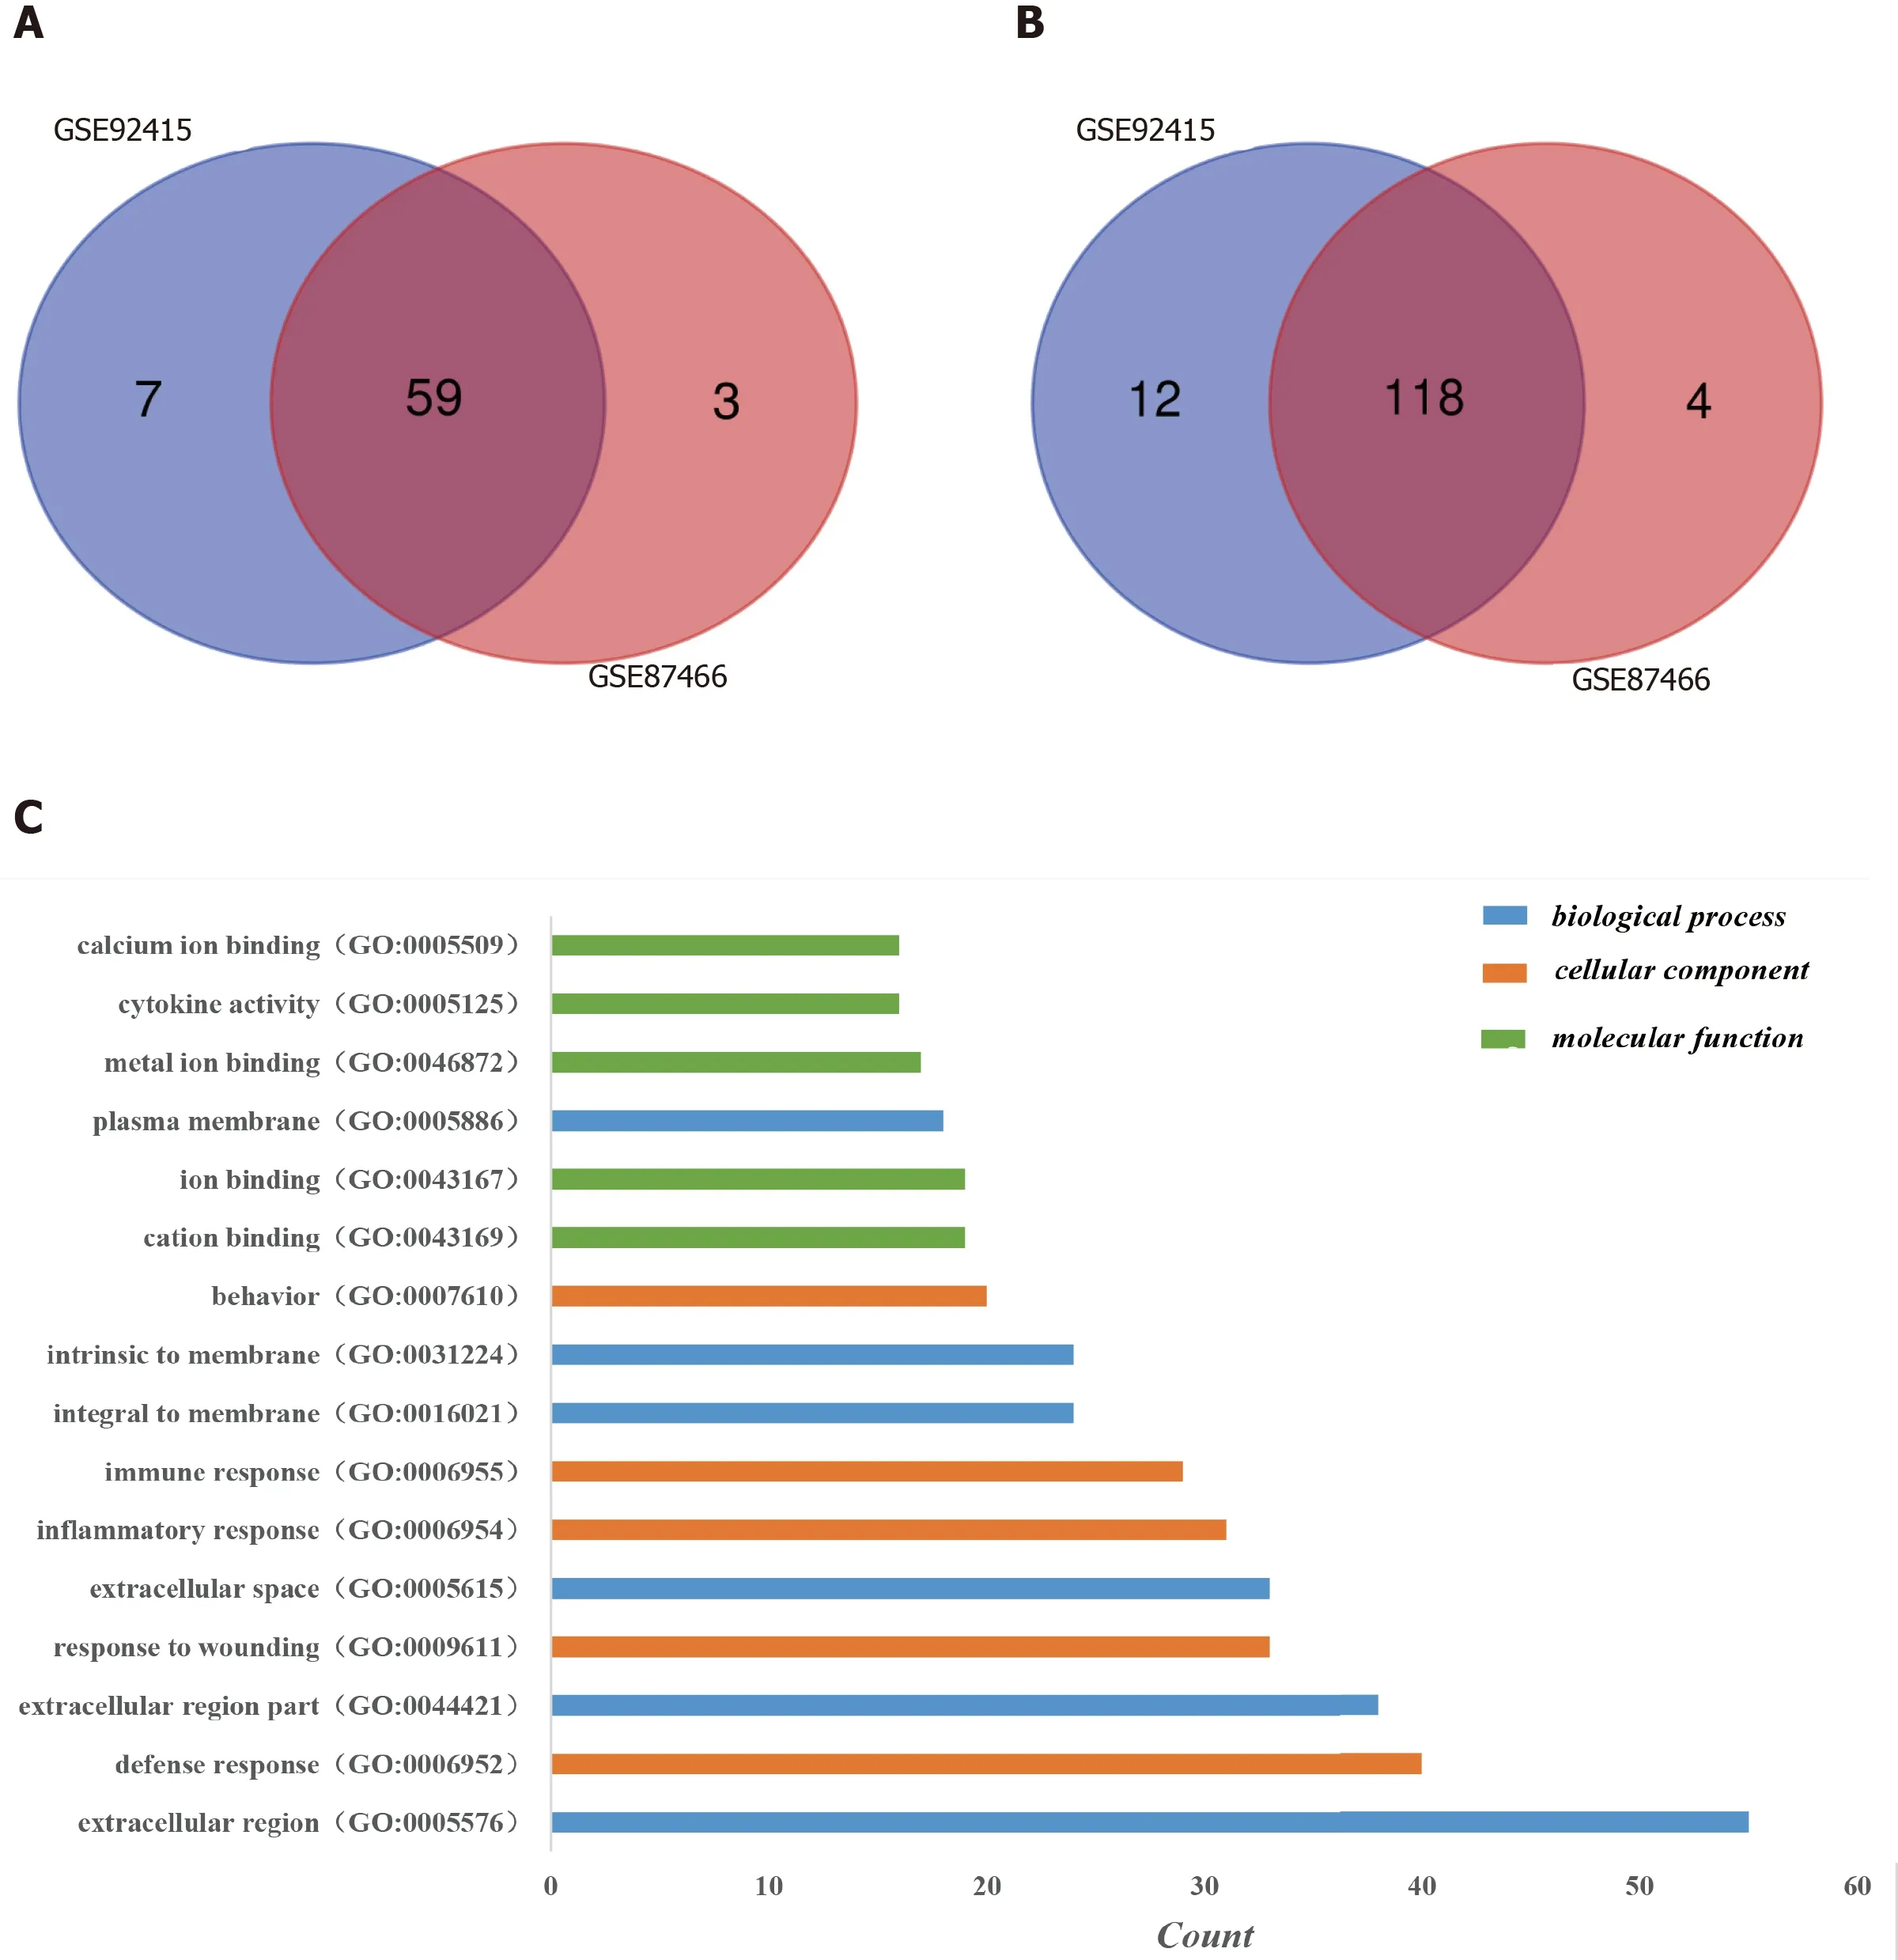
Figure 1 Identification of differentially expressed genes in the two databases (GSE92415 and GSE87466) and Gene Ontology analysis of differentially expressed genes in ulcerative colitis. A: Upregulated differentially expressed genes (DEGs); B: Downregulated DEGs. DEGs were identified with a t-test, and statistically significant DEGs were defined by the GEO2R online tool with a |logFC| > 2 and adjusted P value < 0.05; C: The Gene Ontology analysis classified the DEGs into three groups: Molecular function, biological process and cellular component. Terms were selected with > 15 genes and arrayed in ascending order from top to bottom according to the count. GO: Gene Ontology.
Notably, the expression of theNPY1RmRNA in the colitis model mice differed from our bioinformatics results. NPY is a 36-amino acid peptide with a wide distribution in the central and peripheral nervous system[29]that evokes numerous physiological responses by activating different receptors (Y1, Y2, Y3)[30]. NPY is considered the most potent orexigenic neuropeptide and may be involved in the stress response, anxiety and mood-related disorders as well as the regulation of the immune system and cancer[31].
NPY1R expression was decreased in patients with UC based on the results of the bioinformatics analysis; however, its expression was increased in the colitis model mice as evidenced by real-time PCR, which might be related to the four aspects described below. First, our bioinformatics results were derived from human colon specimens, which were fundamentally heterologous compared to the mice. Second, microarray data were obtained from the human colonic mucosa, while RT-PCR was performed on mouse colon tissues, which contained the mucosa, submucosa, muscle layer and subserosa. Thus, differences in expression were observed between the bioinformatics results andin vivoanalysis. Third, because of the current shortage of microarrays containing samples from patients with UC in the same platforms, we chose the GSE92415 microarray dataset, including patients with UC who were treated with a TNF-α inhibitor and placebos, and thus the result potentially did not accurately reflect the detailed scientific features of UC. Additionally, a 3.5% DSS solution was used to establish the colitis model and combined with the histological lesions, the model was much more severe. Further studies are needed to confirm whether dysplasia of the intestinal epithelium occurred, and the NPY/NPY1R system was activated.

Figure 2 Protein-protein interactions of differentially expressed genes and the most significant module cluster identified by Molecular Complex Detection in the protein-protein interaction network of ulcerative colitis. A: Protein-protein interaction network of differentially expressed genes determined using Cytoscape. One hundred and seventy-seven differentially expressed genes from the Search Tool for the Retrieval of Interacting Genes online database were screened using Cytoscape, including 130 nodes and 639 edges. Upregulated genes were shown in red, and downregulated genes were shown in blue; B: The most significant cluster was analyzed with the Molecular Complex Detection app in Cytoscape. Seventeen core genes were upregulated, and one gene was downregulated; a larger node indicated more interactions with a gene or a protein.
CONCLUSION
In conclusion, the core DEGs identified in patients with UC wereCXCL13,NPY1R,CXCR2,CXCL9,CXCL5,CCL18,IL1B,MMP9,CXCL3,formyl peptide receptor 1,C3,CXCL8,CXCL1,CXCL10,CXCL2,CXCL6,CXCL11andHCAR3. These DEGs are related to inflammation and immune-inflammatory reactions, indicating that inflammation and abnormal activation of the immune system may represent the core features of the pathogenesis of UC. Based on the current data, we propose that CXCR2 may represent a new biomarker for the degree of inflammation or a treatment target, and our study may provide new insights into the diagnosis and treatment of UC.

Figure 3 Hematoxylin-eosin staining and histological lesion score of colon tissues. Hematoxylin-eosin staining of colon tissues from the control and dextran sulfate sodium-induced colitis model mice. A: Control mice (× 100); B: Control mice (× 200); C: Colitis mice (× 100); D: Colitis mice (× 200); E: Histological lesion scores of colon tissues. Numerous neutrophils infiltrated and the crypts, goblet cells and normal four-layer structure of colon disappeared in the colitis model mice. Compared to the score of the control group (n = 4, 12 pieces), the score of the model group (n = 6, 18 pieces) increased significantly (P < 0.01).

Figure 4 Real-time polymerase chain reaction of the top three core genes from the first cluster in colon tissues from the colitis model and control mice. A, C, E, and G: Amplification curves for β-actin, C-X-C motif chemokine ligand 13, neuropeptide Y receptor Y1 and C-X-C motif chemokine receptor 2 (CXCR2); B, D, F and H: Melting peaks for β-actin, C-X-C motif chemokine ligand 13, neuropeptide Y receptor Y1 and CXCR2; I: Relative expression obtained using real-time polymerase chain reaction. C-X-C motif chemokine ligand 13, neuropeptide Y receptor Y1 and CXCR2 expression, particularly CXCR2 expression (P < 0.01), increased in the colitis model mice. The other two genes were expressed at higher levels in the colitis mice than in the control mice, but the difference was not significant. CXCL13: C-X-C motif chemokine ligand 13; NPY1R: Neuropeptide Y receptor Y1; CXCR2: C-X-C motif chemokine receptor 2.
ARTICLE HIGHLIGHTS

Research methods
Two microarray datasets from the National Center for Biotechnology Information-Gene Expression Omnibus database were used, and DEGs were analyzed using GEO2R and Venn diagrams. We annotated these genes based on functions and signaling pathways. Then protein-protein interaction (PPI) were constructed using the Search Tool for the Retrieval of Interacting Genes. The data were further analyzed with Cytoscape software and the Molecular Complex Detection (MCODE) app. The core genes were selected, and the Kyoto Encyclopedia of Genes and Genomes pathway enrichment analysis was repeated. Finally, colitis model mice were established by administering dextran sulfate sodium, and the top three core genes were verified in colitis mice using real-time polymerase chain reaction.
Research results
One hundred and seventy-seven DEGs (118 upregulated genes and 59 downregulated genes) predominantly participated in inflammation-related pathways. Seventeen core genes were upregulated, and one gene was downregulated in the first cluster according to the PPI and MCODE analyses in Cytoscape. These genes were markedly enriched in the cytokine-cytokine receptor interaction and chemokine signaling pathways. The top three core genes showed increased expression compared with the control mice, but only the difference in C-X-C motif chemokine receptor 2 (CXCR2) expression was statistically significant. CXCR2 may reflect the degree of inflammation in patients with UC and serve as an underlying treatment target.
Research conclusions
Core DEGs identified in patients with UC are related to inflammation and immune inflammatory reactions, indicating that these reactions are core features of the pathogenesis of UC. CXCR2 may reflect the degree of inflammation in patients with UC.
Research perspectives
CXCR2 may represent a new biomarker to determine the degree of inflammation or a treatment target in UC. In the future, the combination of CXCR2 with other biomarkers will potentially improve the ability to diagnose and dynamically monitor UC.
猜你喜欢
无线互联科技(2019年10期)2019-08-06 13:48:19
中国塑料(2019年5期)2019-06-03 06:56:48
新一代(2018年17期)2018-02-26 01:25:14
中国公路(2017年7期)2017-07-24 13:56:29
卷宗(2016年9期)2017-03-31 01:54:38
湖南城市学院学报(自然科学版)(2016年2期)2016-12-01 04:06:45
山西省政法管理干部学院学报(2016年1期)2016-07-31 18:09:48
中国塑料(2016年2期)2016-06-15 20:30:00
医学与社会(2015年9期)2015-12-26 11:37:26
塑料包装(2014年2期)2014-11-29 01:19:37
 World Journal of Gastroenterology2020年39期
- World Journal of Gastroenterology的其它文章
- Herbal cake-partitioned moxibustion inhibits colonic autophagy in Crohn’s disease via signaling involving distinct classes of phosphatidylinositol 3-kinases
- Artificial intelligence technique in detection of early esophageal cancer
- Polyethylene glycol 35 ameliorates pancreatic inflammatory response in cerulein-induced acute pancreatitis in rats
- Impact of cap-assisted colonoscopy during transendoscopic enteral tubing: A randomized controlled trial
- Single access laparoscopic total colectomy for severe refractory ulcerative colitis
- Acute gastrointestinal injury in critically ill patients with COVID-19 in Wuhan, China