An effective indoor radio map construction scheme based on crowdsourced samples
Guo Ruolin (郭若琳), Qin Danyang, Zhao Min, Xu Guangchao
(Provincial Key Laboratory of Electronic Engineering, Heilongjiang University, Harbin 150080, P.R.China)
Abstract
Key words: localization fingerprint, crowdsourced samples, radio map, fingerprint interpolation
0 Introduction
With the rapid spread of smart mobile terminals and the large-scale deployment of the Internet, location based service (LBS) has been widely used in various fields of daily life. In some special cases like emergency rescue, public safety and smart city construction, it is necessary to obtain the exact location of people or objects in the indoor environment. Since wireless local area networks (WLANs) have been deployed on a large scale in public places such as schools, hospitals, shopping malls, etc., it is possible to estimate the location of users by relying solely on software development without using any additional hardware facilities, which makes the indoor localization using WLAN systems the current mainstream and the most promising method in the future.
At present, the most widely used Wi-Fi-based indoor localization algorithm is a location fingerprint localization algorithm based on crowdsourced samples, where the localization fingerprint[1]sets up a mapping from the location in the physical environment to a single or multi-dimensional fingerprint of some kind so as to ensure one location for each unique fingerprint. The fingerprint in the Wi-Fi location fingerprint location algorithm refers to the received signal strength (RSS) of the access point (AP)[2]. Crowdsourcing technology[3]can reduce or even eliminate the huge workload of site surveying, which will hand over the construction of radio map to a large number of users, and integrate a small amount of RSS data collected by each user to obtain the radio map data for a large area. Such technology allows the users participating in the update of radio map fingerprint data while enjoying the location service.
Although the use of crowdsourced samples for indoor radio map construction can reduce the cost of updating the fingerprint database effectively in the offline phase, some new challenges arise. First of all, in the offline phase of the traditional WLAN fingerprint location system, a series of reference points are set in the to-be-positioned area to collect the RSS values of the surrounding detectable APs. The position coordinates of the reference points and the corresponding RSS are collected and stored together in the fingerprint database. The crowdsourced samples, however, may not be acquired at the specified reference point, which may cause incorrect location annotation of the sample as well as constructing the wrong radio map. Secondly, only a few of the Wi-Fi APs detected by mobile terminals can contribute to localization. If all the APs are taken to construct the radio map, it will not only take up too much storage space, but cause heavy computational overhead. Moreover, the samples collected at the same location by the same mobile terminal may also contain different detectable source APs to cause inconsistent dimensions so as to affect the normalization of radio map. Thirdly, the lack of mandatory requirement for the crowdsourcing process may result in uneven distribution of the samples collected throughout the indoor environment. Finally, the different mobile terminals used to collect fingerprint data may cause serious device diversity problems, no matter in online phase or offline phase.
Aiming at the problems discussed above, a new WLAN indoor radio map construction scheme based on crowdsourced samples (WRMCS) is proposed in this paper. The density-based algorithm in unsupervised machine learning framework is established, and a source selection algorithm is set up based on AP acceptance rate. Moreover, the fingerprint interpolation algorithm is introduced based on surface fitting techniques and the inter-device calibration algorithms are optimized based on receiver pattern analysis, which can help achieve low-cost and high-precision radio map construction.
The subsequent sections are arranged as follows: Section 1 will analyze the problems encountered in the construction of indoor radio map and typical solutions comprehensively. Section 2 will establish the source selection algorithm based on AP acceptance rate and the fingerprint interpolation algorithm based on surface fitting technology to construct the offline radio map. An improved nearest neighbor (NN) online localization algorithm will be proposed in Section 3 associated with the constructed offline radio map to estimate the position of the online test fingerprint. Simulating results will be analyzed in Section 4 and the conclusion will be provided in the end.
1 Related work
The problems of inaccurate sample location annotation, collected samples containing invalid access points (APs), uneven sample distribution, and diversity of terminal devices have been studied since such factors always have serious effect on the indoor positioning performance and practical application. Ref.[4] proposed a bottom-up hierarchical clustering algorithm to distinguish correctly labeled samples from all samples so as to avoid the wrong sample annotation. Such hierarchical clustering algorithm, however, requires a random selection of initial samples, which may introduce samples with erroneous markings. The most famous research on the selection of key APs is the information-based InfoGain algorithm[5], which used the information gain to measure the average RSS to decide the discriminability of different APs. Ref.[6] studied the correlation between different APs to improve the InfoGain algorithm. Considering the inherent defects in indoor environment, an enhanced machine learning indoor localization scheme was proposed in Ref.[7] combined with AP selection and signal strength reconstruction effectively, which can help enhance the robustness in noisy environments. A nonlinear auto-encoder was proposed in Ref.[8] to reduce the dimensionality of the radio map. Machine learning-based methods generally exhibit better performance than information-based methods, but the heavy computing load brought in by machine learning methods during offline and online processing cannot be ignored.
The terminal difference is another factor to affect the positioning results. Ref.[9] achieved normalization received signal strength indicator (RSSI) distribution of various types of terminal devices using the kernel density estimation to solve the problem of device diversity. However, the RSSI probability density distribution estimation algorithm adopted the absolute received intensity value of the RSSI, the instability of which cannot be avoided due to the occlusion of obstacles and the changes of the indoor environment. Hossain et al.[10]concluded that the signal strength difference (SSD) had stronger stability than the RSS value by studying the stability of the SSD between different APs. However, SSD only considers the proportional term of the linear transformation equations. It is necessary to combine the research results of the offset term in the RSS difference fingerprint method to obtain more complete results.
This paper will propose a new radio map constructing method with crowdsourced samples to solve the above 4 problems effectively by outlier detection, key AP selection, fingerprint interpolation and terminal device calibration, so as to realize the construction of radio map with low cost and high precision.
2 Construction of offline radio maps
2.1 System model
The target environment will be divided into different sub-regions according to the functional layout of the indoor environment and wall partitions, such as classrooms, corridors, etc. Each sub-region is then further divided into non-overlapping grid cells of the same size. Users participating in crowdsourcing will collect samples at each grid center, and each sample has a location annotation in the grid. Finally, these samples are represented in the form of data cubes, that is, each grid has a data cube to form a grid fingerprint, thereby constructing an offline radio mapMfor each sub-region. Table 1 in the appendix gives the main symbols of this article.
LetSandFrepresent the sample set of a grid and its fingerprint, respectively. The sample setSis represented by a data cube, where each vertical slice of the data cube represents a sample acquired by a different device D, and each row vector in the slice represents a sample consisting of collected RSS values from different APs.Fis a grid fingerprint vector, and each element in the vector is an RSS value from a specific AP. All grids are divided into 2 categories: a sufficient grid and a deficient grid. The former one is defined as the grid with at least one device containing enough samples; and the latter means that there are not enough samples being collected in such grid even for one device type.
The proposed offline system consists of 4 modules: (1) outlier detection (OD), (2) key AP selection (KAS), (3) fingerprint interpolation (FI), and (4) terminal device calibration (TDC), with the help of which the proposed scheme WRMCS can solve all the 4 core problems. Each grid fingerprint is constructed by the corresponding process on the original data cube. The system architecture of the proposed scheme WRMCS is shown in Fig.1 with the specific processing as follows. Firstly, the outliers are detected and deleted from the crowdsourcing sampleS. Only one subset of all APs being detected is selected to constitute the device-specific fingerprintf. For the deficient grid, a fingerprint will be interpolated to make the spatial distribution of the sample uniform. After that, the fingerprints from different devices will be calibrated and fused into a single, device-independent grid fingerprint. Finally, an improved online location algorithm is established to estimate the location of online test fingerprints. Fig.2 is the data processing flow of the proposed scheme. The blank grid in data grid and sub-region sections represents the defect grid. The data cube can be processed as follows. After the outlier detection is completed, the samples4collected by deviceD1will be deleted, and AP6detected by deviceD1will also be deleted after every device selects the key AP. A device-specific fingerprintfshould be built up for each device. For the deficient grid, the device-specific fingerprint will first be constructed by the fingerprint interpolation module with the terminal device calibration being performed. Then the grid fingerprintFis composed for each grid and a radio mapMis constructed for a sub-area. The 4 modules of the offline system are introduced below.

Fig.1 The proposed system diagram

Fig.2 Data processing flow of the proposed system
2.2 Outlier detection
Crowdsourcing samples need some locational annotations to build the training fingerprint. Some samples, however, may not be acquired at the specified reference point to make the annotations inaccurate, which may cause wrong constructions of the training fingerprint and the radio map. Specifically, the AP set being detected usually consists of the APs appearing once or many times in their samples when constructing a grid fingerprint. In addition, in the subsequent construction steps, the average calculation for RSS is usually performed for each AP being detected in the sample. Therefore, the sample with errors will cause at least 2 problems: the changes of the AP set being detected in the grid and the deviation of the average RSS from the true value.
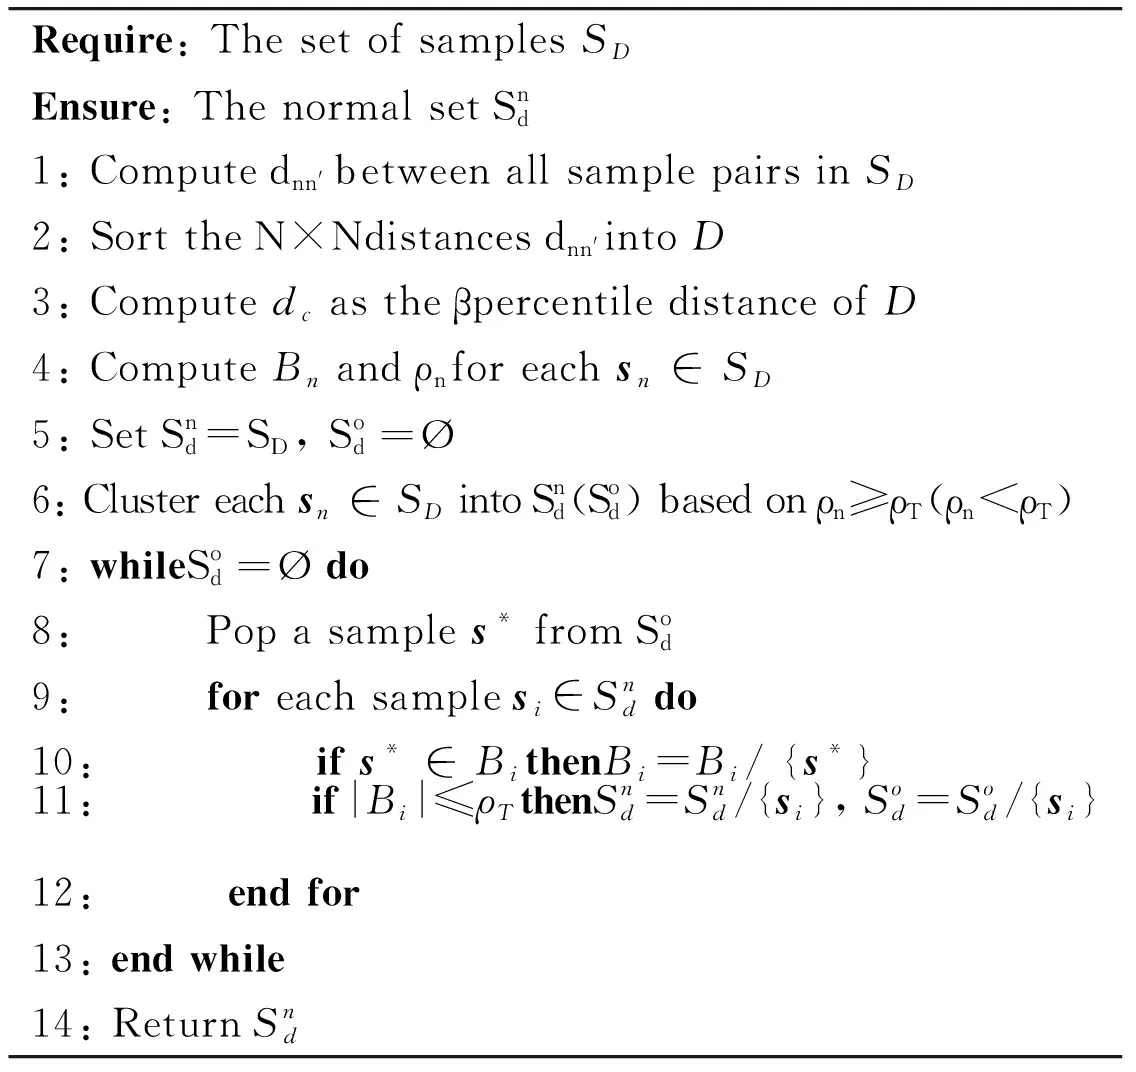
To solve such problems, the clustering method in unsupervised machine learning algorithms is adopted for outlier detection. Specifically, the density-based algorithm[11]is selected with samples being clustered according to the similarity-based local density. Here the sample being measured within its annotated grid is called a normal sample; otherwise, the sample is an outlier. Theoretically, the similarity between normal samples would be higher than that between normal samples and outliers, and also higher than that between outliers.
Such process will be performed on each slice in every data cube by the proposed scheme since the outlier detection is specific to the device. LetSD={s1,…,sN} denote the set of samples collected by a particular deviceD, each of which is a vector consisting of RSS values, andNis the total number of samples. LetAidenote the set of APs detected in samplesi.M=|∪Ai| denotes the total number of all APs being detected inSD. The fact that not all devices can detect all APs makes the values ofMandNbe different for different devices and bandwidths. AnN×MRSS matrixR(0)is constructed for each device, where the elementrnmrepresents the RSS value received from themth AP by thenth sample. The signal distance between the 2 samples is computed by Eq.(1).
(1)
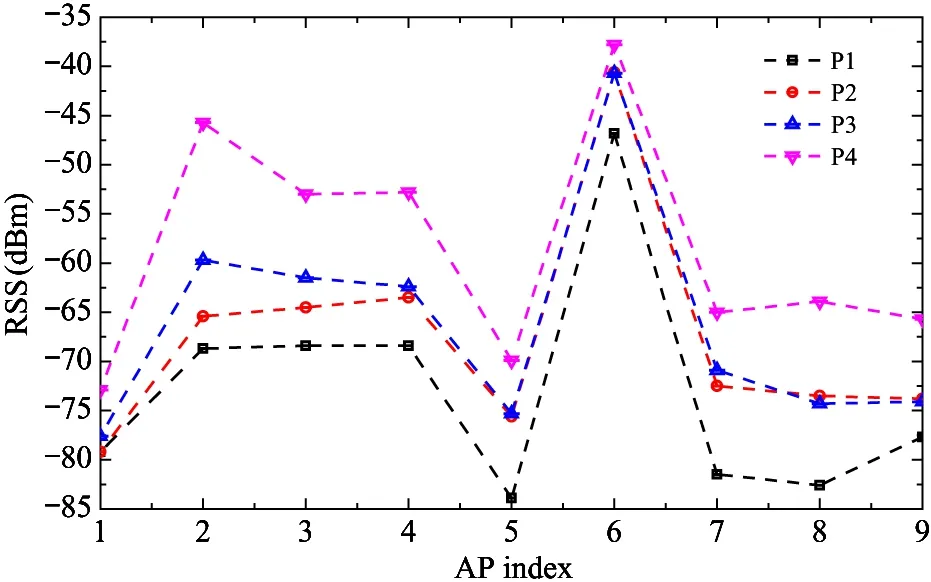
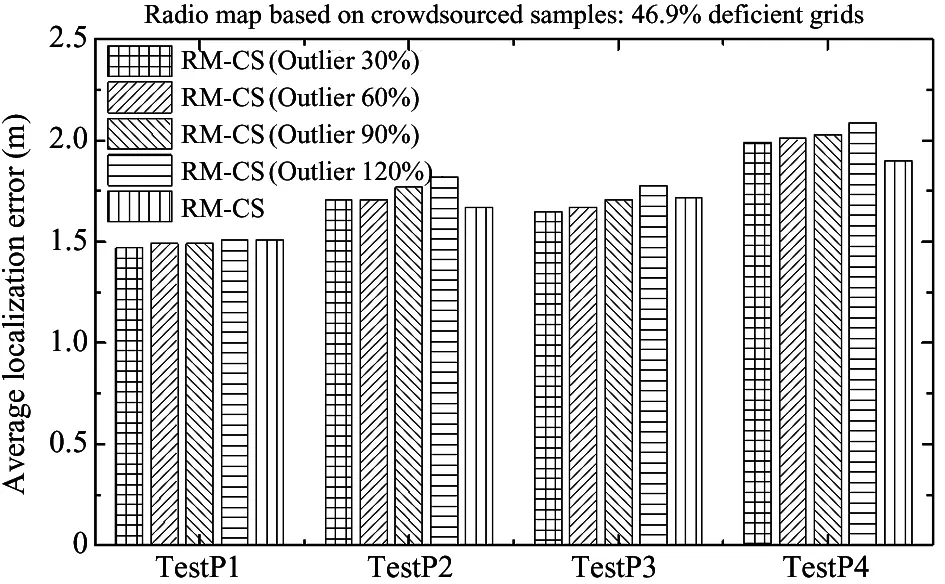
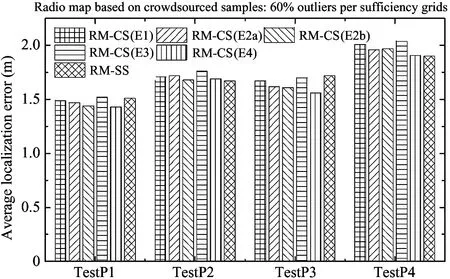
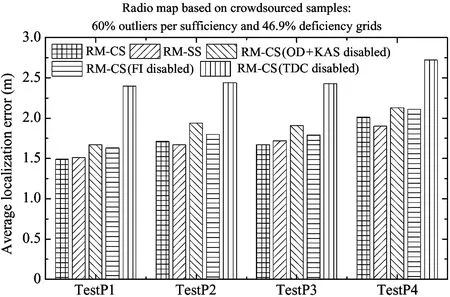
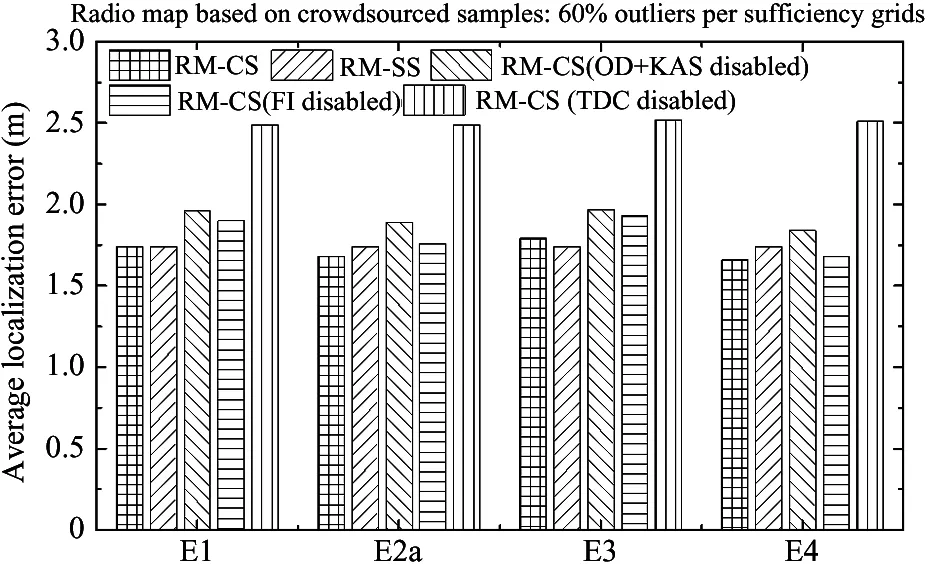
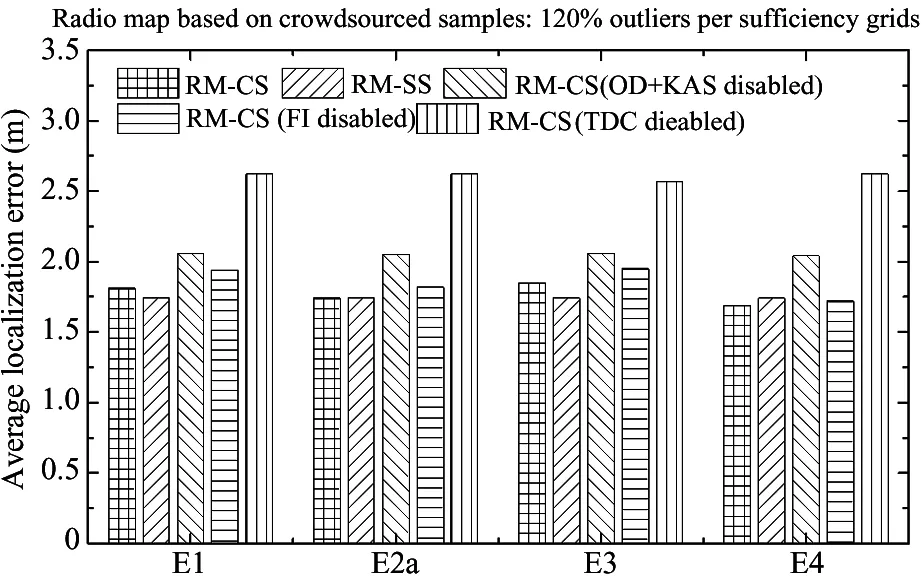
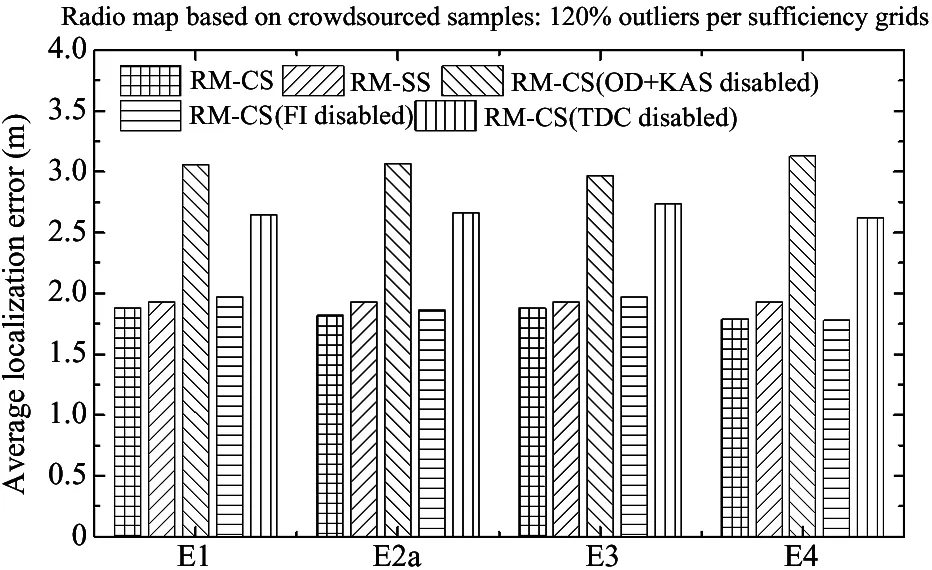
Two thresholds are further defined[12]as the density thresholdρTand the cutoff distancedc. If there isdnn′ Algorithm 1 Cluster-based iterative outlier detection During the outlier detection, the samplesibeing detected as the outlier may make its neighbor samplesjwith a small distance be an outlier as well. In fact, if the local density satisfiesρj>ρTat the first iteration, the samplesjmay be a normal value at this time, but the abnormal valuesiis already included in the calculation ofρj(the number of neighbors ofsj). After deleting the outliers, such problem can be solved by the proposed scheme through recalculating the local density of the samples for each iteration. To solve this problem, a source selection algorithm based on the AP acceptance rate is proposed to select a proper subset of APs for effective localization to help construct device-specific fingerprints for each device. LetNmdenote the number of non-empty elements in themth column inR(1). The acceptance rate of themth AP is defined asPm=Nm/N(1)and the acceptance rate threshold isPT. If there isPm After selecting the key AP, a newN(2)×M(2)RSS matrixR(2)can be constructed for each device in the grid, with the elementrnmin the matrix representing the RSS value obtained from themth AP in thenth sample. Next, a common RSS averaging method is used to construct the device-specific fingerprintffor each grid. The average RSS of themth AP can be obtained by (2) wherer·mis themth column vector ofR(2), so as to construct the device specific fingerprint asf=(r1,…,rM(2)). The fact that crowdsourcing is adopted to collect the samples randomly may result in uneven distribution in the entire indoor environment. Some grids may have little or no crowdsourcing samples at all. For example, there may be fewer crowdsourced samples at the edge of the classroom than those at the central area of the classroom. Aiming at such problem, the proposed WRMCS scheme established a fingerprint interpolation module for the deficient grid lack of samples. A fingerprint will be selected by such module from a neighboring sufficient grid in the same subarea to be inserted as a device-specific fingerprint. A fingerprint interpolation algorithm is proposed based on surface fitting technology. An interpolated fingerprint candidate set will be constructed before the fingerprint interpolation process with the pseudo code of the proposed algorithm given in Algorithm 2, whereGis the set of all the grids in one subarea, andGSis the set of interpolated fingerprint candidates. Algorithm 2 Perform fingerprint interpolation on the deficient grid (3) (4) where,ωcdis a polynomial coefficient. The specific position coordinates input will achieve a deterministic RSS results byφm. Different types of mobile phones participating in crowdsourced fingerprint collection have different antennas and receiver gains, which may cause at least 2 problems: (1) Sample measurements from the same source may be different even at the same place; (2) Much storage space and computing time may be taken to create multiple grid fingerprints for one specific device. Therefore, a new inter-device calibration algorithm is proposed based on receiver pattern analysis to calibrate specific fingerprints for different devices and combine the fingerprints collected by multiple devices into a single device-independent grid fingerprint. Fig.3 gives the comparisons of the RSS values at the same location by using 4 different devices, which shows that there are similar differences between different APs. Fig.3 Data processing flow of the proposed system (5) (6) Based on the constructed offline radio map, an improved nearest neighbor (NN) online localization algorithm is proposed by selecting the candidate grid through the number of mutual sources and determining the target grid based on the comparison of distances between transformed fingerprints. (7) (8) The transformed fingerprint used for distance calculation is defined as (9) (10) (11) The target grid will be determined by the grid with the minimum signal distance, and the corresponding grid center will be selected as the estimated position of the test fingerprint. The candidate grid selection has the following advantages: (1) only a part of the grids are selected to perform grid fingerprint conversion so as to reduce the online calculation time greatly; (2) candidate grids with more mutually detectable APs are selected, to make more APs be shared between online and offline fingerprints, which means the radio environment in gridgis more like the radio environment for testing fingerprints, so as to increase the locating accuracy. On-site measurements are performed in the Electronic Engineering College Lab Building. A total of 1 460 grids are established with the size of each grid being 0.5 m×0.5 m. The RSS measurements are taken from the existing WLAN APs using 5 different smartphones labeled as P1, P2, P3, P4 and P5, respectively. Ten samples are acquired in each grid by P1, P2, P3 and P4 to produce a total of 58 400 training samples. Each experimental device can collect 650 online test fingerprints evenly distributed in the environment, so a total of 3 250 test fingerprints can be obtained. The grid lying less than 1m away from the center of the given grid will be considered as a normal grid; otherwise, the grid will be considered as an outlier. Four device-specific online test data sets are set up as Test1, Test2, Test3, Test4, Test5, and an independent device hybrid online test data set is established as well. 4.2.1 Performance analysis of radio maps based on survey samples The proposed scheme is applied to a field survey to construct an offline radio map, being referred to as RM-SS, where each training sample is obtained within a particular sufficient grid. In this experiment, only the device calibration module is adopted to verify the ability of the proposed scheme to handle device diversity issues. Radio maps are constructed for each device based on the samples from smartphone surveys, being labeled as RM-P1, RM-P2, RM-P3 and RM-P4, respectively. In addition, a device fusion algorithm is developed to obtain the RSS averages of survey samples from all 4 devices, and a radio map called RM-DF is constructed correspondingly. Fig.4 is the comparison of the average localization errors (ALE) of the radio maps constructed using these 4 device-specific test data sets. Fig.4 Comparison of average positioning errors of radio maps It can be clearly seen from Fig.4 that RM-SS can achieve the best localization performance. In particular, it can decrease ALE by 30.09%, 19.32%, 39.65% and 43.28%, respectively, compared to the radio map RM-DF. The results verify the effectiveness of the device calibration algorithm of the proposed scheme. 4.2.2 Performance analysis of the proposed RM-CS The comparison is performed between the outlier detection algorithm with iterative process and that with once detection. The classification results are shown in Fig.5 when the ratio of the deficient grid is set to 46.9%. Fig.5 Performance comparison of outlier detection using different devices with the ratio of the deficient grid being set as 46.9% It can be seen intuitively from Fig.5 that the localization accuracy and the ability to detect outliers are worsened with the outliers increasing in both conditions. This is because the local density of outliers is proportional to the numbers within a given range, which may cause more outliers being determined as normal samples according to the density-based algorithm. In addition, the simulating results also indicate that the iterative process can achieve a lower recall rate to classify the normal values and outliers more accurately. The localization performance of RM-CS constructed by crowdsourced samples from different situations is simulated. The experiments will focus on 2 factors as the ratio of outliers in a sufficient grid and the ratio of deficient grids in all grids. For this purpose, different numbers of outliers are added to different sufficient grids to create multiple deficient grids in different degrees based on actual environmental conditions, which are mainly divided into the following cases as E1 (46.9%), E2a (34.4%), E2b (34.4%), E3 (24%) and E4 (22.9%). The numbers in parentheses represent the proportion of the deficient grids. Fig.6(a) shows the localization performance of the RM-CS containing different numbers of outliers with the ratio of the deficient grid being set as 46.9%. Fig.6(b) plots the localization performance of the RM-CS with different proportions of deficient grid when the outlier ratio in a sufficient grid is 60%. First of all, it can be observed that as the ratio of outliers in a sufficient grid and the ratio of deficient grid in all grids increase, the localization performance of the RM-CS decreases. This is because the localization is also affected by those outliers that have not been deleted, so that detecting and deleting all outliers from the sample set becomes more difficult as the outlier ratio increases. When observing Fig.6(b), it is worth noting that the localization performance of E4 is slightly better than other cases because it contains the least deficient grid that needs to perform the fingerprint interpolation module. On the other hand, in these practical scene, it can be seen from the experimental results of the 4 device-specific test data sets that the degradation of the localization performance is not obvious, which can verify the robustness of the proposed scheme. (a)The deficient grid ratio is 46.9%, including different numbers of outliers (b)The deficient grid ratio is 60%, including different numbers of outliersFig.6 RM-CS localization performance Finally, the RM-CS localization performance is investigated with some of the proposed modules disabled to produce the common cases for the conditions with the outlier ratio as 60% and the deficient grid ratio as 46.9%. Fig.7 reveals the average localization errors of RM-CS by 4 device-specific online testing data sets. It indicates that when some modules of the proposed scheme are disabled, the ALE of the RM-CS may be increased by up to 37.91%. Fig.7 Average localization error of RM-CS in 4 In addition, the positioning performance of RM-CS is simulated in the equipment hybrid test data set with some modules of the proposed scheme being deactivated. The average localization error of the radio map containing 60% and 120% outliers in each of the sufficient grids, respectively, are shown in Fig.8(a) and Fig.8(b). The proposed scheme with crowdsourced samples can achieve the similar localization performance compared to the scheme using survey samples from 2 test data sets (that is, using RM-CS and RM-SS for localization). The results not only verify the validity of the proposed modules, but also verify the effectiveness of the overall scheme of radio map construction. (a) 60% abnormal sample in each sufficient grid (b) 120% abnormal sample in each sufficient gridFig.8 Average localization error for radio maps containing 60% and 120% anomalous samples in each sufficient grid 4.2.3 Performance analysis using new equipment data sets In fact, online test fingerprints may come from new devices which are not applied to offline radio map construction. A test fingerprint from another smartphone P5 is adopted to check the applicability of the radio map. In the experiments, the localization performance of RM-CS constructed by crowdsourcing samples collected by P5 is compared in the case of E1, E2a, E3 and E4 with some of the proposed modules disabled. Fig.9(a) and Fig.9(b) plot the average localization error of a radio map containing 60% and 120% outliers in each of the sufficient grids. It shows that when some modules of the proposed scheme are disabled, the ALE of the radio map RM-CS constructed with the new device will increase, and the maximum possible increase is 42.81%. The results verify the applicability of the proposed scheme. (a) 60% abnormal sample in each sufficient grid (b) 120% abnormal sample in each sufficient gridFig.9 Locating performance of RM-CS constructed using crowdsourced samples collected by P5 when deactivating some of the proposed modules Aiming at the problems of inaccurate location annotation of samples, invalid access points (AP), uneven distribution of samples and diversity of terminal devices, a new WLAN radio map constructing scheme (WRMCS) is proposed based on the crowdsourced samples. This scheme can not only detect and delete those samples with wrong annotations, but can select valid APs to form device-specific fingerprints, which will be merged into a single device-independent grid fingerprint. The solution can also perform fingerprint interpolation on the defect grid, which improves the positioning performance. Simulating results show that the proposed scheme can achieve lower average localization error than other schemes and can be applied for a variety of terminal equipment, so as to verify the effectiveness and applicability of the scheme. Future research will focus on how to combine the data collected by sensors such as magnetometers and barometers of mobile terminals with traditional WLAN localization systems to improve the localization accuracy of the entire system.

2.3 Key AP selection

2.4 Fingerprint interpolation


2.5 Terminal device calibration


3 Online localization algorithm


4 Experimental and simulation results analysis
4.1 Experiment setup
4.2 Experimental results



5 Conclusion
 High Technology Letters2020年4期
