
Exploring sensitive area in the tropical Indian Ocean for El Niño prediction: implication for targeted observation*
2020-11-26 08:32:14ZHOUQianDUANWansuoHUJunya
ZHOU Qian , DUAN Wansuo , , HU Junya
1 National Marine Environmental Forecasting Center, Ministry of Natural Resources, Beijing 100081, China
2 Key Laboratory of Research on Marine Hazards Forecasting, National Marine Environmental Forecasting Center, Beijing 100081, China
3 LASG, Institute of Atmospheric Physics, Chinese Academy of Sciences, Beijing 100029, China
4 University of Chinese Academy of Sciences, Beijing 100049, China
5 Key Laboratory of Ocean Circulation and Waves, Institute of Oceanology, Chinese Academy of Sciences, Qingdao 266071, China
Abstract Based on initial errors of sea temperature in the tropical Indian Ocean that are most likely to induce spring predictability barrier (SPB) for the El Niño prediction, the sensitive area of sea temperature in the tropical Indian Ocean for El Niño prediction starting from January is identifi ed using the CESM1.0.3 (Community Earth System Model), a fully coupled global climate model. The sensitive area locates mainly in the subsurface of eastern Indian Ocean. The eff ectiveness of applying targeted observation in the sensitive area is also evaluated in an attempt to improve the El Niño prediction skill. The results of sensitivity experiments indicate that if initial errors exist only in the tropical Indian Ocean, applying targeted observation in the sensitive area in the Indian Ocean can signifi cantly improve the El Niño prediction. In particular, for SPB-related El Niño events, when initial errors of sea temperature exist both in the tropical Indian Ocean and the Pacifi c Ocean, which is much closer to the realistic predictions, if targeted observations are conducted in the sensitive area of tropical Pacifi c, the prediction skills of SPB-related El Niño events can be improved by 20.3% in general. Moreover, if targeted observations are conducted in the sensitive area of tropical Indian Ocean in addition, the improvement of prediction skill can be increased by 25.2%. Considering the volume of sensitive area in the tropical Indian Ocean is about 1/3 of that in the tropical Pacifi c Ocean, the prediction skill improvement per cubic kilometer in the sensitive area of tropical Indian Ocean is competitive to that of the tropical Pacifi c Ocean. Additional to the sensitive area of the tropical Pacifi c Ocean, sensitive area of the tropical Indian Ocean is also a very eff ective and cost-saving area for the application of targeted observations to improve El Niño forecast skills.
Key word: tropical Indian Ocean; El Niño prediction; sensitive area; targeted observation
1 INTRODUCTION
El Niño-Southern Oscillation (ENSO), a prominent climate phenomenon originated in the Tropical Pacifi c, is the strongest interannual climate signal and has widespread infl uence on the global climate system (Philander, 1983). The occurrence of El Niño event can induce extreme weather and climate events across the globe, since it brings large changes in the heating of tropical atmosphere, which can alter the global atmospheric circulation (Wang et al., 2000; Alexander et al., 2002; Henderson et al., 2018). Consequently, it is of great importance to improve the prediction skills of El Niño events (Kirtman et al., 2002; Chen and Cane, 2008; Zhu et al., 2013).
El Niño prediction skills get a lot of benefi ts from the tremendous developments of ENSO monitoring, the progress in the understandings of El Niño dynamics and the improvements of the prediction models (both statistical and dynamical). The extremely strong El Niño event in 1982–1983, which came as a surprise due to the lack of real-time observation, aroused the importance of constructing an ENSO observing network in the tropical Pacifi c. Thus, the Tropical Ocean-Global Atmosphere (TOGA) program was fi rst carried out during 1985–1994. And with the continual progress, the now called Tropical Pacifi c Observing System (TPOS) has been established, including data from TAO/TRITON array, Argo profi ling fl oats, surface drifters, ships of opportunity lines of expendable bathythermograph (XBT), satellite remote sensing, and so on (McPhaden et al., 1998; Chen et al., 2018). The tremendous developments on the El Niño observing also shed light on the studies of ENSO theories. The developments of both ENSO monitoring systems and ENSO theories thus contributed to the progress of El Niño prediction models, especially the dynamic models.
Generally, El Niño events can be forecast in a lead time of 6 months to 1 year (Chen and Cane, 2008; Jin et al., 2008; Tang et al., 2018). However, considerable uncertainties in realistic El Niño predictions still exist (Luo et al., 2008; Tippett et al., 2011). Particularly, when forecasts are made throughout spring, El Niño predictions tend to be much less successful. This low predictability has been related to the so-called “Spring Predictability Barrier” (SPB) of the El Niño prediction (Webster and Yang, 1992; Latif et al., 1994; Luo et al., 2005). A number of studies have emphasized the importance of initial errors of Pacifi c Ocean in the SPB. Chen et al. (1995) suggested that SPB phenomenon in the Zebiak-Cane model could be eliminated by improving initialization. Moore and Kleeman (1996) analyzed the error growth of singular vectors related to SPB. Mu et al. (2007) explored the initial errors that are most likely to cause signifi cant SPB by computing the conditional nonlinear optimal perturbation (CNOP) (Mu et al., 2003) for El Niño events with the Zebiak-Cane model (Zebiak and Cane, 1987). Given that the Zebiak-Cane model is an intermediate complexity coupled model, a fully coupled GCM, CESM1.0.3, is further used to get a panoramic view of the sea temperature errors that are most likely to induce SPB (Duan and Hu, 2016).
For the El Niño events, status in the tropical Pacifi c is not the only source to infl uence El Niño predictions. Rather than a slave to the tropical Pacifi c, the Indian Ocean can also infl uence the tropical Pacifi c Ocean and the prediction skills of the El Niño events. Indian Ocean Dipole (IOD), as revealed by Saji et al. (1999), is an important air-sea interaction phenomenon in the tropical Indian Ocean. When the Indian Ocean is taken into account, i.e., taking the Dipole Mode Index (DMI) as one of the predictors, El Niño event can be successfully forecast 14 months before its peak by a statistical prediction model (Izumo et al., 2010, 2014). For the dynamical model, when the air-sea interactions in the tropical Indian Ocean are considered in the coupled GCM, the prediction skill of El Niño events can also be signifi cantly improved (Luo et al., 2010). The interactions between tropical Indian Ocean and the tropical Pacifi c can be due to both the atmospheric bridge and Indonesian Through Flow (ITF), the only oceanic channel between them (Alexander et al., 2002; Yuan et al., 2011; Zhou et al., 2015). Inspired by the fact that the initial state of the Indian Ocean also has non-neglectable infl uence on the El Niño prediction, Zhou et al. (2019) have found two types of IO-related initial errors of sea temperature that can easily induce SPB for the El Niño forecasts using CESM model. Initial error type-1 consists of a positive IOD-like sea temperature pattern, with positive errors in the western Indian Ocean and negative errors in the eastern Indian Ocean, while type-2 has a negative IOD-like structure that is nearly opposite to that of type-1.
It is suggested that these SPB-related initial errors in the tropical Indian may have implications for the “targeted observation” in order to improve the forecast skills (Zhou et al., 2019), but the sensitive area in the tropical Indian Ocean for the El Niño predictions remains unexplored. Speaking of targeted observation, it is an observation strategy by which the concerned phenomenon is observed. In order to get a much more precise predictions at a future timet1(verifi cation time) in a focused area (verifi cation area), additional observations are deployed at a future timet2(target time;t2<t1) in some key areas (sensitive area) where additional observations are expected to have a considerable contribution on the forecast in the verifi cation area (Snyder, 1996; Mu, 2013; Mu et al., 2015). These additional observations would be assimilated to form a more reliable initial state, which would be supplied to the model to reduce the prediction errors. One of the key points in the targeted observations is the determination of the sensitive area.
For the El Niño forecasts, Morss and Battisti (2004) had performed a series of observing system simulation experiments (OSSEs) using a linearized intermediate coupled ENSO model, with a conclusion that the eastern equatorial Pacifi c (south of equator) and the western equatorial Pacifi c may stand as the most important regions for additional observation. Yu et al. (2012) argued that the eastern equatorial Pacifi c is the sensitive area for targeted observations by using Zebiak-Cane model. Duan and Hu (2016) explored the sensitive areas in the tropical Pacifi c with a coupled GCM, and suggest that targeted observations of sea temperature in the subsurface are also crucial in order to decrease the prediction errors. Recently, Duan et al. (2018) proposed an optimal observation array, with a reversal triangle-like shape located in the eastern Pacifi c, as the sensitive area for both EP-El Niño and CP- El Niño forecasts.
Since sensitive area for the El Niño predictions in the tropical Pacifi c are widely studied, we will naturally want to unveil the sensitive area in the Indian Ocean for the El Niño forecasts since the initial sate in the tropical Indian is also a vital source of the El Niño predictability. Based on these recently revealed two types of SPB-related initial errors in the tropical Indian Ocean (Zhou et al., 2019), questions are raised: Does the large-values area of these SPBrelated initial errors in the tropical Indian stand for the sensitive area of El Niño predictions? If targeted observations are applied in the sensitive area, will the El Niño prediction skills be signifi cantly improved? How is the eff ectiveness of applying targeted observations in the sensitive area in the tropical Indian Ocean when compared with that in the tropical Pacifi c?
These questions are answered in this paper. In the next section, the model and data used in this paper are described. In Section 3, all the experimental strategies are presented. The sensitive area in the tropical Indian Ocean of the El Niño events is identifi ed, verifi ed, and compared with that in the tropical Pacifi c as shown in Section 4. Finally, the discussion and summary will be presented in Sections 5 and 6.
2 MODEL AND DATA
The coupled model used here is Community Earth System Model, version 1 (CESM1.0.3), a fullycoupled global climate model developed in National Center for Atmospheric Research (NCAR). CESM1.0.3 is comprised of interactive model components like atmosphere, ocean, land and ice, which are linked by a fl ux coupler (Hurrell et al., 2013). The atmospheric GCM CAM4 has a horizontal resolution of 0.9° latitude by 1.25° longitude with 26 vertical layers. The oceanic component POP2 is a z-level hydrostatic primitive equation ocean model with 60 vertical levels. The vertical spacing is 10 m at the surface and varies with depth. The nominal horizontal resolution is 1°×1° in the off -equatorial area with an enhanced resolution of 1/3° latitude by 1° longitude in the tropics.
As demonstrated in Zhou et al. (2019), this coupled GCM has a very well simulation of ENSO and IOD, and SPB-related initial errors in the tropical Indian Ocean are obtained by using this coupled model. Therefore, it is reasonable to use this model to identify and verify the sensitive area in the tropical Indian Ocean for the El Niño predictions.
3 EXPERIMENTAL DESIGN
In the former study, the SPB-related El Niño events and SPB-related initial errors are revealed when exploring the IO-related initial errors that are most likely to induce SPB for the El Niño predictions (Zhou et al., 2019). It is shown that, among the 20 El Niño events simulated from CESM model, 10 of them are more likely to induce SPB during the predictions, as shown in Fig.1 (here, “0”, “-1” and “1” denote the El Niño year, the preceding and subsequent year, respectively). These 10 SPB-related El Niño events are treated as the “true state”, since no initial errors are considered. From the fi xed group of 24 IO-related initial errors, 8 of them stand out as the SPB-related initial errors, which can be marked as INI_1, INI_8, INI_9, INI_11, INI_13, INI_18, INI_21, and INI_24, correspondingly. Since the locations of initial errors with large values may have implications for the sensitive area to apply targeted observations (Wang et al., 2013; Mu et al., 2014; Duan and Hu, 2016), we mainly focus on the large value area of the initial errors in an attempt to determine the sensitive area for the El Niño predictions.
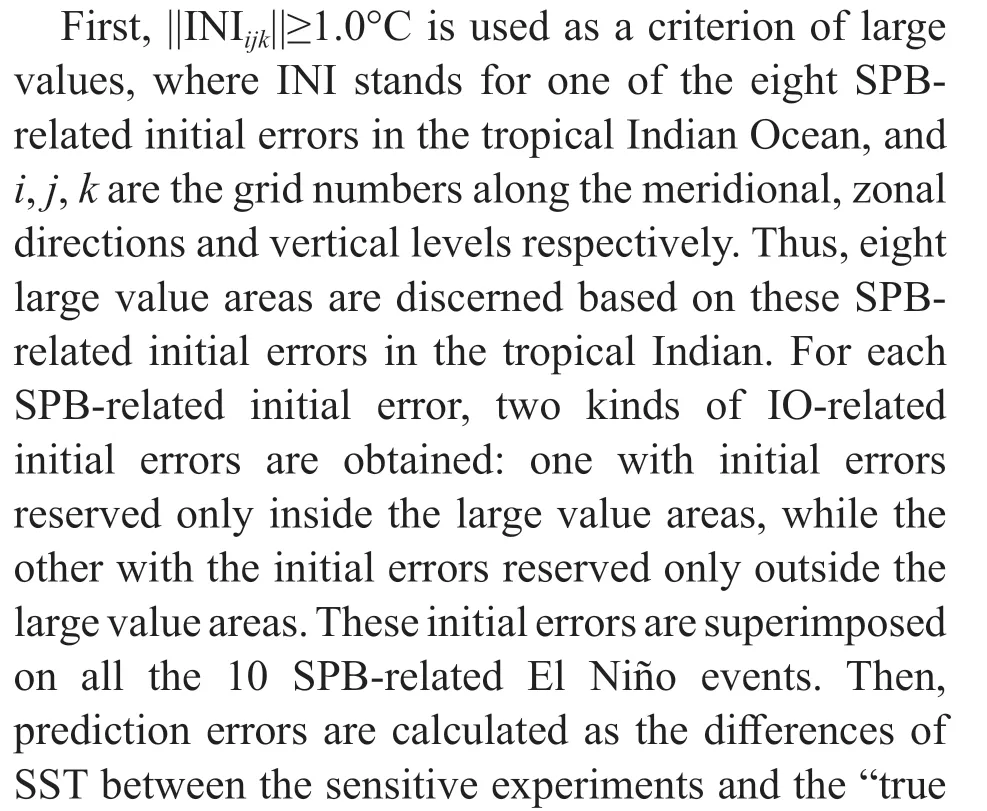

Fig.1 Niño3 index (unit: °C) for 10 SPB-related El Niño events from CESM1.0.3 (thin lines) (mean shown in bold)
Once the sensitive area is identifi ed, it needs to be further verifi ed by all the SPB-related El Niño events and SPB-related initial errors. In this study, the sensitivity experiments are conducted under the assumption that if targeted observations are carried out in the sensitive area, the initial errors there are wiped out and can be set to zero. Thus, sensitivity experiments are completed with targeted observations carried out inside the sensitive area, that is, the initial errors inside the sensitive area of all the SPB-related initial errors are wiped out. If the prediction errors can be signifi cantly reduced, the sensitive area can be verifi ed. Sensitivity experiments with targeted observations conducted outside the sensitive area are also carried out for comparison. Since the sensitive area is relatively small compared with the whole tropical Indian Ocean region, the eff ectiveness of applying targeted observations in the sensitive area in the tropical Indian can further be evaluated. Indexβis defi ned asβ=improvement of El Niño prediction skills/Volume of the area with targeted observations applied, thusβcan represent the improvement of El Niño prediction skills per km3for a certain area where targeted observations are carried out.
Based on the sensitive area in the tropical Indian Ocean determined by the former sensitivity experiments, numerous works have been done in an attempt to explore the sensitive area in the tropical Pacifi c for the El Niño predictions. Thus, it is of natural interest to compare the eff ectiveness of applying targeted observations in the sensitive areas in the tropical Indian Ocean and tropical Pacifi c. So, new initial errors are obtained by combing the SPBrelated initial errors in both tropical oceans. Here, SPB-related initial errors in the tropical Pacifi c are obtained from Duan and Hu (2016). New reference runs are gained when these new initial errors are superimposed on all these SPB-related El Niño events. Then, targeted observations are carried out in the sensitive area in the tropical Pacifi c, i.e., the initial errors in that area are removed. Furthermore, sensitivity experiments are also conducted with targeted observations applied in the sensitive areas in both oceans. The prediction errors and the indexβof these sensitivity experiments are calculated to evaluate the eff ectiveness of applying targeted observations in the sensitive areas in both tropical oceans.
4 RESULT
4.1 Identifi cation of sensitive area in the tropical Indian Ocean for El Niño prediction
In this section, we identify the sensitive area of the El Niño forecasts following the experiment design described in the second paragraph in Section 3. SPB-related initial errors and SPB-related El Niño events are taken to carry out more sensitivity experiments.
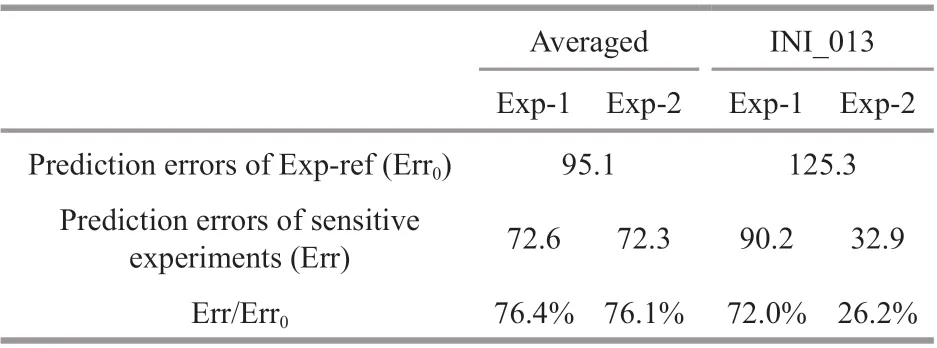
Table 1 Averaged predictions errors (Err) of all the SPBrelated initial error and that of INI_013 at the end of the El Niño predictions for reserving errors only inside/outside the large values areas, as in Exp-1/Exp-2
First, large value areas are identifi ed according to ||INIijk||≥1.0°C for each SPB-related initial error. Even though all the SPB-related initial errors in the tropical Indian Ocean can be classifi ed into two types, and initial errors that belong to the same type always share similar structures, the large value areas diff er for each SPB-related initial error. In average, the volume percentage of the large value areas in the tropical Indian is only 8.7%, i.e., the large value areas are quite small compared with the whole tropical Indian region. Two sets of sensitivity experiments are conducted based on these large value areas. For one specifi c initial error, such as INI_1, a new initial error is obtained with only initial errors inside its large value area reserved in the tropical Indian Ocean. Exp-1 is then carried out with this initial error superimposed on all the SPB-related El Nino events. Similarly, sensitive experiment Exp-2, with only initial errors outside INI_1’s large value area remained, is also completed. Besides, reference runs, marked as Expref, are also obtained with INI_1 superimposed. The same procedures are also applied to all the other SPBrelated initial errors.
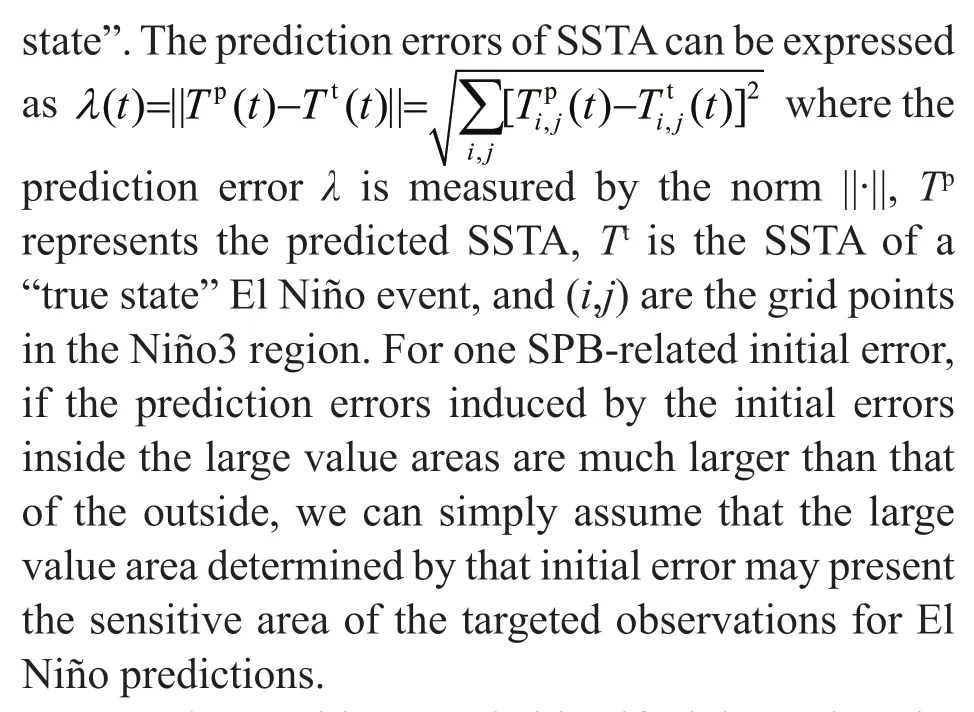
As shown in Table 1, the average prediction error induced by all the SPB-related initial errors superimposed on all the SPB-related El Niño events, i.e., Exp-ref, is 95.1, and prediction errors can averagely reach 72.6, 72.3 for Exp-1 and Exp-2 respectively. Since initial errors outside the large value areas can cause considerable prediction errors compared with that of initial errors inside them, we conclude that, not all the large value areas obtained by the SPB-related initial error can be taken as sensitive areas. Luckily, large value area determined by INI_013 stands out as one possible sensitive area in the tropical Indian for the El Niño predictions. For INI_013, the average prediction error induced by the initial errors inside its large value area can reach to 90.2, achieving 72.0% of the prediction errors of Expref, while the prediction error induced by initial errors outside it can only reach to 32.9, explaining only 26.2% of prediction errors of Exp-ref. Thus, the sensitive area of El Niño predictions in the tropical Indian Ocean is determined by the large value area of INI_013, which is shown in Fig.2. The sensitive area mainly dominates in the subsurface of the eastern Indian Ocean, ranging from 60°E to 100°E, from sea surface to 200 m underneath.
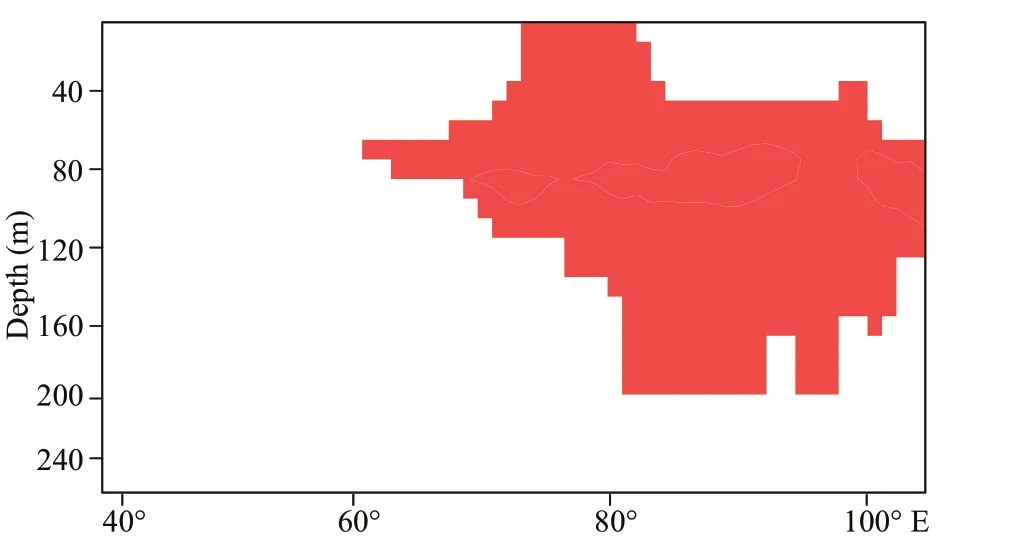
Fig.2 The sensitive area (shaded in red) of targeted observations in the tropical Indian Ocean for the El Niño predictions
4.2 Validation of the sensitive area for the El Niño prediction
In Section 4, the sensitive area in the tropical Indian Ocean of El Niño predictions is identifi ed based on the large value area of SPB-related initial error INI_013, since initial errors inside its large value area usually induce signifi cant prediction errors with SPB, while initial errors outside it only have small impact on El Niño predictions. In this section, we want to validate the eff ectiveness of applying targeted observations in the sensitive area in the tropical Indian Ocean.
Sensitive experiments with targeted observations applied inside the sensitive area, i.e., with initial errors inside the sensitive areas removed, can be denoted as “Sensi-1”, and if the prediction errors can be largely reduced compared with the “reference run”, the sensitive area can be validated. Moreover, sensitivity experiments with targeted observations applied outside the sensitive area are marked as “Sensi-2”, with initial errors outside the sensitive area wiped out. In this section, the “true state” and the reference runs are the same as that from the last section.
The results show that the prediction errors of Sensi-1 are usually much smaller than those ofSensi-2. In other words, for all these 10 El Niño events and 8 initial errors, the prediction errors caused by forecasts with targeted observations conducted inside the sensitive area are much smaller than those completed outside the sensitive area, suggesting that applying targeted observations in this sensitive area is eff ective to improve the El Niño prediction skills. The eff ectiveness of applying targeted observations in both Sensi-1 and Sensi-2 are evaluated as represented in Table 2. In general, when targeted observations are taken, either inside or outside the sensitive area, as in Sensi-1 and Sensi-2, the averaged prediction errors are reduced compared with Exp-ref. The improvement of the El Niño predictions for Sensi-1 can reach to 33.4%, while the averaged improvement for Sensi-2 is only 6.3%. In general, even though the sensitive area in the tropical Indian possesses only 9.6% volumes of the whole tropical Indian Ocean, when targeted observations are applied, the prediction skills of El Niño can be signifi cantly improved.
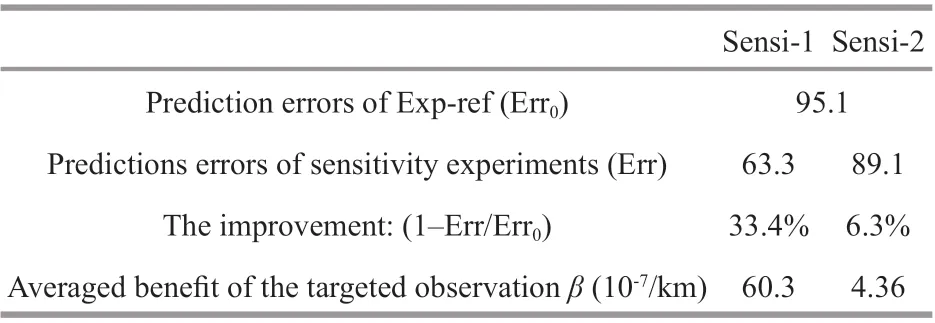
Table 2 The averaged prediction errors and averaged benefi t of the sensitivity experiments with the targeted observation applied inside/outside the sensitive area for El Niño predictions
In order to measure the average benefi t of adopting targeted observation strategy in a certain region, indexβis calculated following the defi nition in Section 3. For Sensi-2, the average benefi t of the targeted observations is 4.36×10⁻⁷/km3, while for Sensi-1, the average benefi t can reach to 60.3×10⁻⁷/km3, which is 13.8 times of sensi-2. Therefore, applying targeted observations in the sensitive area in the tropical Indian Ocean is a very effi cient way to improve El Niño prediction skills with limited fi nancial cost.
The prediction errors of SST are also displayed in Fig.3. Figure 3a is the averaged prediction errors of Exp-ref with the whole initial errors superimposed in the tropical Indian Ocean, Fig.3b & c is the prediction errors of Sensi-1 and Sensi-2 with targeted observations applied inside and outside the sensitive area in the tropical Indian Ocean, respectively. We can infer that, the initial errors in the tropical Indian Ocean can lead to large prediction errors in the tropical Pacifi c at the end of the prediction, as shown in Fig.3a. When targeted observations are employed in the sensitive area region, i.e., the initial errors in the sensitive area in the tropical Indian are eliminated, the prediction errors in the tropical Pacifi c can be reduced, as shown in Fig.3b, both the magnitude and the region of the prediction errors are signifi cantly decreased. When it comes to the results of Sensi-2 with targeted observations done outside the sensitive area, which is a relatively much larger region, the prediction errors are comparable to the reference runs as shown in Fig.3a. In short, applying targeted observations in the sensitive area in the tropical Indian Ocean can signifi cantly reduce the prediction errors of El Niño related SSTA.
Furthermore, the averaged SSTA at the end of the predictions are also shown in Fig.4. Figure 4a is the averaged SSTA in the tropical oceans of the “true” El Niño events to be predicted, Fig.4b shows the predicted SSTA when the whole initial errors in the tropical Indian Ocean are added, while Fig.4c & d represent the predicted SSTA with targeted observations conducted inside and outside the sensitive area in the tropical Indian Ocean. In general, the El Niño events to be predicted in this paper are very strong with signifi cant warming in the eastern Pacifi c. When initial errors of sea temperature exist in the tropical Indian Ocean, only a weak warming in the tropical Pacifi c is forecast. Therefore, targeted observations need to be conducted. When additional observations are done in the sensitive area, the predictions are improved with a much better forecast in the Pacifi c. However, when the targeted observations are completed outside the sensitive area which is a much larger region than the sensitive area, the improvement of El Niño predictions is limited.
The Anomaly Correlation Coeffi cients (ACC) and Root Mean Square Error (RMSE) are also calculated between the predictions and the “true state” of the El Niño events, as shown in Fig.5. For the reference runs superimposed with the whole initial errors in the Indian Ocean, the ACC (in black) experiences a large drop from July to the end of the prediction, while the RMSE increases quickly during July to October, reaching a maximum of 2.81°C at the end of the prediction. For Sensi-2 (in red), when targeted observations are carried out outside the sensitive area, even though the RMSE is relatively smaller when compared with reference runs, the ACC is very close to the reference runs. However, for the predictions of Sensi-1 (in blue) with targeted observations applied inside the sensitive area, the RMSE is signifi cantly reduced to a maximum of 1.24°C, and the ACC is 0.863, which is much higher than that of Sensi-1 (0.803) and reference runs (0.797). The signifi cant improvement of the El Niño predictions, with an increase of ACC and a big decline of RMSE, indicate that applying targeted observations in the sensitive area in the tropical Indian Ocean is an eff ective method to get a better El Niño forecast.
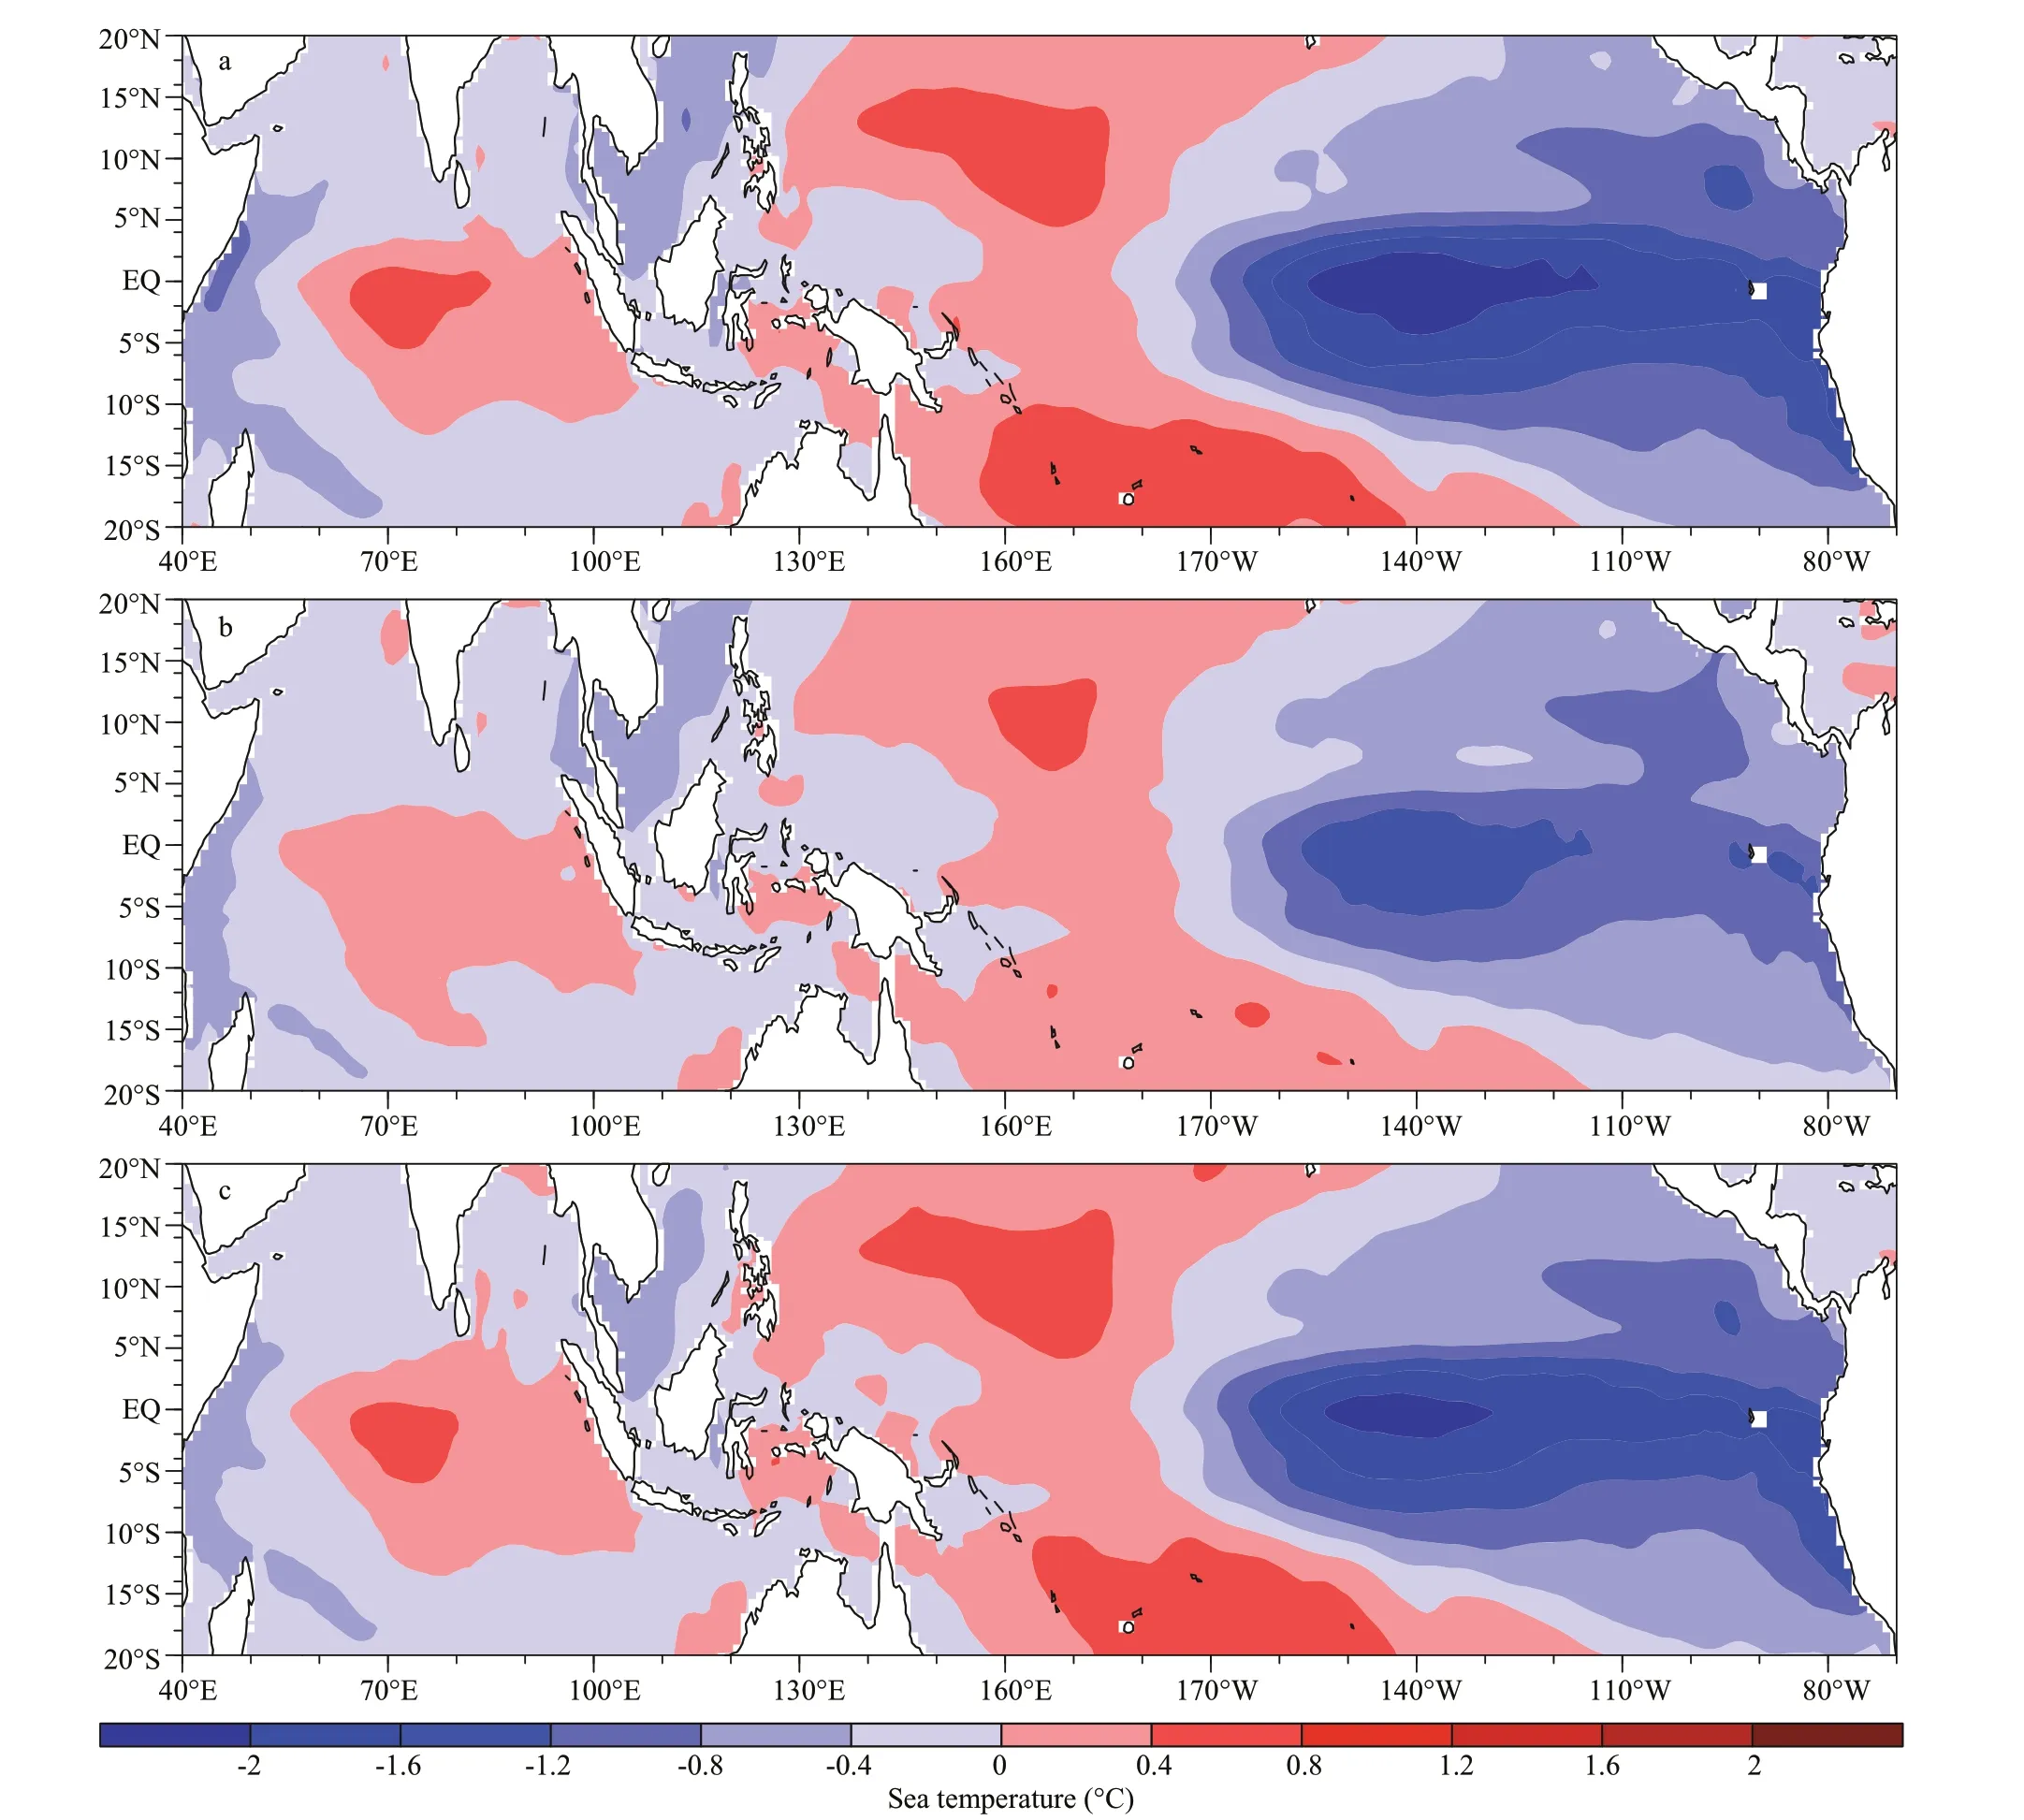
Fig.3 Prediction errors in Dec(0) in the tropical oceans for El Niño predictions starting from Jan(0)
To sum up, the sensitive area identifi ed by INI_013 is validated by more sensitivity experiments, and the eff ectiveness of applying targeted observations in this sensitive area in the tropical Indian Ocean is evaluated. In a very idealistic scenario with initial errors exist only in the tropical Indian Ocean; applying targeted observations in the sensitive area in the tropical Indian Ocean is a very useful and cost-saving way to improve the prediction skills of El Niño events.
4.3 Implications for targeted observations in a more realistic El Niño prediction scenario
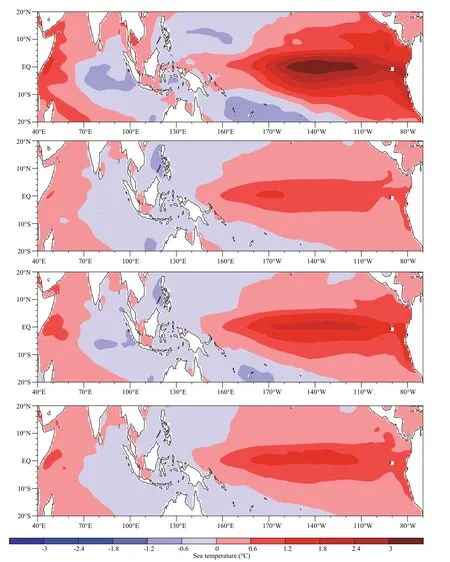
Fig.4 Predicted SSTA in Dec(0) in the tropical oceans for El Niño predictions starting from Jan(0)
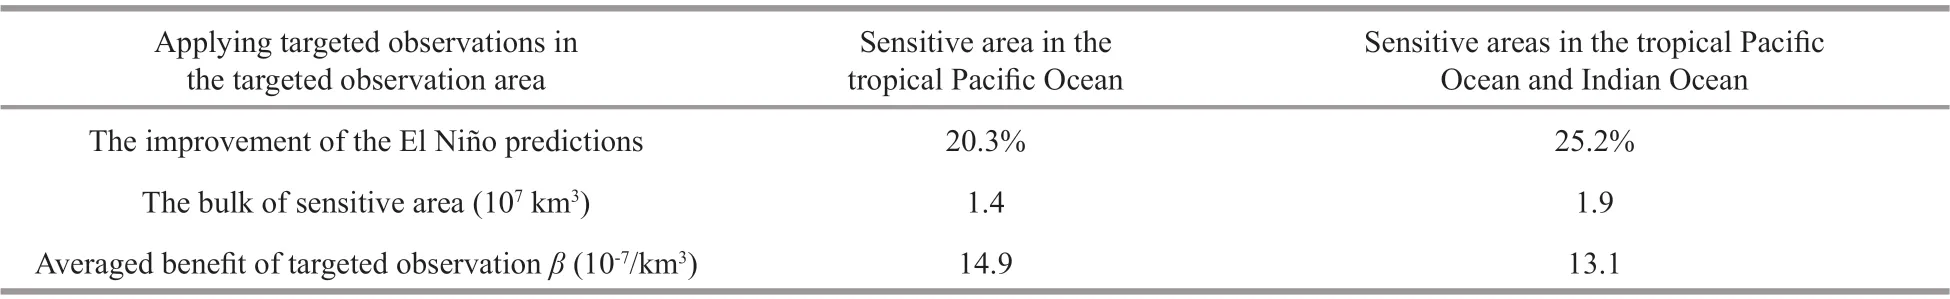
Table 3 The contribution of applying targeted observations in the sensitive areas in the tropical Pacifi c and the tropical Indian to the improvement of the El Niño predictions when initial errors in both oceans are considered
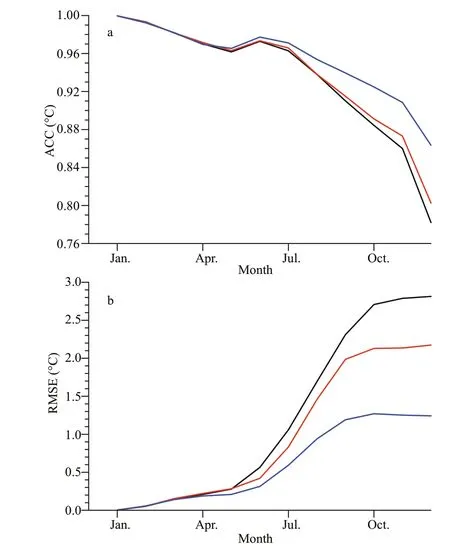
Fig.5 The ACC (a) and RMSE (b) between the SSTA of El Niño events (the “true state”) and the reference runs with the whole initial errors in the tropical Indian Ocean (line in black), and between those sensitivity experiments with targeted observation applied inside/outside the sensitive area in the tropical Indian Ocean (line in blue/red respectively)
In a more realistic scenario of El Niño prediction, the initial errors of sea temperature exist not only in the tropical Indian, but also in the tropical Pacifi c. The sensitive area in the tropical Pacifi c Ocean has been explored in many studies (Yu et al., 2012; Duan and Hu, 2016; Duan et al., 2018), and applying targeted observations in the sensitive area in the tropical Pacifi c, rather than other regions in the Pacifi c, can signifi cantly improve the forecast skills of the El Niño predictions.
Based on the sensitive area defi ned in the tropical Pacifi c, together with the sensitive area verifi ed in the tropical Indian in this work, more experiments are performed to estimate the contribution of applying targeted observations in the sensitive area in the tropical Indian Ocean. Here, new reference runs are slightly diff erent from previous experiments, since initial errors of sea temperature in both tropical oceans are considered. These new reference runs of 10 El Niño events are marked as “Sensi-ref”. When targeted observations are executed in the sensitive area in the tropical Pacifi c, i.e., initial errors inside the sensitive area of the Pacifi c are eliminated, we get a set of sensitivity experiments which can be marked as “Sensi-PO”. Similarly, when targeted observations are carried out in the tropical Indian Ocean in addition, sensitivity experiments “Sensi-IPO” are obtained.
The diff erences between these predictions and the “true state” of El Niño events thus present the prediction errors of these experiments, and the diff erences between the Sensi-IO, Sensi-IPO, and Sensi-ref can indicate the contributions of applying targeted observations in these sensitive areas to obtain a better El Niño forecast.
The improvements of El Niño prediction skills with targeted observations conducted are listed in Table 3. In this much more realistic scenario, when targeted observations are applied only in the sensitive area in the tropical Pacifi c Ocean, the El Niño prediction skills can be improved by 20.3% compared with that of the Sensi-ref. When targeted observations are further carried out in the sensitive area in the tropical Indian, in average, the improvement of El Niño prediction skills can be further increased to 25.2%. Even though the improvement of applying targeted observations in the tropical Indian Ocean in addition is limited to about 5%, what we cannot neglect is that, the sensitive area in the tropical Indian Ocean is only 0.5×10⁷km3, which is only 1/3 of that in the tropical Pacifi c.β, the average benefi t of targeted observation is also calculated. As a result,βis 14.9×10⁻⁷/km3evaluated from Sensi-PO, and the average benefi t for conducting targeted observations in the sensitive area in both oceans, i.e.,βof Sensi-IPO, is about 13.1×10⁻⁷/km3, which is very close to that of Sensi-PO. Therefore, we can simply infer that, sensitive area in the tropical Indian Ocean is also a very eff ective sensitive area to conduct targeted observations in order to improve El Niño prediction skills with limited cost.
Results of predicted SSTA in all these sensitivity experiments are shown in Fig.6. Figure 6a gives the average of the “true state” of the 10 El Niño events to be predicted. Figure 6b shows the averaged SSTA forecast with initial errors added in both tropical oceans. We can infer that, when initial errors of sea temperature exist in both tropical oceans, it is very diffi cult to correctly predict the El Niño signals. For Sensi-PO, when initial errors in the sensitive area in the tropical Pacifi c are wiped out, the prediction results can be signifi cantly improved, as shown in Fig.6c, even though the predicted intensity of El Niño event is much weaker than the “true state”. When targeted observations are carried out in the sensitive area in the tropical Indian Ocean in addition, the average prediction can be further improved as shown in Fig.6d, that is, in general, the El Niño forecasts are improved with stronger intensity and larger warming area compared with that of Fig.6c.
Therefore, when initial errors of sea temperature exist in both the tropical Pacifi c and the tropical Indian, in addition, sensitive area in the tropical Pacifi c, sensitive area in the tropical Indian Ocean stands out as another eff ective area to apply targeted observation in order to improve El Niño prediction skills.
5 DISCUSSION
As shown in Fig.2, the sensitive area of El Niño predictions in the tropical Indian mainly locates in the subsurface of eastern Indian Ocean. What makes the eastern Indian Ocean, rather than other regions, like western Indian Ocean, much more sensitive to the El Niño prediction?
One reason may be the asymmetry between the west pole and east pole. Climatologically, the thermocline in the East Indian Ocean is much deeper than that in the west. And the variance of sea temperature in the east pole is much larger than that of west pole, both in the observation (Wajsowicz, 2004) and simulated in the climate models (Song et al., 2007; Liu et al., 2014). For some IOD events, like 1961 and 1994, the amplitude of mean SSTA in the east pole even exceeds twice the amplitude of mean SSTA in the west pole during the peak of an IOD event (Sun et al., 2014). Thus, the eastern Indian Ocean may stand out as the most valuable area to apply targeted observations.
Besides, the dynamical mechanism of IO-related initial errors infl uencing SSTA predictions in the tropical Pacifi c Ocean is another important factor that cannot be neglected.
As presented in the previous work, there are two ways for SPB-related initial errors in the tropical Indian Ocean infl uencing tropical Pacifi c (Zhou et al., 2019). For initial error type-1 that consists of positive IOD-like structure, the negative sea temperature errors in the eastern tropical Indian Ocean can result in upwelling errors with negative SSH errors there. Those upwelling errors further intrude into western Pacifi c through ITF, propagate eastward and develop into a La Niña-like sea temperature error. During the error evolution, initial errors in the eastern Indian Ocean seem to dominate as the leading factor infl uencing El Niño predictions. For initial error type-2 with negative sea temperature errors in the western Indian and positive errors in the east, the warm errors in the eastern tropical Indian can result in rising errors in the atmosphere over the eastern Indian Ocean. Those rising errors in the atmosphere can further drive the GIP (Gearing between the Indian and Pacifi c Ocean (Wu and Meng, 1998)) with easterly wind errors and sinking errors over the eastern Pacifi c, which are in favor of the evolution of La Niña-like errors associated with ENSO. We have to stress that, initial errors in the eastern Indian are also essential during the whole error evolution of type-2. In a word, for both types of SPB-related initial errors in the tropical Indian, it may be the initial errors in the eastern Indian Ocean that play crucial roles during the error evolution and can signifi cantly infl uence the predictability of El Niño events.
6 CONCLUSION
In this paper, sensitive area in the tropical Indian Ocean of the El Niño predictions has been identifi ed and validated. For El Niño predictions starting in January, the sensitive area defi ned in the tropical Indian Ocean mainly locates in the subsurface of the eastern tropical Indian.

Fig.6 Predicted SSTA in Dec(0) in the tropical oceans for El Niño predictions with initial errors in both oceans are considered
Considering a relatively ideal scenario, i.e., initial errors of sea temperature exist only in the tropical Indian Ocean, for the sensitive area in the tropical Indian Ocean, initial errors inside this small area tend to cause large prediction errors with signifi cant SPB during the predictions, while initial errors outside this area can only result in relatively small prediction errors without SPB. Moreover, conducting targeted observations in this sensitive area can signifi cantly improve the El Niño prediction skills.β(an index to evaluate the eff ectiveness of applying targeted observations) of sensitive area in the tropical Indian Ocean for the El Niño prediction is much larger than that of non-sensitive area, indicating that applying targeted observations in this sensitive area in the tropical Indian Ocean is a very effi cient way to obtain a better El Niño forecast. When it comes to a more realistic scenario, initial errors of sea temperature exist in both the tropical Indian and the tropical Pacifi c, the results suggest that, additional to the sensitive area in the tropical Pacifi c, sensitive area in the tropical Indian which is defi ned in this paper, shares similarβwith that of sensitive area in the tropical Pacifi c, suggesting that the sensitive area in the tropical Indian Ocean is also an eff ective area to apply targeted observations in order to improve El Niño prediction skills.
In this paper, only SPB-related El Niño events are focused on, that is because these SPB-related El Niño are more likely to have SPBs during the El Niño predictions. Therefore, the average prediction skills of El Niño events may benefi t more from the improvements of those SPB-related El Niño events, rather than the others. Even though, sensitivity experiments with more El Niño events (including El Niño events that are not likely to induce SPBs) are still needed to validate the eff ectiveness of applying targeted observations in this sensitive area in the future. We should also mention that, in this paper, all the results are based on the “perfect model” assumption, and only El Niño events simulated from the CESM model are studied, the results should be verifi ed by more sensitivity experiments completed the real El Niño predictions. In the future, studies on the sensitive areas for targeted observations in the real El Niño predictions, luckily, observation data from the Indian Ocean Observing System (IndOOS) which consists of a basin-wide mooring array, XBTs, plenty of Argo fl oats and surface drifters (for more details: http://www.clivar.org/clivar-panels/indian/IndOOS) are available, and can be used to fi lter the initial errors in the sensitive areas.
In this study, only the El Niño predictions starting from January are focused on, we naturally wonder will the sensitive area in the tropical Indian Ocean for the El Niño forecasts change if we conduct El Niño predictions starting from diff erent months? Additional to the sensitive area of sea temperature, sea water salinity is also a very important physical variable, thus, what will sensitive area of sea water salinity in the tropical Indian Ocean for the El Niño predictions like? When it comes to La Niña forecast, which is the negative phase of ENSO, where does the sensitive area in the tropical Indian Ocean locate? These questions should be explored in detail in the future.
7 DATA AVAILABILITY STATEMENT
The datasets generated and/or analyzed during the study are available from the corresponding author.
References
Alexander M, Bladé I, Newman M, Lanzante J R, Lau N C, Scott J D. 2002. The atmospheric bridge: The infl uence of ENSO teleconnections on air-sea interaction over the global oceans.JournalofClimate, 15(16): 2 205-2 231, https://doi.org/10.1175/1520-0442(2002)015<2205:tabtio >2.0.co;2.
Chen D K, Cane M A. 2008. El Niño prediction and predictability.JournalofComputationalPhysics, 227(7): 3 625-3 640, https://doi.org/10.1016/j.jcp.2007.05.014.
Chen D K, Smith N, Kessler W. 2018. The evolving ENSO observing system.NationalScienceReview, 5(6): 805-807, https://doi.org/10.1093/nsr/nwy137.
Chen D K, Zebiak S E, Busalacchi A J, Cane M A. 1995. An improved procedure for EI Niño forecasting: implications for predictability.Science, 269(5231): 1 699-1 702, https://doi.org/10.1126/science.269.5231.1699.
Duan W S, Hu J Y. 2016. The initial errors that induce a signifi cant “spring predictability barrier” for El Niño events and their implications for target observation: results from an earth system model.ClimateDynamics, 46(11-12): 3 599-3 615, https://doi.org/10.1007/s00382-015-2789-5.
Duan W S, Li X Q, Tian B. 2018. Towards optimal observational array for dealing with challenges of El Niño-Southern Oscillation predictions due to diversities of El Niño.ClimateDynamics, 51(9-10): 3 351-3 368, https://doi.org/10.1007/s00382-018-4082-x.
Henderson D S, Kummerow C D, Berg W. 2018. ENSO Infl uence on TRMM tropical oceanic precipitation characteristics and rain rates.JournalofClimate, 31(10): 3 979-3 998, https://doi.org/10.1175/jcli-d-17-0276.1.
Hurrell J W, Holland M M, Gent P R, Ghan S, Kay J E, Kushner P J, Lamarque J F, Large W G, Lawrence D, Lindsay K, Lipscomb W H, Long M C, Mahowald N, Marsh D R, Neale R B, Rasch P, Vavrus S, Vertenstein M, Bader D, Collins W D, Hack J J, Kiehl J, Marshall S. 2013. The community earth system model: a framework for collaborative research.BulletinoftheAmericanMeteorologicalSociety, 94(9): 1 339-1 360, https://doi.org/10.1175/BAMS-D-12-00121.1.
Izumo T, Lengaigne M, Vialard J, Luo J J, Yamagata T, Madec G. 2014. Infl uence of Indian Ocean dipole and Pacifi c recharge on following year’s El Niño: interdecadal robustness.ClimateDynamics, 42(1-2): 291-310, https://doi.org/10.1007/s00382-012-1628-1.
Izumo T, Vialard J, Lengaigne M, Montegut C D B, Behera S K, Luo J J, Cravatte S, Masson S, Yamagata T. 2010. Infl uence of the state of the Indian Ocean dipole on the following year’s El Niño.NatureGeoscience, 3(3): 168-172, https://doi.org/10.1038/ngeo760.
Jin E K, Kinter III J L, Wang B, Park C K, Kang I S, Kirtman B P, KUG J S, Kumar A, LUO J J, Schemm J, Shukla J, Yamagata T. 2008. Current status of ENSO prediction skill in coupled ocean–atmosphere models.ClimateDynamics, 31(6): 647-664, https://doi.org/10.1007/s00382-008-0397-3.
Kirtman B P, Shukla J, Balmaseda M, Graham N, Penland C, Xue Y, Zebiak S. 2002. Current status of ENSO forecast skill: A report to the Climate Variability and Predictability (CLsIVAR) Numerical Experimentation Group (NEG). CLIVAR Working Group on Seasonal to Interannual Prediction.
Latif M, Barnett T P, Cane M A, Flugel M, Graham N E, Von Storch H, Xu J S, Zebiak S E. 1994. A review of ENSO prediction studies.ClimateDynamics, 9(4-5): 167-179, https://doi.org/10.1007/bf00208250.
Liu L, Xie S P, Zheng X T, Li T, Du Y, Huang G, Yu W D. 2014. Indian Ocean variability in the CMIP5 multi-model ensemble: the zonal dipole mode.ClimateDynamics, 43(5-6): 1 715-1 730, https://doi.org/10.1007/s00382-013-2000-9.
Luo J J, Masson S, Behera S K, Yamagata T. 2008. Extended ENSO predictions using a fully coupled ocean–atmosphere model.JournalofClimate, 21(1): 84-93, https://doi.org/10.1175/2007JCLI1412.1.
Luo J J, Masson S, Behera S, Shingu S, Yamagata T. 2005. Seasonal climate predictability in a coupled OAGCM using a diff erent approach for ensemble forecasts.JournalofClimate, 18(21): 4 474-4 497, https://doi.org/10.1175/JCLI3526.1.
Luo J J, Zhang R C, Behera S K, Masumoto Y, F Jin F F, Lukas R, Yamagata T. 2010. Interaction between El Niño and extreme Indian Ocean dipole.JournalofClimate, 23(3): 726-742, https://doi.org/10.1175/2009jcli3104.1.
McPhaden M J, Busalacchi A J, Cheney R, Donguy J R, Gage K S, Halpern D, Ji M, Julian P, Meyers G, Mitchum G T, Niiler P P, Picaut J, Reynolds R W, Smith N, Takeuchi K. 1998. The tropical ocean-global atmosphere observing system: a decade of progress.JournalofGeophysicalResearch:Oceans, 103(C7): 14 169-14 240, https://doi.org/10.1029/97JC02906.
Moore A M, Kleeman R. 1996. The dynamics of error growth and predictability in a coupled model of ENSO.QuarterlyJournaloftheRoyalMeteorologicalSociety, 122(534): 1 405-1 446, https://doi.org/10.1002/qj.49712253409.
Morss R E, Battisti D S. 2004. Evaluating observing requirements for ENSO prediction: experiments with an intermediate coupled model.JournalofClimate, 17(16): 3 057-3 073, https://doi.org/10.1175/1520-0442(2004) 017<3057:EORFEP>2.0.CO;2.
Mu M, Duan W S, Chen D K, Yu W D. 2015. Target observations for improving initialization of high-impact ocean-atmospheric environmental events forecasting.NationalScienceReview, 2(2): 226-236, https://doi.org/10.1093/nsr/nwv021.
Mu M, Duan W S, Wang B. 2003. Conditional nonlinear optimal perturbation and its applications.NonlinearProcessinGeophysics, 10(6): 493-501.
Mu M, Wang Q, Duan W S, Jiang Z N. 2014. Application of conditional nonlinear optimal perturbation to targeted observation studies of the atmosphere and ocean.JournalofMeteorologicalResearch, 28(5): 923-933, https://doi.org/10.1007/s13351-014-4057-8.
Mu M, Xu H, Duan W S. 2007. A kind of initial errors related to “spring predictability barrier” for El Niño events in Zebiak-cane model.GeophysicalResearchLetters, 34(3): L03709, https://doi.org/10.1029/2006GL027412.
Mu M. 2013. Methods, current status, and prospect of targeted observation.ScienceChinaEarthSciences, 56(12): 1 997-2 005, https://doi.org/10.1007/s11430-013-4727-x.
Philander S G H. 1983. El Niño southern oscillation phenomena.Nature, 302(5906): 295-301.
Saji N H, Goswami B N, Vinayachandran P N, Yamagata T. 1999. A dipole mode in the tropical Indian Ocean.Nature, 401(6751): 360-363, https://doi.org/10.1038/43854.
Snyder C. 1996. Summary of an informal workshop on adaptive observations and FASTEX.BulletinoftheAmericanMeteorologicalSociety, 77(5): 953-961.
Song Q, Vecchi G A, Rosati A J. 2007. Indian Ocean variability in the GFDL coupled climate model.JournalofClimate, 20(13): 2 895-2 916, https://doi.org/10.1175/jcli4159.1.
Sun S W, Fang Y, Tana, Liu B C. 2014. Dynamical mechanisms for asymmetric SSTA patterns associated with some Indian Ocean Dipoles.JournalofGeophysicalResearch:Oceans, 119(5): 3 076-3 097, https://doi.org/10.1002/ 2013jc009651.
Tang Y M, Zhang R H, Liu T, Duan W S, Yang D J, Zheng F, Ren H L, Lian T, Gao C, Chen D K, Wu M. 2018. Progress in ENSO prediction and predictability study.NationalScienceReview, 5(6): 826-839, https://doi.org/10.1093/nsr/nwy105.
Tippett M K, Barnston A G, Li S H. 2011. Performance of recent multimodel ENSO forecasts.JournalofAppliedMeteorologyandClimatology, 51(3): 637-654, https://doi.org/10.1175/JAMC-D-11-093.1.
Wajsowicz R C. 2004. Climate variability over the tropical Indian Ocean sector in the NSIPP seasonal forecast system.JournalofClimate, 17(24): 4 783-4 804, https://doi.org/10.1175/jcli-3239.1.
Wang B, Wu R G, Fu X H. 2000. Pacifi c-East Asian teleconnection: How Does ENSO aff ect east Asian Climate?JournalofClimate, 13(9): 1 517-1 536, https://doi.org/10.1175/1520-0442(2000)013<1517:PEATHD>2.0.CO;2.
Wang Q, Mu M, Dijkstra H A. 2013. The similarity between optimal precursor and optimally growing initial error in prediction of Kuroshio large meander and its application to targeted observation.JournalofGeophysicalResearch:Oceans, 118(2): 869-884, https://doi.org/10.1002/jgrc.20084.
Webster P J, S Yang. 1992. Monsoon and ENSO: selectively interactive systems.QuarterlyJournaloftheRoyalMeteorologicalSociety, 118(507): 877-926, https://doi.org/10.1002/qj.49711850705.
Wu G X, Meng W. 1998. Gearing between the indo-monsoon circulation and the pacifi c-walker circulation and the ENSO Part I: data analyses.ScientiaAtmosphericaSinica, 22(4): 470-480. (in Chinese with English abstract)
Yu Y S, Mu M, Duan W S, Gong T T. 2012. Contribution of the location and spatial pattern of initial error to uncertainties in El Niño predictions.JournalofGeophysicalResearch:Oceans, 117(C6): C06018, https://doi.org/10.1029/ 2011jc007758.
Yuan D L, Wang J, Xu T F, Xu P, Hui Z, Zhao X, Luan Y H, Zheng W P, Yu Y Q. 2011. Forcing of the Indian Ocean dipole on the interannual variations of the tropical Pacifi c Ocean: roles of the Indonesian throughfl ow.JournalofClimate, 24(14): 3 593-3 608, https://doi.org/10.1175/2011JCLI3649.1.
Zebiak S E, Cane M A. 1987. A model El Niño Southern Oscillation.MonthlyWeatherReview, 115(10): 2 262-2 278, https://doi.org/10.1175/1520-0493(1987)115<2262:ameno>2.0.co;2.
Zhou Q, Duan W S, Mu M, Feng R. 2015. Infl uence of positive and negative Indian Ocean dipoles on ENSO via the Indonesian Throughfl ow: results from sensitivity experiments.AdvancesinAtmosphericSciences, 32(6): 783-793, https://doi.org/10.1007/s00376-014-4141-0.
Zhou Q, Mu M, Duan W S. 2019. The initial condition errors occurring in the Indian Ocean temperature that cause “spring predictability barrier” for El Niño in the Pacifi c Ocean.JournalofGeophysicalResearch:Oceans, 124(2): 1 244-1 261.
Zhu J S, Huang B H, Balmaseda M A, Kinter III J L, Peng P T, Hu Z Z, Marx L. 2013. Improved reliability of ENSO hindcasts with multi-ocean analyses ensemble initialization.ClimateDynamics, 41(9-10): 2 785-2 795, https://doi.org/10.1007/s00382-013-1965-8.
 Journal of Oceanology and Limnology2020年6期
- Journal of Oceanology and Limnology的其它文章
- Eff ects of vitamin C defi ciency or excess on growth performance, anti-oxidative response and fatty acid composition of juvenile abalone Haliotis discu s hannai Ino*
- Leptolaimus holovachovi sp. nov. (Nematoda) from Shenzhen Mangrove Nature Reserve, Shenzhen, South China*
- Profi le and development of microsatellite primers for Acanthogobius ommaturus based on high-throughput sequencing technology*
- Digging out molecular markers associated with low salinity tolerance of Nannochloropsis oceanica through bulked mutant analysis*
- An enhanced underwater camera apparatus for seabed observation of megabenthic epifauna in the northern Yellow Sea*
- Characteristics of zooplankton community in North Yellow Sea unveiled an indicator species for the Yellow Sea Warm Current in winter: Euchaeta plana*