Gabor-CNN for object detection based on small samples
Xio-dong Hu , Xin-qing Wng , Fn-jie Meng , Xi Hu , Yu-ji Yn , Yu-yng Li ,Jing Hung , Xun-lin Jing
a Department of Engineering Technology and Application, Army Infantry College of PLA, Nanchang 330100, China
b College of Field Engineering, Army Engineering University of PLA, Nanjing 210007, China
Keywords:Deep learning Convolutional neural network Small samples Gabor convolution kernel Feature pyramid
A B S T R A C T Object detection models based on convolutional neural networks (CNN) have achieved state-of-the-art performance by heavily rely on large-scale training samples. They are insufficient when used in specific applications, such as the detection of military objects, as in these instances, a large number of samples is hard to obtain. In order to solve this problem, this paper proposes the use of Gabor-CNN for object detection based on a small number of samples.First of all,a feature extraction convolution kernel library composed of multi-shape Gabor and color Gabor is constructed, and the optimal Gabor convolution kernel group is obtained by means of training and screening, which is convolved with the input image to obtain feature information of objects with strong auxiliary function. Then, the k-means clustering algorithm is adopted to construct several different sizes of anchor boxes, which improves the quality of the regional proposals. We call this regional proposal process the Gabor-assisted Region Proposal Network(Gabor-assisted RPN).Finally,the Deeply-Utilized Feature Pyramid Network(DU-FPN)method is proposed to strengthen the feature expression of objects in the image.A bottom-up and a topdown feature pyramid is constructed in ResNet-50 and feature information of objects is deeply utilized through the transverse connection and integration of features at various scales. Experimental results show that the method proposed in this paper achieves better results than the state-of-art contrast models on data sets with small samples in terms of accuracy and recall rate, and thus has a strong application prospect.
1. Introduction
With the development of deep learning technology [1,2], the accuracy of object detection has been continuously improved.Deep learning realizes the analysis and processing of data features through the study and imitation of human cognitive abilities and has a strong ability for visual object detection. Object detection frameworks based on deep learning have achieved gratifying results in many challenging object detection tasks, especially those detection models based on convolutional neural networks (CNN),as they can obtain features directly at the pixel level through intensive supervised training. However, CNN-based object detection algorithms have quantitative requirements for training samples,since deep learning is a typical data-driven technology,which can use a large number of data training models to discover rules and extract data features through learning. However, it is hard to acquire a large number of training samples for some types of objects in practical applications, which has become a universal problem that hinders the further promotion of deep learning technology.
Many detectors currently learn image features through CNN methods, but the detection effect is not ideal when using a small number of samples for the following reasons:
●The insufficient number of samples during the training process will easily lead to the over-fitting of the model.
●Most CNN-based models require pre-training on ImageNet[3], so the model cannot be flexibly changed according to different tasks.
●Some objects appear in a complex background[4],and these methods are not applicable when there is little feature information of the object.
Object detection in military environments is the key technology in realizing the informatization and intelligence of military equipment, but scarce sample data of military objects due to the particularity of the combat environment restricts the effect of detection.Differing from general object detection,the instantaneity and accuracy of military object detection is the key to obtaining correct battlefield information. Based on the current situation of object detection technology, we take the detection of military objects as an example and propose an object detection method based on small samples.The main contributions of the paper are outlined as the following:
●A feature extraction convolution kernel library[5]composed of polymorphous Gabor and color Gabor is constructed.A set of optimal Gabor convolution kernel is screened through training to extract the more obvious object response feature information,which greatly improves the network’s ability to detect targets.
●The distribution of anchors is optimized by introducing the k-means clustering algorithm [6]. The number of invalid anchors is reduced, which enhances the adaptability of the network to all kinds of samples and improves the accuracy and speed of the detector.
●The Deeply Utilized Feature Pyramid Network [7] (DU-FPN)is proposed to enrich the feature information of objects. In this way, more effective convolution features can be extracted when the number of samples is insufficient.
This paper is organized as follows. Related works are discussed in Section 2. Then, the methods of this paper are illustrated in Section 3.Next,the specific experimental contents are discussed in Section 4. The conclusions are given at the end.
2. Related works
Object detection frameworks based on deep learning have recently reached a high detection accuracy and speed, since deep learning interprets data by mimicking the neural structure of the human brain and has a strong ability for visual object detection.At present, the target detection methods based on deep learning mainly fall into two categories: regression-based models and region-based models. The former adopt the idea of regression,where the default box should be defined in a certain way to establish the relationship between the default box,prediction box,and ground truth box.The typical representatives are YOLO[8]and SSD [9]. Between the above algorithms, SSD has better detection performance, which is real-time and has high accuracy. Its detection speed on a single Nvidia Titan X graphics card can reach 58 fps(with a picture size of 300×300),and the mean Average Precision(mAP) [10] on the VOC2007 test set has reached 0.721. In recent years, new regression-based algorithms such as YOLOv2 [11],YOLOv3 [12] and FSAF [13] have emerged, which have higher accuracy and robustness. The latter refers to region-based convolutional neural network(R-CNN)[14]object detection methods and some breakthroughs have been made in the field of high-resolution detection of large objects in the PASCAL VOC dataset, especially using the Faster R-CNN [15] method. The model is composed of a region proposal network(RPN)for extracting region proposals and Fast R-CNN [16] for object detection. Faster R-CNN used RPN to produce candidate windows and Fast R-CNN to identify the categories of all region proposals and predict the boundary boxes of the object. It only needs to extract the feature of the image to be detected once, since Fast R-CNN and RPN share the feature extraction part of the CNN, which speeds up the process of object detection. Recently, GA-RPN [17] and Cascade R-CNN [18] have improved the efficiency of candidate regions and the performance of target detection.
Existing object detection methods are mainly controlled by machine learning technology, with emphasis on learning the feature expression of a large number of object instances.However,these methods often do not work well when the background is messy or the sample size of objects is small,and so the detection of objects with small samples is challenging.Some scholars have tried to address this problem. Some methods for data augmentation,such as rotation transformation,scaling transformation,translation transformation, contrast transformation, noise disturbance, color transformation, and so on, have been introduced. These methods can increase the quantity of samples, the fitting problem of deep learning is alleviated to some extent,but unfortunately it also adds a lot of work. Georgakis et al. [19] discussed the feasibility of training object detectors with synthetic images,which presented a method to automatically generate comprehensive training data for target detection task.Peng et al.[20]avoided costly collection and annotation of real images by automatically generating synthetic 2D training images using free 3D CAD models. All the above methods expand the number of samples by generating additional synthetic images, instead of mining object information based on existing small samples.
Image object detection technology in military environments is the key to the automation of military operations in modern warfare.The military environment is different from an ordinary scene,which demands a higher quality in object detection:The quality of the detection result plays a decisive role in military actions.Existing object detection methods include traditional methods and methods based on deep learning. Traditional target detection methods commonly use artificial filters and classifiers,where a feature with high recognition rate is selected as the candidate region through texture,color, statistics, and other information of the image.Some typical traditional object detection algorithm models can be found in Refs. [21,22]. However, traditional detection algorithms have limitations and struggle to meet the requirements of modern complex war environments. With the rapid development of modern science and technology and the intelligence and informatization of modern war, object detection algorithms based on CNN[23,24]have been widely used in the military field.Sermanet et al.[25]first utilized CNN models,in a sliding window fashion,for the automatic object detection (ATD) task successfully, where two CNNs, one for classifying if a window contained an object and the other for predicting the bounding box of the object,were used.Liu et al. [26] adopted the Fast R-CNN structure to present a military object detection model that incorporated multi-channel CNN.Zeng et al. [27] achieved faster and more accurate detection of military objects by using the idea of YOLO based on CNN. Zhao et al. [28]proposed a cascade coupled CNN-guided visual attention method for SAR ship detection [29].
The Gabor wavelet was developed on the basis of Gaussian function,which has good localization in both frequency and spatial domains and has proved to be a powerful tool for extracting image texture features.A Gabor filter can well adapt to changes in texture features in the spatial domain, because of its variable direction,bandwidth, and center frequency. By comparing the response of filter amplitude in each channel, boundary information between textures can be detected, so as to realize texture detection and segmentation in the image.At first,A.Bovik proposed[30]in 1992 to apply filters to texture segmentation,believing that textures are contained in a limited spatial domain and the different textures have distinct frequency characteristics in the spatial domain.Since then,the Gabor filter and its wavelet have been widely used in face recognition[31],traffic sign detection[32],vehicle verification[33],and other image processing and computer vision fields.Xiang et al.[34] proposed a detector composed of Gabor odd filters for edge detection and experiments show that this method can obtain accurate and continuous edge response. Wang et al. [35] proposed a target detection method based on improved Gabor filtering and region growth, which improved the robustness of detection under the interference of external factors such as illumination and background.
The accuracy of object detection often depends on the feature expression of the detected object. Therefore, it is especially important to mine the relevant feature information from the object region. Some efforts have been made to enrich the feature expression of objects.A common practice is to increase the scale of the input images to improve the resolution of objects and generate high-resolution ground object maps.Zhang et al.[36]proposed the concept of the image pyramid, where large-scale input images are adjusted to multiple scales to form an image pyramid, and then a non-maximum suppression strategy is adopted for the prediction results. Another approach [37] generates multi-scale representation by developing network variants,thus combining multiple lowlevel features to enhance high-level features. All of the methods mentioned above are simply tricks for adding features or data dimensions,which usually result in a significant increase of training and testing time. In fact, the use of more semantically strong features in object detection tasks is the key to improve the detection capability of detectors.
3. Proposed object detection framework
3.1. Overview of our method
Our object detection process is presented in Fig. 1, where the first part of the method, which is defined as the Gabor-assisted Region Proposal Network (Gabor-assisted RPN), is shown in the orange dotted box. This part can greatly reduce the number of regional proposals that do not contain objects or have a low probability of overlapping with objects, significantly improve the quality of output regional proposals, and shorten the algorithm processing time. Specifically, we constructed a Gabor feature extraction convolution kernel library composed of a 2D (twodimensional) polymorphous Gabor convolution kernel and a color convolution kernel. We screened the Gabor convolution kernel library and filtered the input images with the optimal Gabor convolution kernel group. Then, the k-means clustering algorithm is introduced to improve the adaptability of the detection network to objects and reduce computation. The second part of our approach is shown in the blue dashed line box,which we define as the Deeply Utilized Feature Pyramid Network (DU-FPN). We strengthened the feature expression of the objects by constructing a deep feature pyramid. A bottom-up and a top-down feature pyramid is constructed in this stage.For the sake of maximizing the use of low-level features, we added bottom features twice and combined lateral connection with fusion, at each scale of the features,to express the rich characteristics of objects.In addition,the two parts of the network are processed in parallel, which further reduces the processing time of the system.
3.2. Proposed gabor-assisted region proposal network
3.2.1. Design of gabor convolution kernel by simulating photoreceptive cells
There are two main kinds of Photoreceptor cells in the human retina: rods and cones. The former are sensitive to low light and have no color vision. The latter have color vision and poor photosensitivity, but high visual acuity. The Gabor wavelet is very semblable to the visual stimuli of simple cells in the human visual system. We use a 2D Gabor convolutional kernel to simulate the function of visual rod cells and a color Gabor convolutional kernel to simulate the function of visual cone cells, in order to obtain better object feature information through the combination of two kinds of filters.
The Gabor wavelet transform plays an important role in the analysis and processing of time-frequency signals. In addition, the Gabor wavelet transform has strong robustness to changes of illumination and object posture, and so it is widely applied in image processing, machine learning and other fields. The 2D Gabor convolution nucleus is very similar to the 2D receptive field profile of simple cells in mammalian visual cortex, which has excellent spatial locality and directional selectivity and can capture the spatial frequency and local structural characteristics of multiple directions in the local area of the image.
The 2D Gabor function was first proposed by Daugman[38],and since then, it has been widely used in the understanding of visual information. From the perspective of Fourier transform, the 2D Gabor function is the short-time Fourier function when the window function takes the gaussian window. Its functional expression is shown in Eq.(1),and Eq.(2)represents the real part of the 2D Gabor function,which has stronger filtering ability and feature extraction ability, as compared with the imaginary part.

Fig.1. The process of proposed method.
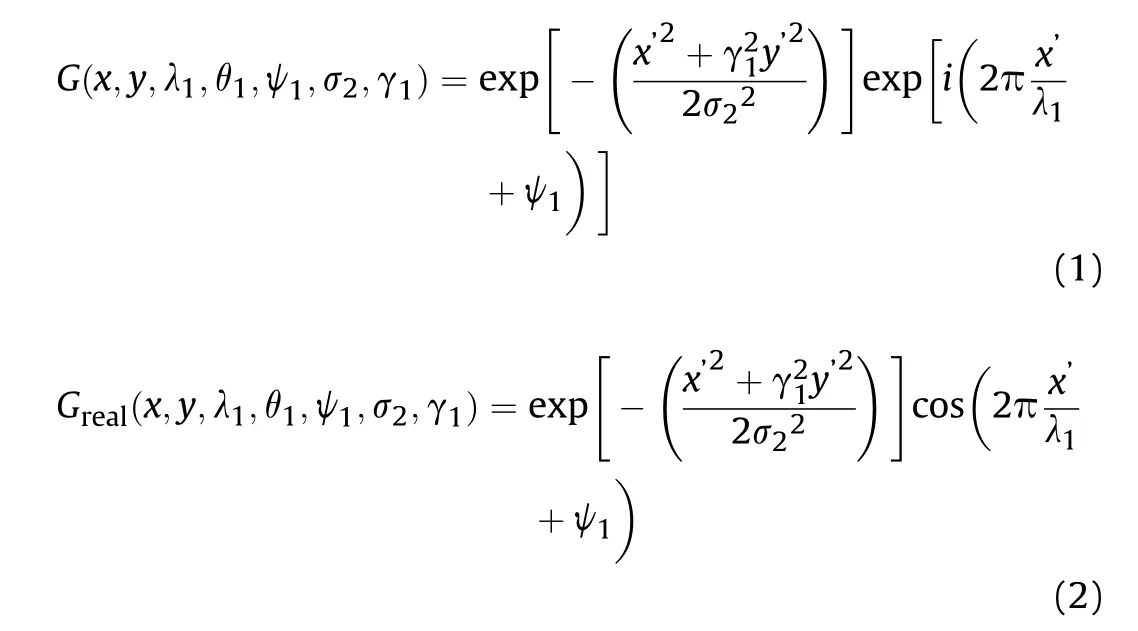
where x and y denote the position co-ordinate of pixels in the spatial domain; x′= x cos θ+ y sin θ; y′=-x sin θ+y cos θ λ1is the wavelength of the sine function;θ1is the direction of the Gabor kernel function, whose value range is 0-360°; ψ1represents the phase shift;σ2is the standard deviation of the Gaussian function;and γ1represents the aspect ratio of the space.
It has been found that the shape of the convolution kernel of the Gabor filter has a decisive influence on the effects of feature extraction through plentiful experiments. When the Gabor filter and image content have the same scale,direction,central position,phase, and structure type, the optimal feature response can be obtained. In order to enable the Gabor filter to gain complex and rich feature information, the variables k1to k5are introduced to adjust the real part of Gabor convolution kernel [5], and the following equation is obtained:
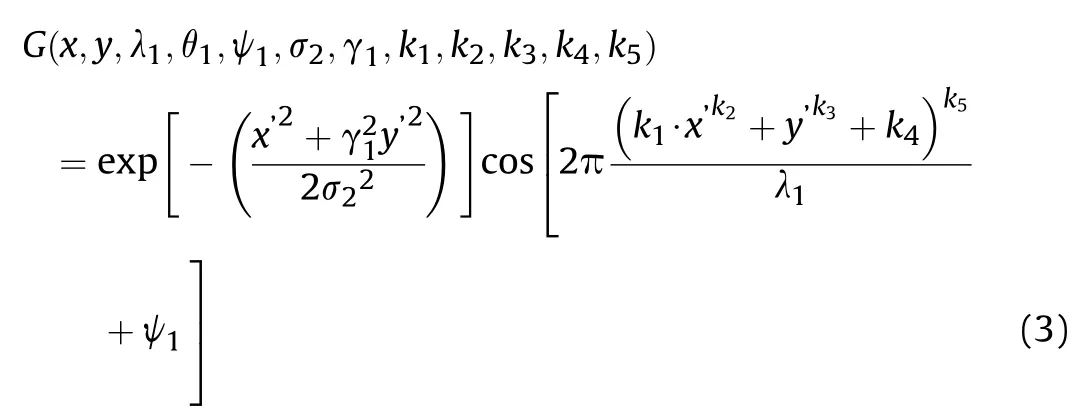
Among the parameter,the shape of Gabor filter is determined by parameters k2, k3, and k5, and the direction and phase of the convolution kernel are determined by parameters k1and k4.Fig.2 shows a partial image of 2D Gabor filters constructed by Eq.(3).By adjusting the introduced parameters,the feature extraction ability of 2D polymorphous Gabor filters can be enhanced to extract more abundant and various feature information.
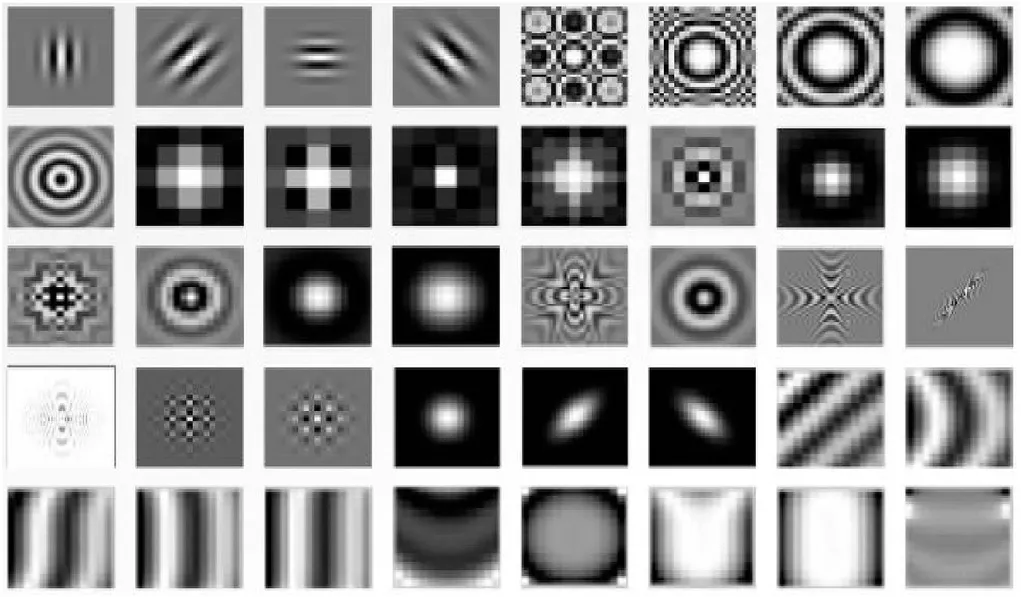
Fig. 2. Convolution kernels of 2D Gabor filters.
Color is often closely related to the scenes and objects contained in images,so color features are often used as the simplest and most effective features to distinguish different targets and backgrounds.Compared with other visual features in the images, color features are less dependent on the direction, size, and angle of view of images and have greater stability. Therefore, color features have become the most important perceptual features to recognize image objects, and so they have been widely used. The RGB model, also known as the additive color model,is often used for image editing and color expression.The RGB color space is designed based on the principle of color mixing, which are superimposed in different proportions to produce a rich and extensive variety of colors.
There are three types of cone cells in the retina, which contain pigments sensitive to red, green, and blue light. When light of a certain wavelength acts on the retina,the three kinds of cone cells produce different levels of excitement, respectively, with certain proportions. Such information is transmitted to the cerebrum,causing the person to produce the sense of a certain color. To simulate the visual principles of the human eyes, a color Gabor filter is constructed to activate color features of the images. We adopt a 2D Gabor filter to detect the color features of a certain color component in the 3D color space. According to the object color characteristics to be extracted, the correlation among the three color components is constructed to obtain the Gabor filter of the other two color components.Finally,according to Eq.(6),the three 2D filters are synthesized to obtain a color Gabor filter, which is then used to extract the color characteristics of the specified target.
The classic perception field contains four components: yellow,red,green,and blue.Taking the color convolution kernel trained by neural network as a reference [5], the mathematical relationship among the color channels is summarized as shown in Eqs. (4) and(5), by imitating the principle of the RGB model.

where Gr, Gg, and Gbrepresent the 2D Gabor filters of the color Gabor filter on the r,g,and b channels,respectively.The constraint conditions of Eqs.(4)and(5)are object colors sensitive to the color Gabor filters.For example,r&g means that the primary colors of the object are red and green, and y represents yellow. A partial collection of color Gabor filter convolution kernels are depicted in Fig. 3.
3.2.2. Intelligent optimization of the gabor convolution kernel group
In order to obtain efficient feature information and improve the accuracy of object detection, we reasonably construct a Gabor feature extraction convolution kernel group[5].First,we construct an initial Gabor convolution kernel library containing 2D Gabor convolution kernels and color Gabor convolution kernels,and then screen the optimal Gabor convolution kernel group to extract more abundant and various feature information.
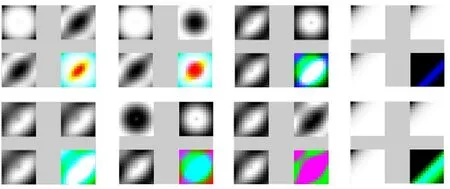
Fig. 3. Convolution kernels of color Gabor filters.
According to Eqs. (1) and (3), a polymorphic 2D Gabor convolution kernel library is constructed by transforming parameters.According to Eqs.(4)and(5),a Gabor convolution kernel library of the same scale is constructed. The convolution kernel is extracted from the two Gabor convolution kernel library, in a random and non-repetitive manner,to form the initial Gabor convolution kernel group,where n1 convolution kernels are extracted from the library of m1 convolution kernels to form a convolution kernel group according to Eq. (7):

There are about 125 million rod cells and cone cells in the retina,among which the number of rod cells is 12 times more than that of cone cells; we adopt this proportional relationship when setting the number of different convolution kernels.Meanwhile,in order to avoid excessive computation caused by the large scale of the Gabor convolution kernel group and incomplete feature extraction caused by the small scale, the number of 2D Gabor convolutional kernels and color Gabor convolutional kernels in the Gabor convolutional kernel group designed in this paper are respectively 60 and 5. To assess the contribution of each Gabor convolutional kernel filter to feature extraction, we construct a small-scale test image set, containing only military objects, with a total of 100 images, some of which are depicted in Fig. 4.
We defined an evaluation standard,the Average Response Value(ARV),which is obtained by feature map statistics generated by the convolution kernel filter under test. Eq. (8) is the calculation equation for the response value of a single convolution kernel filter.If the response value of the convolution kernel filter is high, it means that the convolution kernel filter has a high contribution to feature extraction. We take the convolution kernel group corresponding to the highest ARV as the best convolution kernel group.We tested the ARV value of several different convolution kernel sizes with the test image set. In addition, it was found that Gabor convolution kernel could obtain better object feature information when the size was 3 × 3 [5], through the experimental summary.

where I(x,y) denotes the test image; Gjdenotes a Gabor convolution kernel in the convolution kernel group; m and n denote respectively the resolution of the feature map corresponding to a convolution kernel filter; and M and N represent respectively the number of images in the test set and the number of Gabor convolution kernels in the convolution kernel group.
To balance the processing time and performance, the feature maps obtained through different Gabor convolution kernel filters in the optimal Gabor convolution kernel group are synthesized into one map by finding the maximum value of the feature maps at each pixel [39], using

where φ′(x,y)denotes the output of the detected image filtered by every Gabor convolution kernel filter.

Fig. 4. A few images from the test image set.
3.2.3. Generation of anchor boxes
In popular region-based target detection methods, such as the Faster R-CNN, the area and aspect ratio of the anchor boxes were set prior,based on human experience.The region proposal network generates k’(k’=9)anchor boxes,in which the area scale sizes were 1282, 2562, and 5122respectively, and the aspect ratios were 1:1,1:2, and 2:1, respectively. However, this method generates too many anchor boxes and these parameters are not very adaptable to the detection task of military objects,resulting in a relatively slow training and testing process. Therefore, it is necessary to choose a set of better initial anchor boxes to make the model easier to learn.
This paper proposes to reset the size of the anchor box by obtaining the distribution law of the object on the dataset through the k-means clustering algorithm based on the original RPN framework. The k-means clustering algorithm is a typical unsupervised learning algorithm, which uses distance as the similarity evaluation index and is mainly used to classify n samples into k categories. Fig. 5 shows the specific steps for obtaining the size of the anchor boxes through the k-means clustering algorithm. First,the size of each object is extracted and normalized from the original data,including the area and aspect ratio of the object;we take this as the input n samples to the k-means clustering algorithm. Then,we set the number of categories k and randomly extract k points from n samples as the center point of the first cluster. Next, we calculate the distance between n samples and k clustering centers,then classify these n samples(each sample belongs to the category closest to the clustering center). Finally, we calculate the average value of all samples of each class to get a new clustering center and repeat the above steps until the result satisfies the condition for stopping the iteration. The final clustering result is the required anchor boxes.

Fig. 5. Block diagram of the k-means algorithm principle.
We defined a new distance expression to calculate the similarity,as shown in Eq.(10),where GT is the ground truth annotated on the dataset, CE is the calculated clustering centroid, and RIoUdenotes the Intersection-over-Union (IoU) of GT and CE. The calculation method is shown in Eq. (11). The function J(GT,CE) defined in the clustering process is shown in Eq. (12), which represents the distance sum of all ground truth values to the nearest centroid. The stopping condition of the clustering process is to reach a certain number of iterations[40]:

3.3. Deeply-Utilized Feature Pyramid Network architecture
The deep learning pipelines,such as Fast R-CNN[16]and Faster R-CNN [15], used for target detection won better performance recently, as they are able to learn the depth feature information from the region of interest (RoI). These models perform well on large objects with high resolution and clear appearance, but they have difficulties in detecting the object when the sample size is small or the feature information of the object is insufficient.However, objects with small sample data are common in real life.
Learning effective image features is the core of object detection.Existing methods for solving object detection tasks,whether based on feature coding methods based on unsupervised feature learning or feature coding methods with low-level artificial engineering features,are only capable of generating image features with limited representativeness,which in essence hinders them from achieving better performance. In this paper, the Deeply-Utilized Feature Pyramid Network has been proposed to strengthen the feature expression of objects. We make use of the bottom feature prominently, as it has stronger semantic information and a larger receptive field than the top feature[41],on the basis of constructing a deep feature pyramid.
Considering that Ren et al. proved that the ResNet-50 [42]model, when selected for pre-training, can achieve better performance than other pre-training models, such as VGG [43] and PRELU-net[44]through enough experiments,we also selected the ResNet-50 model as the backbone. The intermediate feature maps are naturally down-sampled 5 times,and the convolution layer step size is 2.We utilized a set of feature maps from ResNet-50 to create a feature pyramid that has strong semantics at multi-scale [45],which improves the learning ability of feature representation of objects. Another top-down feature pyramid was adapted to generate higher resolution and semantically strong feature maps and, then, these feature maps were concatenated channel by channel through lateral connections. Therefore, each lateral connection combines feature maps from the bottom-up and topdown paths.
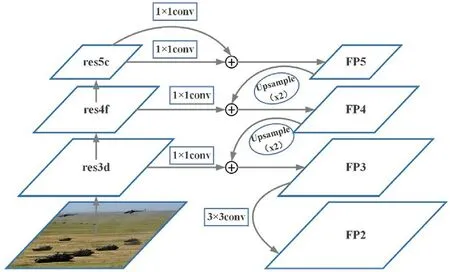
Fig. 6. Illustration of the proposed Deeply-Utilized Feature Pyramid Network.
As depicted in Fig. 6, given a specific image as input, a set of feature maps can be obtained from the residual block of last three stages denoted as res3d, res4f, and res5c respectively. We only chose the last three layers, considering the large energy and memory consumption of the GPU. Then, another top-down passageway was constructed as a shared feature extractor, to generate feature maps with higher resolution and stronger semantics [46] by combining the semantically strong features from the top-down passageway with the high-resolution features from the bottom-up passageway, based on the idea of FPN [7]. For the low-resolution feature maps of the last layer of the higher stages,the up-sample strategy was used to double the spatial resolution through a bilinear interpolation method. Then, the corresponding element-wise addition was performed for merging with the highresolution feature map at the front. This process was iterated until the four feature outputs were combined. Finally, we added a 3 × 3 convolution layer to obtain the final feature graph, reducing the aliasing effect of the up-sampling. As can be seen in Fig.6, the bottom map (denoted as res5c) was used twice to enforce the semantic expression of small objects,considering that the top feature has stronger semantic information and a larger receptive field.Finally, we obtained feature maps which were expressed as FP2,FP3, FP4, and FP5. In general, the network structure is easy to construct and can generate high-level semantic feature maps at various scales with small additional cost.
4. Experimental analysis and discussion
4.1. Experimental conditions and datasets
This article used a DELL Precision R7910 (AWR7910) graphics workstation,Intel Xeon e5-2603 v2(1.8 GHz/10 M),and an NVIDIA Quadro K620 GPU to accelerate the calculation. Caffe [47] was selected as the training framework,which is developed considering expression, speed, and modularity [48]. Caffe supports parallel computing on both the CPU and GPU, which greatly improves computing efficiency.
In this article, we used two types of datasets. The first dataset was a military object dataset with small samples.We established a military object detection data set named MOD VOC,which met the PASCAL VOC data set format standard.In this paper,the MOD VOC data set was used to generate the training and test data sets, and the images were mainly taken from video images taken by unmanned aerial vehicles(UAV),ground cameras,and internet images(through the network search engine), and its characteristics are shown in Table 1.The data set contains 400 images,with the size of the images adjusted to 480 × 480 pixels, of which 80% were training set images and the remaining 20%were test set images.

Table 1 The characteristics of MOD VOC data set.
The second data set was KITTI[49], which aims to push for the progress of computer vision and robot algorithms in autonomous driving. KITTI was proved to be the largest public dataset for evaluating computer vision algorithms in autonomous driving scenarios,which captured real traffic scenes ranging from rural road to downtown landscapes contained many static and dynamic targets.In contrast to MOD VOC, KITTI was used in the experiments as a large-scale data set.We chose KITTI to assess the detection effect of our method on data sets with a large number of samples.
4.2. Evaluation metric
In the object detection evaluation system,the evaluation indices mainly include recognition accuracy, positioning accuracy, and recognition efficiency. Therefore, we quantitatively evaluated the detection performance of the algorithm through the four evaluation indexes of accuracy rate, recall rate, intersection over union(IoU), and time consumption in this paper, in which the accuracy rate, the recall rate, and the intersection over union (IoU) are respectively defined as

where TPrepresents a positive sample with a positive predicted value, TNrepresents a negative sample with a negative predictive value, FPrepresents a negative sample with a positive predictive value, FNrepresents a positive sample with a negative predictive value, GT represents the ground truth object boxes, and DR represents the detection results.
4.3. Experimental design
The effectiveness and advantages of each module in the detection framework of this paper are illustrated through comparative analysis of their performance with other relevant algorithms. In order to highlight the effect of the regional proposal method, the proposed method was tested and compared with some other regional proposal methods. The above comparative experiments were carried out on the MOD VOC and KITTI datasets to obtain detailed and fair results.In addition,we classified objects according to size distribution to highlight the performance of DU-FPN, and the Faster R-CNN algorithm was selected as the comparison algorithm to test objects of different-sized categories.
Finally, four target detection methods based on deep learning were selected as the comparison algorithms to verify the advantages of the detection framework in this paper. We compared the detection performance of the four methods with the proposed detection framework on the MOD VOC and KITTI datasets.
4.4. Performance of gabor-assisted region proposal network
4.4.1. Obtainment of anchor boxes
In this paper, the k-means clustering algorithm was adopted to calculate the initial anchor boxes. Considering that the number of anchor boxes at each position should not be too much or too little,we took the k values to be 3,4,5,6,7,and 8.The k-means algorithm adopts the method of iterative updating, and each iteration is carried out in the direction of reducing the objective function. When the number of iterations reaches a certain number, the objective function will converge, and the final clustering result will be obtained. We took different numbers of iterations to conduct experiments and obtained the change curve of the objective function J(GT,CE), as shown in Fig. 7. It can be concluded that, when the number of iterations is around 50, the objective function corresponding to different k values can converge to a stable value.Therefore,the number of iterations in this paper is selected as 50.
We compared the object detection effect under different k values. The detection effect of the detection model on MOD VOC test set was evaluated by accuracy rate and average detection time.Table 2 shows the comparison of test results with different values of k.As shown in the table,when the k value was 6,the accuracy was the highest, and the time consumption had a relatively good performance.
We further obtained the accuracy-recall curve with different values of k, as depicted in Fig. 8, and it can be concluded that the accuracy was the highest when k was 6, which is consistent with the conclusion in the above table.
We recorded the centroid co-ordinates of the clustering results when k=6,as shown in Table 3,and restored the cluster centroids based on their normalized values. The Normalized area and Normalized aspect ratio of the centroid represent the area and aspect ratio of the anchor boxes after normalization, respectively.The area and aspect ratio represent the actual area and the actual aspect ratio of the box corresponding to the cluster centroid respectively. We can determine the unique anchor box with these two values.Finally,we obtained six unique anchor boxes and input these results into the Gabor-assisted RPN, as anchor boxes corresponding to each feature map element.
4.4.2. Quality evaluation of gabor-assisted region proposal network
Two comparative experiments are conducted in this session.On the one hand, we prove that filtering procedure of the optimal Gabor filter group in this paper is conducive to discovering the RoI and inhibiting the number of negative samples.On the other hand,to evaluate the quality of the regional proposal method, four existing regional proposal methods-Selective Search [50],EdgeBox [51], Original RPN [15], and Saliency Guided RPN [52]-were selected to compare with the proposed Gabor-assisted RPN method.
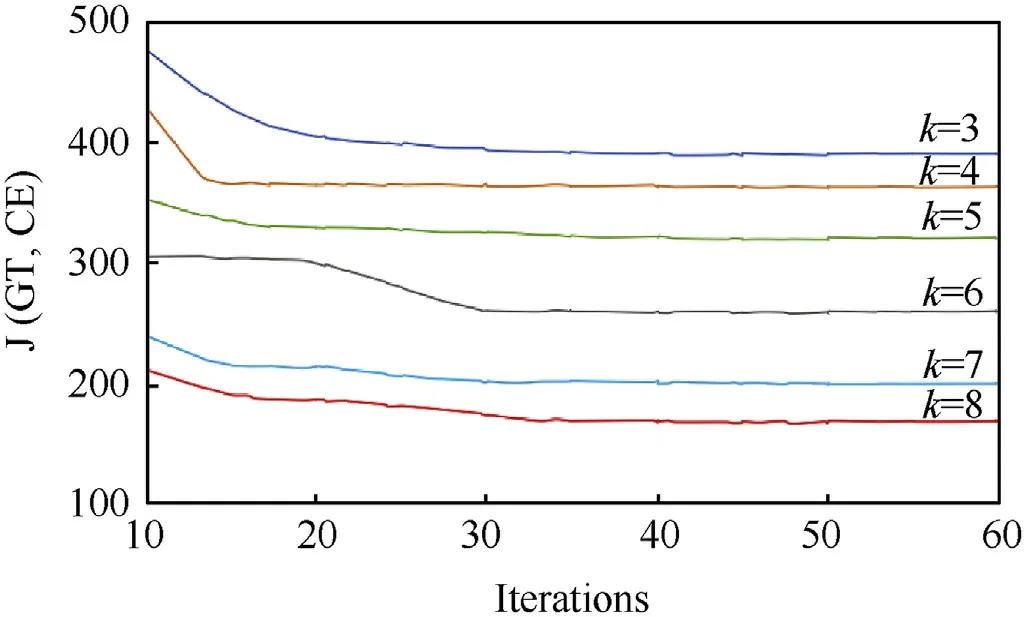
Fig. 7. The relationship between the objective function and the number of iterations.

Table 2 Test results with different values of k.
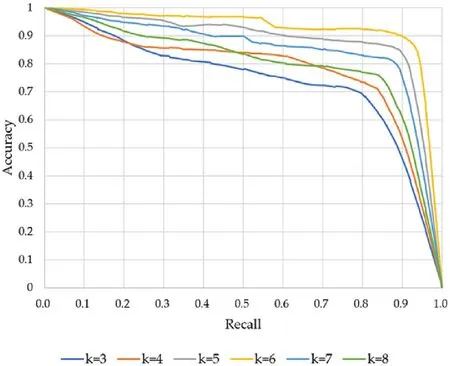
Fig. 8. Accuracy- Recall curve with different values of k.

Table 3 Centroid table after clustering.
For the first experiment, we compared the performance in two cases: Gabor-assisted feature extraction and non-Gabor-assisted feature extraction. As shown in Table 4, the average numbers of proposals of the former case from MOD VOC and KITTI were 254 and 298, respectively, and the corresponding recall rates were 91.23% and 90.54%. For the latter case, the optimal Gabor convolution kernel is used to obtain the feature information with auxiliary function.Considering that the size of the selected convolution kernel should not be too large or too small. If the size of the convolution kernel is too small,the features of the target cannot be expressed; if the size of the convolution kernel is too large, the complexity will be greatly increased, and the performance of feature extraction will also be reduced.In order to understand the proper size of convolution kernel in this paper, we conducted a comparative experiment to evaluate the feature extraction performance of several common convolution kernel with different sizes.The average numbers of proposals on the two data sets were 138 and 166 respectively, and the corresponding recall rates were 99.45%and 96.13%when the size of the convolution kernel is 3×3.It is clear that the number of regional proposals from our method was less than the approach of feature extraction without the Gaborassistance, and the recall of our method is higher. In addition, the best feature extraction effect can be obtained when the size of convolution kernel is 3 × 3, which demonstrates the regional proposal capabilities of our method.

Table 4 Comparison of different detection metrics for the approaches of feature extraction with and without Gabor assistance.
Compared with the approach of feature extraction without the Gabor assistance, our method took several more milliseconds, in terms of time consumption, since our method included the local Gabor filtering process, rather than simply utilizing the grayscale image.However,the increased time for the local Gabor feature map will not influence the eventual processing time with design of parallel programming.
For the second experiment, we compared the Gabor-assisted RPN proposed in this paper with four regional proposal methods:Selective Search,EdgeBox,Original RPN,and Saliency-Guided RPN.Selective Search generates proposals by greedily merging superpixels without learning the parameters, instead of manually designing features and similarity functions for merging super pixels; EdgeBox is established on the basis of object boundary estimation, where object edge information and a scoring function are combined to complete the selection of recommended regions,which has achieved excellent results in detection accuracy and calculation efficiency; Original RPN carries out sliding scanning through a small window on the feature map obtained in the last convolutional layer of the network; Saliency-Guided RPN extends the architecture of the RPN by introducing prior information into the region containing potential objects, where prior information based on significance was selected to guide the RPN to the important region, inspired by the concept of significance, so as to effectively utilize the difference between the object and background to obtain regional proposal without supervision.
We used the average recall rate (AR) proposed in Ref. [53] to evaluate the accuracy of the region proposal network, where AR represents the average recall rate of the IoU, from 0.5 to 0.95.Table 5 reports the AR versus the number of proposals(from 10 to 1000)with the different methods on the MOD VOC and KITTI data sets.
Detection proposal is essentially similar to the detection of interest points.The calculation required for subsequent tasks will be greatly reduced when the points of interest are concentrated in the most prominent and unique position. Similarly, the number of region proposals will be cut down and the computation process can be sped up by generating a region proposal that may contain objects.It is clear from Table 4 that although the Gabor-assisted RPN had a slight gap in the computing time, compared with the Saliency-Guided RPN method,it had a higher AR value for the two data sets.For the other schemes,the Selective Search method was time-consuming,as it is actually an exhaustive search method.The EdgeBox method had weak performance in recall rate, due to its lack of learning parameters and training process. Compared with the Gabor-assisted RPN, intensive sliding windows were still used instead of letting the points of interest dominate in the Original RPN method, resulting in low computational efficiency.
In order to further prove the advantages of the regional proposal method,we obtained the recall rate under different IoU thresholds and the number of proposals through experiments,as can be seen from Figs.9 and 10.Our approach presented the best performanceon MOD VOC, demonstrating that Gabor-assisted RPN is more useful in identifying RoI and has a higher recall rate for small sample data sets. The experimental effect of our method on KITTI was slightly worse than that on the MOD VOC,but it also achieved a good recall rate. Its performance was not as good as the Saliency-Guided RPN method, but it was better than Selective Search,EdgeBox, and the Original RPN method.

Table 5 Comparison of average recall rate (AR) versus the number of proposals (from 10 to 1000) and computing time between Selective Search, EdgeBox, Original RPN, Saliency Guided RPN,and Gabor-assisted RPN.

Fig. 9. Recall versus number of proposals and IoU threshold on the MOD VOC data set.
4.5. Performance of Deeply-Utilized Feature Pyramid Network
In our HU-FPN,the res5c layer is used twice to enrich the feature information of objects.To evaluate the effect of enriching detection features, we compared the cases where res5c was used once and twice,respectively.We denote these two cases as ours(a)and ours(b) respectively. In addition, we compared the results provided by our network and the state-of-the-art Faster R-CNN method. According to the size division rule of objects as proposed in Ref.[54],the military objects in the MOD VOC test set were divided into three categories: small objects (area < 322pixels), medium objects (322pixels
Table 6 provides the comparison of our approach with the Faster R-CNN method,in terms of average recall and accuracy on military object detection. It can be observed that the proposed method outperformed the Faster R-CNN method, since our network fuses features at multiple scales,rather than simply using the final layer of the network, which confirms that the original Faster R-CNN is not suitable for object detection based on small samples.Compared with ours (a), ours (b) had some improvement in detection performance,especially for small-sized subsets(9% and 8%in average recall and precision, respectively), which shows that HU-FPN enriches the feature expression of objects and improves the detection ability of small objects.In general,our approach made a significant improvement on the three kinds of subset, demonstrating its effectiveness in accurate detection based on small-scale samples.
Fig.11 reflects the accuracy-recall curves of our approaches and the Faster R-CNN method on three subsets of different object sizes.We can intuitively observe the performance of recall rate of the ours (a), ours (b), and Faster R-CNN methods in detecting three categories of objects from the figure,which clearly shows that DUFPN is able to improve the detection accuracy by enriching feature information of the object.
Some examples of detection effects for different sizes of objects are depicted in Fig.12.
4.6. Comparison experiment with other detection algorithms
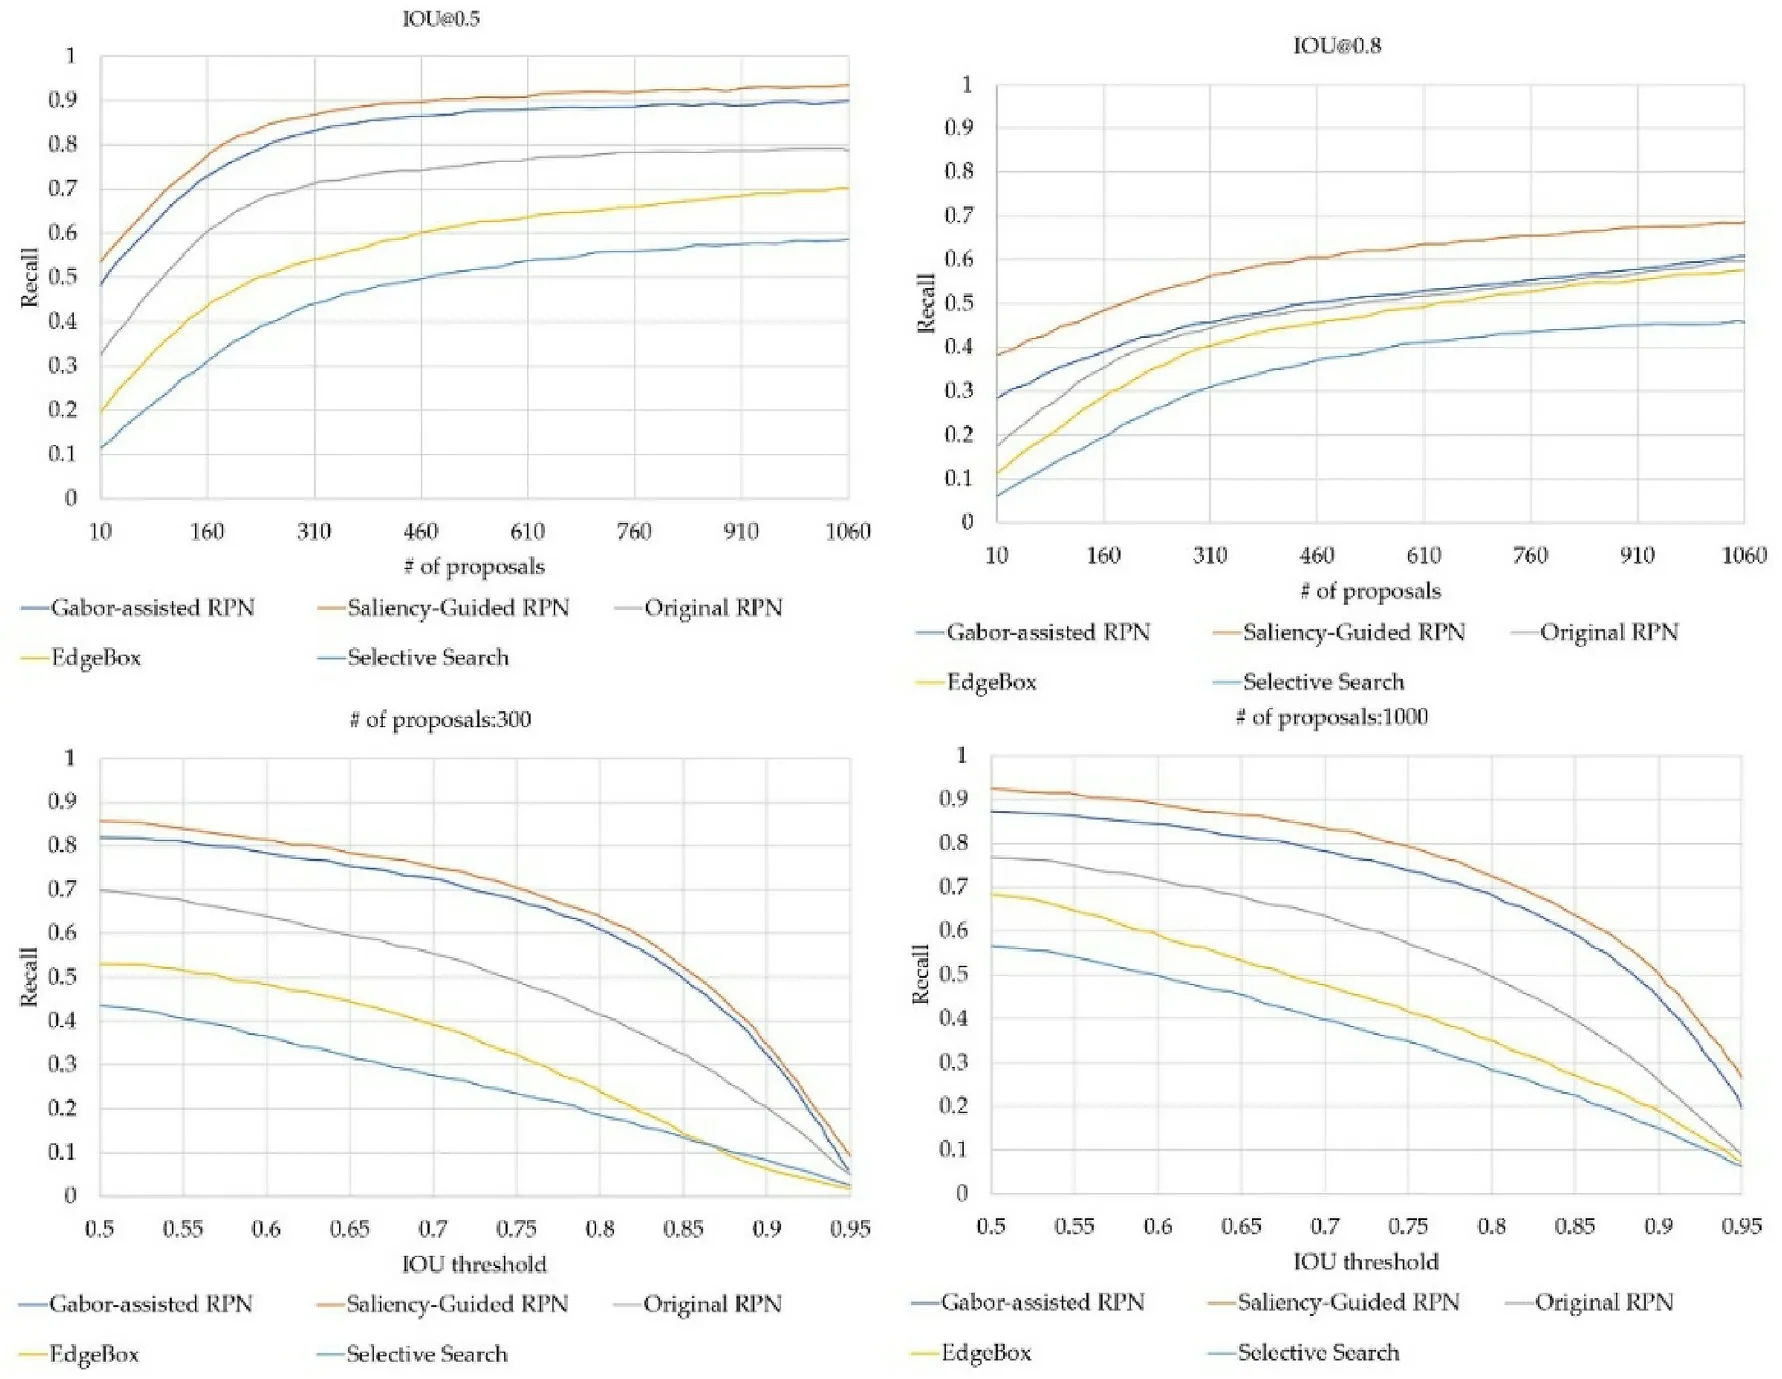
Fig.10. Recall versus number of proposals and IoU threshold on the KITTI data set.

Table 6 Comparisons of detection results for different sizes of military objects on the MOD VOC data set. (R): Recall, (A): Accuracy.
In order to verify the feasibility and effect of our detection framework for small samples, a number of comparison experiments were conducted. We chose four kinds of detection framework based on deep learning-Faster R-CNN,DSOD300[55],DSSD[56],and YOLOv2 544[11]-as the comparison algorithms in this paper and compared their effects on the MOD VOC and KITTI data sets.The parameter settings used in this article are the default settings issued by the respective authors. The experimental result are presented in Table 7, where fps denotes the number of frames processed, which reflects the average speed of the algorithm.

Fig.11. Accuracy-recall curves of the compared methods, tested on the MOD VOC test set, for small, medium, and large objects.
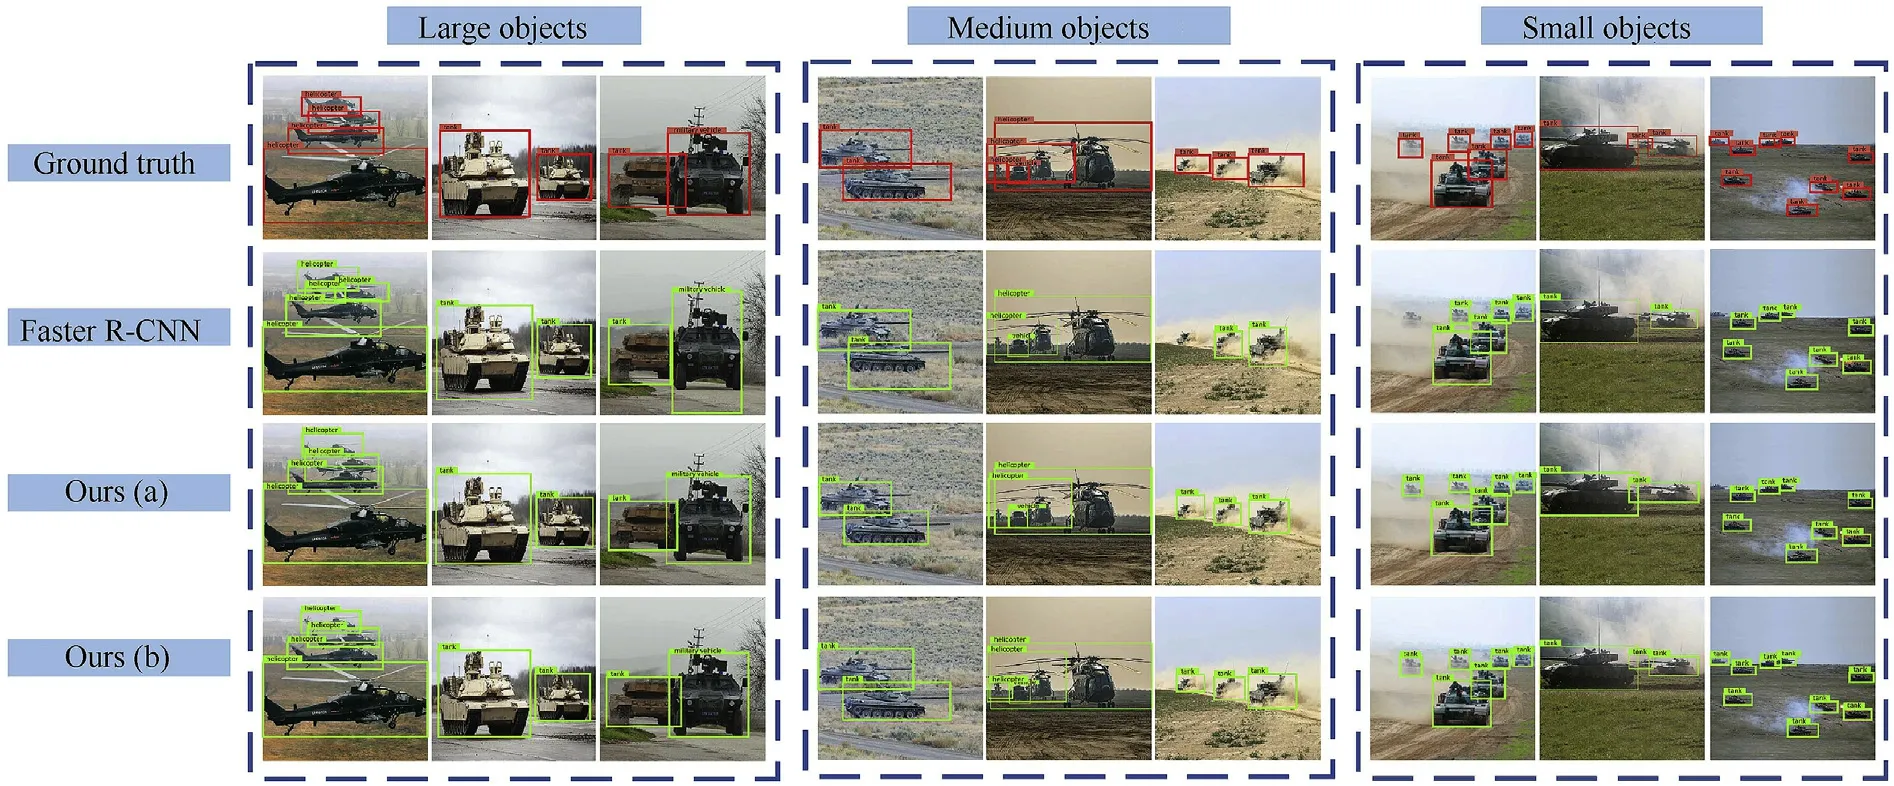
Fig.12. Examples of detection effects for different sizes of objects.
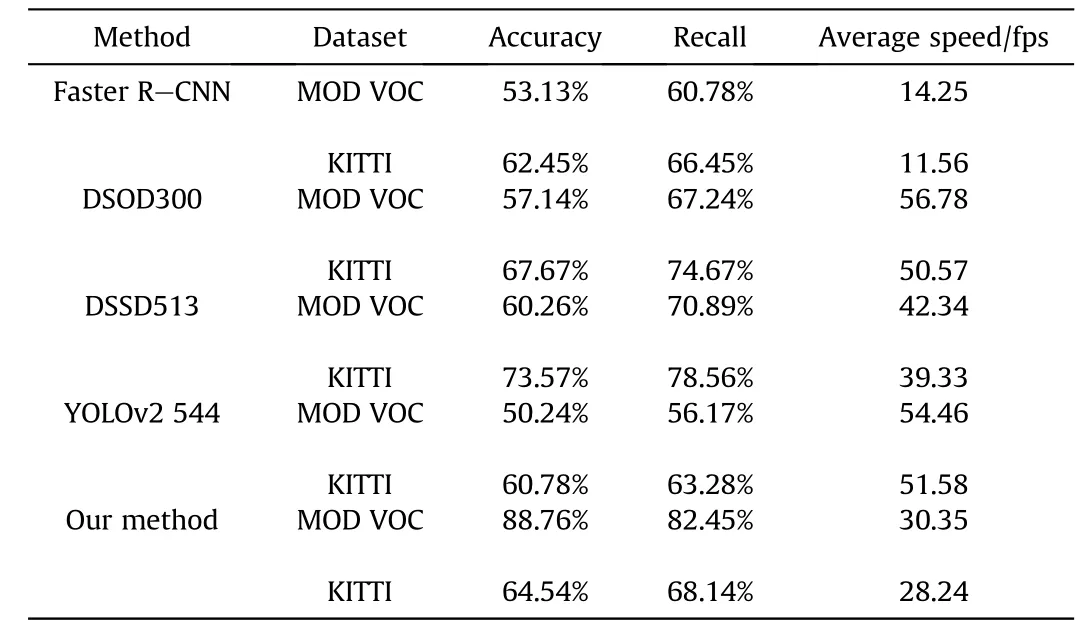
Table 7 Quantitative comparisons with 4 methods on MOD VOC and KITTI datasets.
Through comparative analysis with the other methods in the table,it is clear that on the MOD VOC data set,the accuracy value of our method increased by 15-35%and the recall value increased by 12-26%,proving that our method has better applicability on small sample data sets and can obtain higher accuracy and recall rate.On the KITTI data set, our method had a certain gap in the aspect of accuracy and recall rate compared with the DSOD300 and DSSD513 methods, but compared with Faster R-CNN and YOLOv2 544 methods,the accuracy rate and recall rate were increased by 2-4%and 2-5% respectively, meeting the basic testing requirements.Although the computational efficiency of our method was not up to the level of the DSOD300,DSSD513,and YOLOv2 544 methods,the average speed reached approximately 30 fps,meeting the real-time detection conditions of military objects basically. The experiments show that,compared with the other algorithms,our method made the best performance on small sample data sets and is able to meet the general requirements on large-scale data sets, which has a broad application prospect.Some examples of detection results are presented in Fig.13.

Fig.13. Examples of detection results, where the blue dotted box shows the partial experimental results on MOD VOC and the orange dotted box shows the partial experimental results on KITTI.
5. Conclusions
This paper proposed an object detection framework based on small samples, which is combined with an optimal Gabor convolution kernel filter group and a deep feature pyramid network.We imitated the photoreceptor cells of the visual system based on the principles of human vision, and reasonably constructed a Gabor feature extraction convolution kernel library contained 2D polymorphous Gabor convolution kernels and Gabor convolution kernels, after which the optimal Gabor group was obtained through screening. In addition, the k-means method was introduced to improve the adaptability of detection network to military objects and reduce computation, where we obtained several reasonable bounding boxes which are put into the Gabor-assisted Region Proposal Network as anchor boxes corresponding to each feature map element.In order to enrich the feature information of objects and improve the detection performance of the detector, we proposed a Deeply Utilized Feature Pyramid Network to enforce the expression characteristics of objects in the detected image. Sufficient experiments proved that our method has better performance than other object detection methods on small sample data sets,and can achieve the general detection requirements on large data sets,which creates good conditions and has important reference value for multiple object detection based on small samples.
Funding
This work was supported by the National Natural Science Foundation of China (grant number: 61671470), the National Key Research and Development Program of China (grant number:2016YFC0802904), and the Postdoctoral Science Foundation Funded Project of China (grant number:2017M623423).
Declaration of competing interest
None.
- Defence Technology的其它文章
- Development of cost effective personnel armour through structural hybridization
- Effects of jute fibre content on the mechanical and dynamic mechanical properties of the composites in structural applications
- Experimental research on the instability propagation characteristics of liquid kerosene rotating detonation wave
- Integrated guidance and control of guided projectile with multiple constraints based on fuzzy adaptive and dynamic surface
- A split target detection and tracking algorithm for ballistic missile tracking during the re-entry phase
- Strain concentration caused by the closed end contributes to cartridge case failure at the bottom

