The intermediate water in the Philippine Sea*
ZANG Nan , WANG Fan SPRINTALL Janet
1 CAS Key Laboratory of Ocean Circulation and Waves, Institute of Oceanology, Chinese Academy of Sciences, Qingdao 266071, China
2 Center for Ocean Mega-Science, Chinese Academy of Sciences, Qingdao 266071, China
3 Pilot National Laboratory for Marine Science and Technology (Qingdao), Qingdao 266237, China
4 College of Marine Science, University of Chinese Academy of Sciences, Qingdao 266400, China
5 Scripps Institution of Oceanography, U.C. San Diego, La Jolla CA 92093-0230, U.S.A
Abstract The dimensional and temporal distribution of Antarctic Intermediate Water (AAIW) and North Pacifi c Intermediate Water (NPIW) in the Philippine Sea were explored using Argo profi les and gridded Argo data. As the salinity minimum of intermediate water from mid-high latitude of the southern and northern hemisphere of the Pacifi c Ocean, the properties of AAIW and NPIW merge at about 10°N with diff erent properties in the Philippine Sea. The core of AAIW is located below 600 dbar with potential density of 27≤ σ θ ≤27.3 kg/m 3 and salinity of 34.5≤ S ≤34.55. The core of NPIW is located between 300-700 dbar with potential density of 26.2≤ σ θ ≤27 kg/m 3 and salinity of 34≤ S ≤34.4. The volume of AAIW and NPIW during January 2004 to December 2017 is negatively correlated. The time series of AAIW and NPIW is dominated by signifi cant periods of 6 and 8 months, respectively. The variations of AAIW and NPIW are mainly aff ected by volume transport through a 130°E section by the North Equatorial Current (NEC) and North Equatorial Undercurrent (NEUC).
Keyword: the intermediate water; the Antarctic Intermediate Water; the North Pacifi c Intermediate Water; seasonal variation
1 INTRODUCTION
The tropical Western Pacifi c is a region with a complex distribution of currents and water masses. The westward North Equatorial Current (NEC) bifurcates at the Philippine coast near 12°N into the northward Kuroshio and the southward Mindanao Current (MC) (Nitani, 1972; Toole et al., 1990; Qiu and Lukas, 1996) (Fig.1). There exist subsurface countercurrents beneath the surface currents, such as the Mindanao Undercurrent (MUC) beneath the MC (Hu and Cui, 1989, 1991; Qu et al., 1998; Firing et al., 2005; Kashino et al., 2005; Zhang et al., 2014; Wang et al., 2015), the Luzon Undercurrent (LUC) beneath the Kuroshio (Hu and Cui, 1989; Qu et al., 1997; Gao et al., 2012; Wang and Hu, 2012; Hu et al., 2013), and the North Equatorial Undercurrent (NEUC) beneath the NEC (Wang and Hu, 1998; Qu et al., 2012; Qiu et al., 2013) (Fig.1).
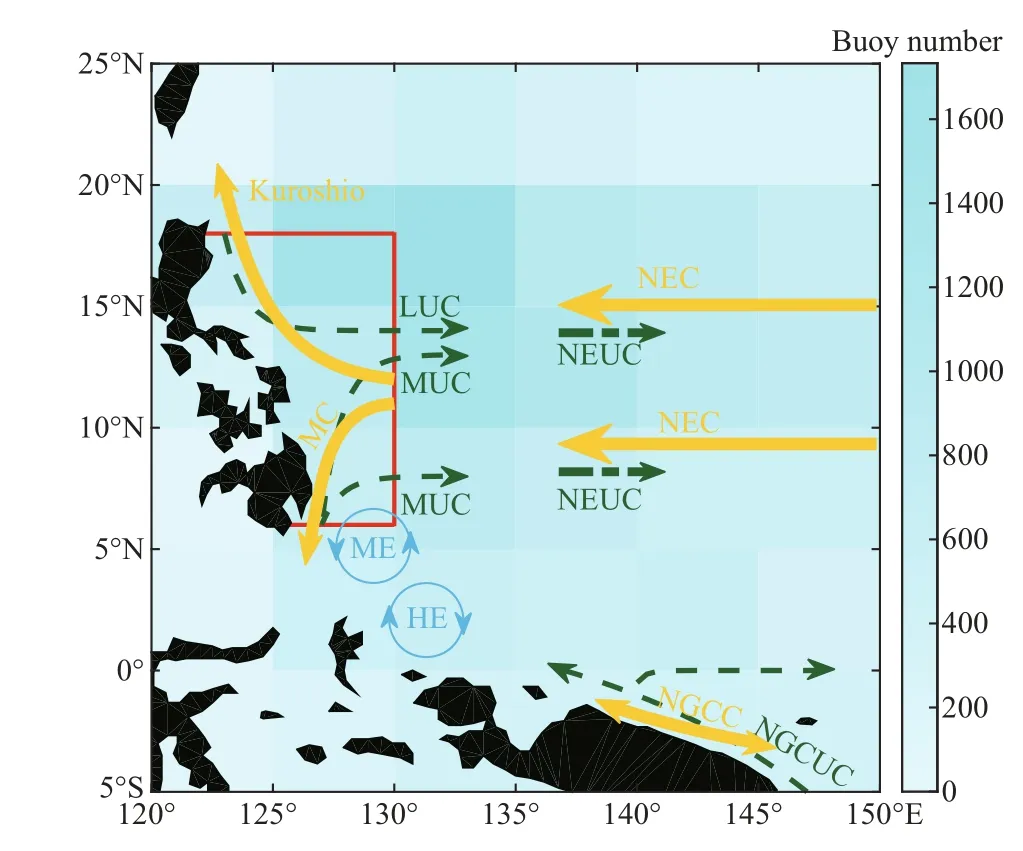
Fig.1 Schematic of the current system east of the Philippines (red box is the study area)
Many water masses from mid to high latitudes merge and mix in the tropical Western Pacifi c, including surface water masses—North Pacifi c Tropical Water (NPTW) and South Pacifi c Tropical Water (SPTW), and intermediate water masses—North Pacifi c Intermediate Water (NPIW) and Antarctic Intermediate Water (AAIW). The Antarctic Intermediate Water (AAIW) is largely formed at high-latitudes in the Southern Hemisphere, fl owing northward in each of the three major ocean basins (Hanawa and Talley, 2001). AAIW is transported by the New Guinea Coastal Undercurrent (NGCUC) into the North Pacifi c (Reid and Mantyla, 1978; Fine et al., 1994; Bingham and Lukas, 1995; Zenk et al., 2005). North of the equator, part of the AAIW fl ows eastward into the equatorial circulation, while the MUC transports the rest farther north along the western boundary to the Philippines Sea (Qu et al., 1999; Wang and Hu, 1999; Qu and Lindstrom, 2004; Schönau et al., 2015; Wang et al., 2015; Schönau and Rudnick, 2017). Wang et al. (2015) found AAIW only south of 10.5° N, transported by the MUC and NEUC northward and eastward, respectively. The NPIW is formed in the north Pacifi c subarctic (Talley, 1993, 1997; Talley et al., 1995; Yasuda et al., 1996; Yasuda, 1997), sinking along isopycnals in this region to fl ow equatorward and merge with the subtropical circulation. NPIW is found at north of 8°N along the western boundary of the tropical Pacifi c (Bingham and Lukas, 1994; Fine et al., 1994; Wang et al., 2015; Schönau and Rudnick, 2017). The AAIW and NPIW meet in the northwest tropical Pacifi c near the Philippines and spread to the central and eastern Pacifi c via equatorial currents and the Indian Ocean via the Indonesian Throughfl ow (Talley and Sprintall, 2005).
AAIW and NPIW both originate from the high latitudes and carry high dissolved oxygen, fresh water and global anthropogenic CO2(Talley, 1993; Tsunogai et al., 1995; Sarmiento et al., 1998; Hanawa and Talley, 2001) into the interior of the oceans. Understanding the pathway and volume variations of these water masses might be indicative of the exchange along the pathway and subsequent impact on climate change. Temporal variations of AAIW and NPIW are still poorly understood because of a lack of observational data. This paper aims to study the spatial properties of intermediate water masses in the Philippine Sea (Fig.1), their temporal variations and the dynamics that infl uence these variations. This paper is organized as follows. The data and methods are described in Section 2. The results are shown in Section 3. Section 4 gives the summary and discussion.
2 DATA AND METHOD
Individual Argo fl oat profi les, managed by China Argo Real-time Data Center (http://www.argo.org.cn/), are used to study the distribution of AAIW and NPIW and their climatological features. We only chose delayed mode profi les from January 2004 to December 2017 where the deepest pressure is below 1 500 dbar. Figure 1 shows the spatial (5°×5°) distribution of the Argo profi les. The fi nal data set consists of 21 419 profi les in the region 120°E-150°E, 5°S-20°N. The quantity of Argo profi les in the study region increased from 2004 and reached a maximum in 2013 (Fig.2a). There is little seasonal bias in the monthly Argo profi les (Fig.2b).
In general, the intermediate water is defi ned as 25.5< σθ<27.5 kg/m3(Bingham and Lukas, 1995). The temperature-salinity ( T- S) plot of intermediate water is shown for each 5°×5° bin in the region 120°E-150°E, 5°S-20°N (Fig.3). North of 15°N a single salinity minimum is found with a core salinity of 34.1 at a potential density of 26.8 kg/m3, this is the core of NPIW. South of the equator a salinity minimum with potential density of 27.2 kg/m3and core salinity of 34.5 is found between 140° E-150° E, this is the core of AAIW. Between the equator and 15°N, there are three salinity minima. The salinity minimum below 27.0 kg/m3is AAIW, which becomes more indistinct moving northwestward. Above 27.0 kg/m3is the NPIW salinity minimum with salinity about 34.2 and salinity increases southward. The third salinity minimum with salinity near 34.5 seems to originate from the east with a salinity and potential density larger than NPIW and that seems to disappear near the Philippines. The salinity maximum between the equator and 15°N at potential density of about 26.8 kg/m3and salinity of about 34.6 is North Pacifi c Tropical Intermediate Water (NPTIW) (Bingham and Lukas, 1995).
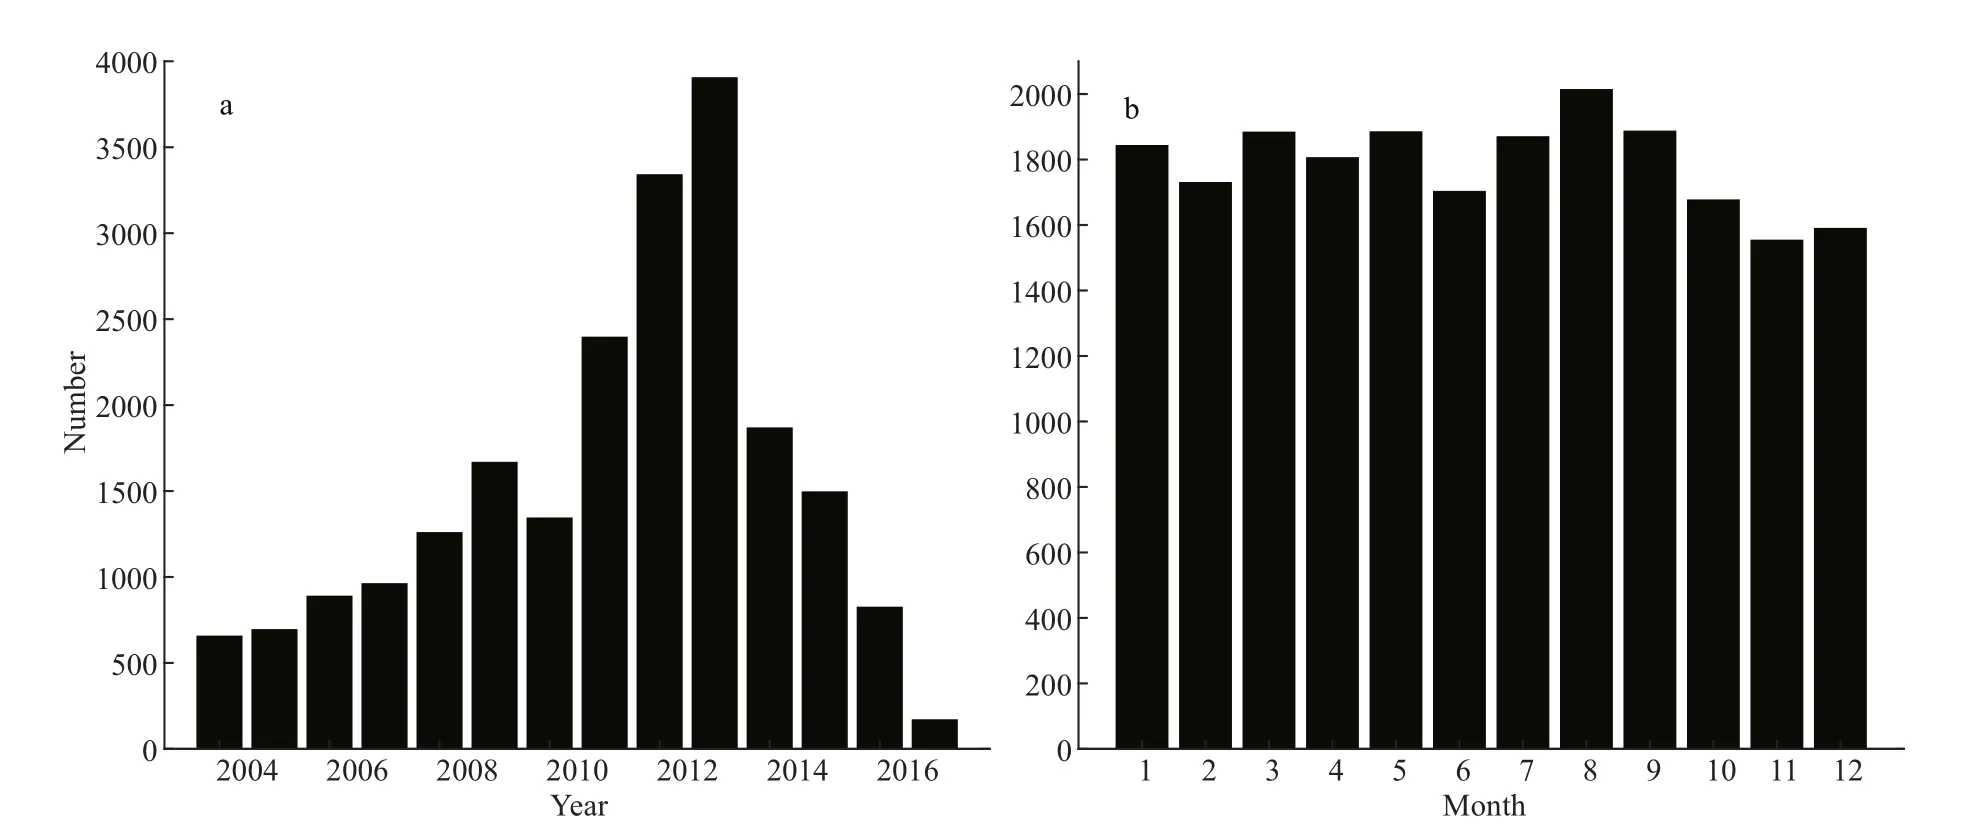
Fig.2 Yearly (a) and monthly (b) distributions of Argo profi les in the region 120°E-150°E, 5°S-20°N
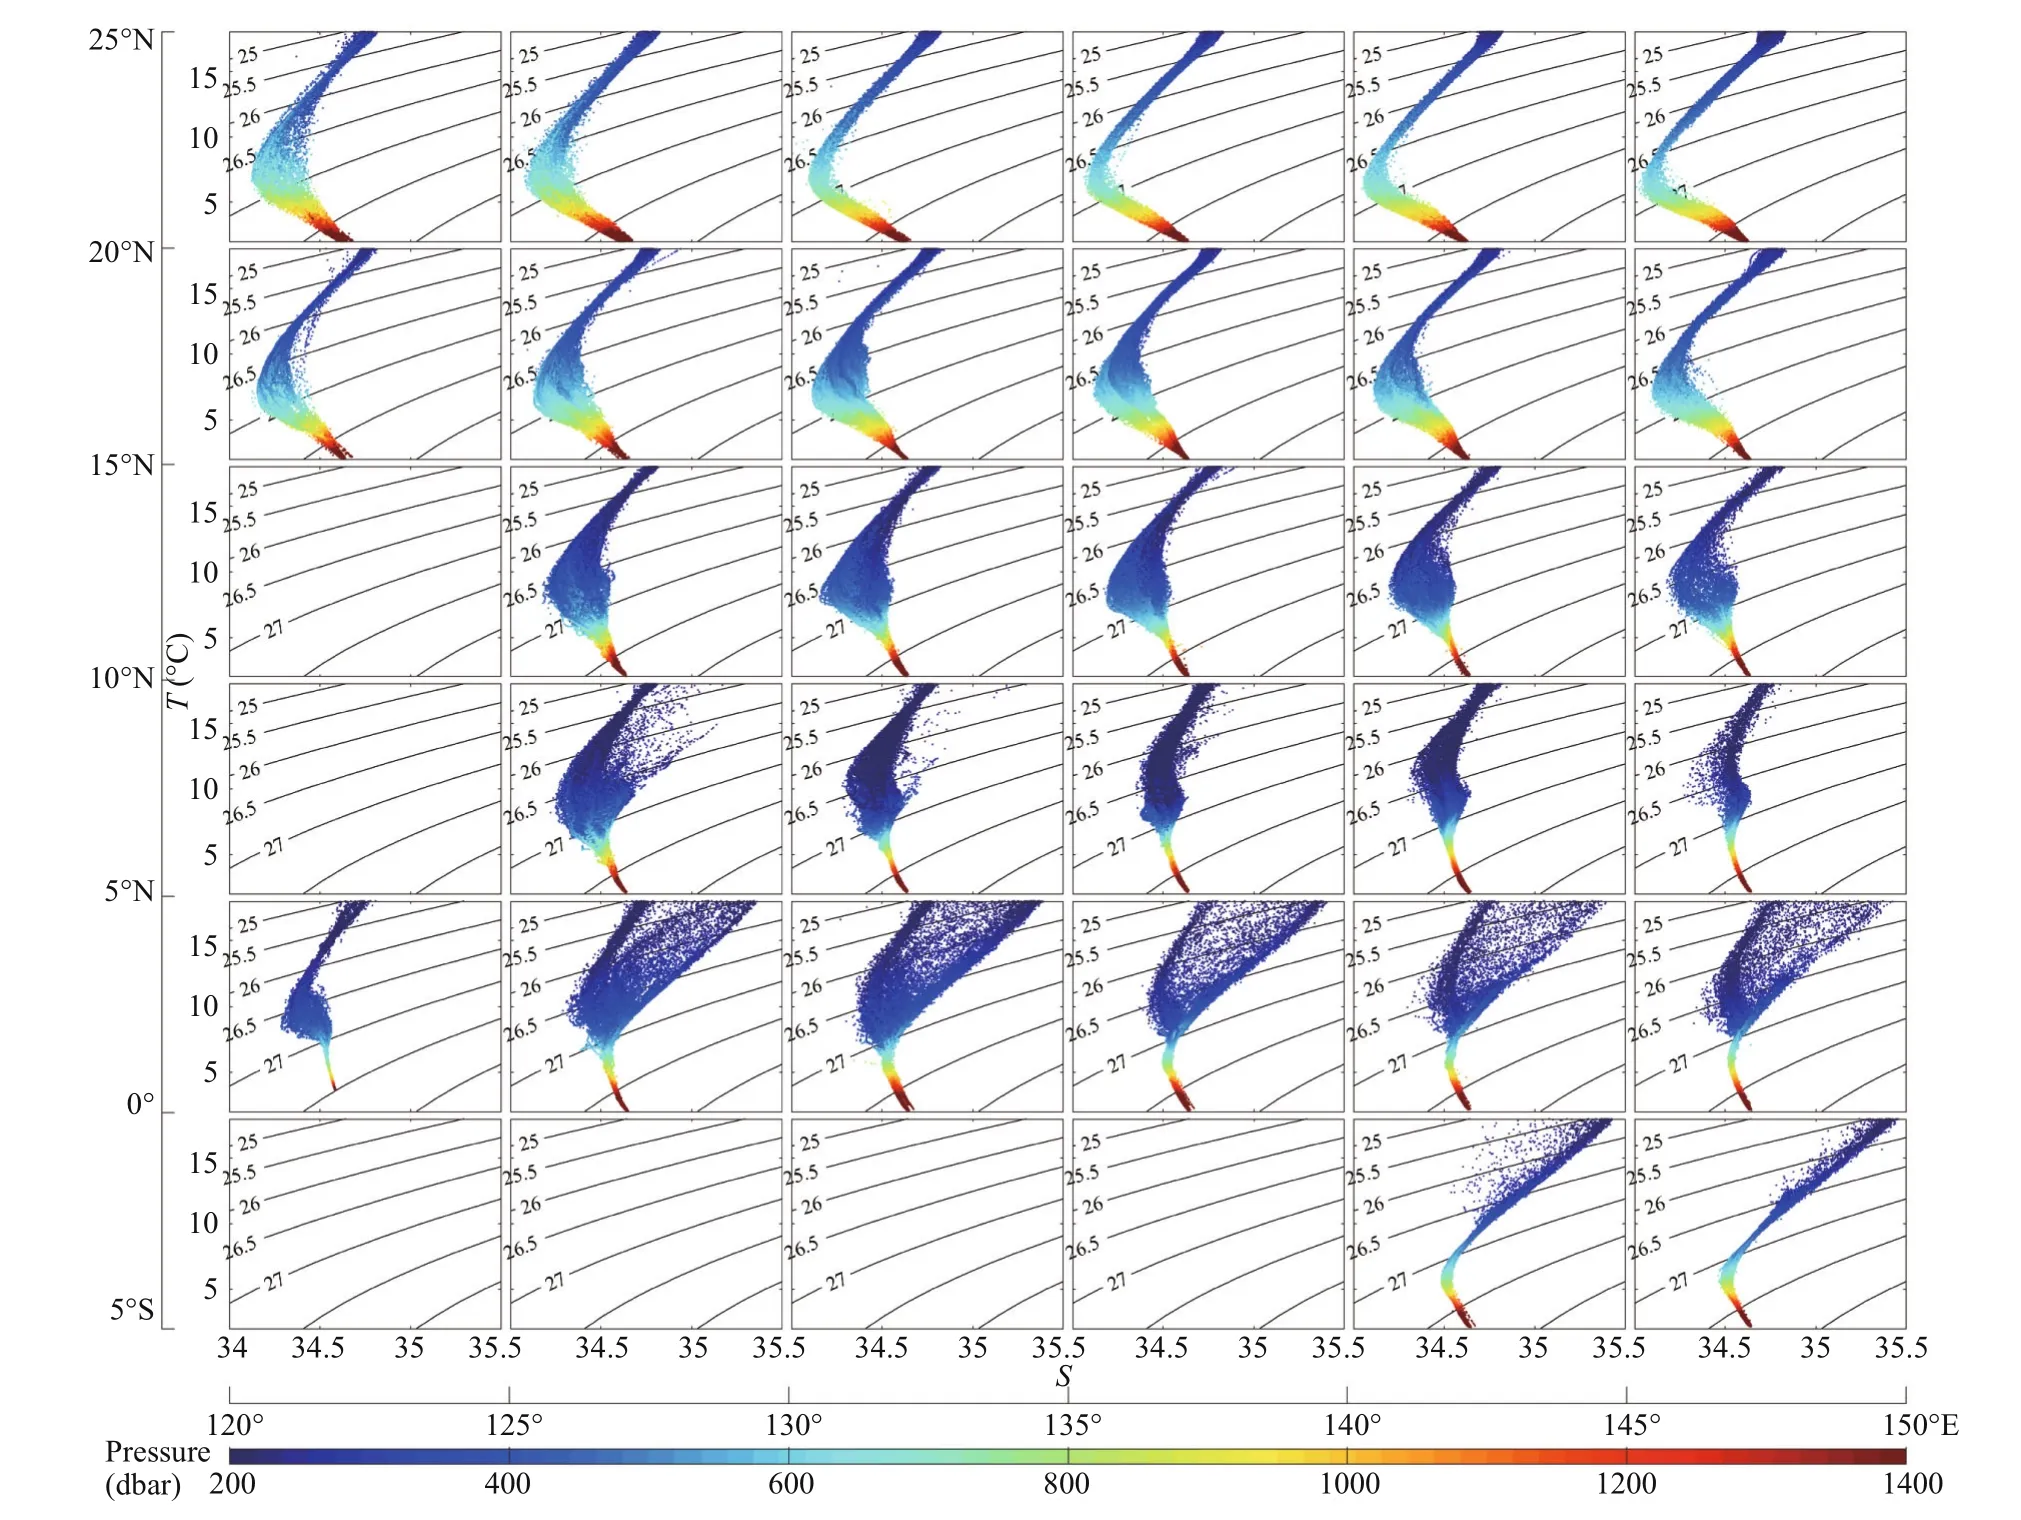
Fig.3 T- S plots of the intermediate water (25.5≤ σ θ ≤27.5 kg/m 3) with contour lines of potential density (kg/m 3) in the western Pacifi c Ocean
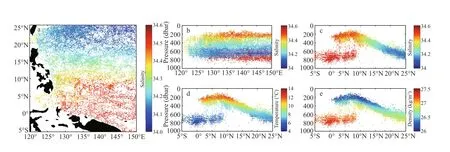
Fig.4 The spatial distribution of each Argo profi le salinity minimum in the intermediate water range with latitude and longitude (a), longitude and pressure (dbar) (b), latitude and pressure (dbar) (c-e)
NPIW and AAIW are both cold and low salinity water masses. Qu and Lindstrom (2004) traced AAIW as a salinity minimum. We also use the salinity minimum to determine the core features of the intermediate water masses and study their distributions. We interpolated temperature and salinity from each Argo profi le to 5-m vertical interval and fi ltered using a Gaussian fi lter. We located the salinity minimum of each Argo profi le, the horizontal and vertical distribution of each salinity minimum are shown in Fig.4.
The Argo gridded monthly data from the China Argo Real-time Data Center (http://www.argo.org.cn/) with spatial resolution of 1°×1° from January 2004 to December 2017 with depth extending to 2 000 m are used to calculate the time-series of the AAIW and NPIW volume, the geostrophic currents and the volume transport across the sections bounding the study area (red box in Fig.1). The geostrophic currents are calculated by estimating the dynamic height that is the vertical integration of specifi c volume anomaly:

where f is the Coriolis parameter, L is the distance of the adjacent grids, p is pressure, prefis pressure of the reference level (1 500 dbar in this paper), D1and D2are the dynamic height, and ε1and ε2are the specifi c volume anomalies.
3 RESULT
3.1 General characteristics
Figure 4a shows the horizontal distribution of each Argo profi le salinity minimum in the intermediate water (25.5≤ σθ≤27.5 kg/m3). The saltier water from the south and the fresher water from the north merge in the east of the Philippines. Three intermediate water masses were identifi ed according to the properties and positions of their salinity minima (Fig.4b-e). The fi rst water mass is located east of 127°E, south of 10°N, and below 600 dbar (Fig.4a-c), which is identifi ed as AAIW, characterized by a salinity of 34.5-34.55 (Fig.4c), a temperature of 4-7°C (Fig.4d) and a potential density of 27.0-27.3 kg/m3(Fig.4e) (Bingham and Lukas, 1994; Qu et al., 1999). The fresh tongue from the north is NPIW with salinity increase and shoaling depth (300-700 dbar) from 25°N to 10°N (Fig.4a & c), which is characterized by a salinity of 34.0-34.4 (Fig.4c), a temperature of 6-11°C (Fig.4d), and a potential density of 26.2-27.0 kg/m3(Fig.4e) (Qu et al., 1999; Wang et al., 2015). The last water mass is very shallow (200-300 dbar) (Fig.4b-c) and characterized by a salinity of 34.4-34.5 (Fig.4c), a temperature of 9-14°C (Fig.4d) and a potential density of 26.2-26.5 kg/m3(Fig.4e). This water mass is transported from east of 150°E and diff erent from the two other water masses in character. Oka and Suga (2005) found the North Pacifi c Central Water has two varieties- Dense Central Mode Water (DCMW) and Light Central Mode Water (LCMW). DCMW is formed in the northern region between the Kuroshio Extension front and the Kuroshio Bifurcation front, then shifts to the inner side of the subtropical gyre and is advected to 30°N-35°N along 152°W. DCMW varies from year to year, with temperature of 6.6-10.9°C and potential density of 26.3-26.4 kg/m3. Bingham and Suga (2006) defi ne DCMW as temperature of 9.5°C and salinity of 34.2-34.3. We can confi rm the third water mass is DCMW, which has a diff erent source region and pathway from the intermediate water masses. Hence the DCMW is out of the scope of discussion in this paper, and we will restrict our analysis in this paper to AAIW and NPIW.

Fig.5 The salinity (colors) and geostrophic velocity (m/s, lines) along the cross-sections at 6°N (a), 18°N (b), and 130°E (c)
The defi nitions of AAIW and NPIW are shown in Table 1 according to the water mass properties described above. Figure 5 shows the salinity and geostrophic velocity along the southern boundary (6°N; Fig.5a), the northern boundary (18°N; Fig.5b) and the eastern boundary (130°E; Fig.5c) sections of the study region (red box in Fig.1). In the southern section, the MC with a maximum velocity of 17 cm/s is located west of 129°E above 400 dbar while the core of the MUC with a maximum velocity of 1 cm/s is located at about 600 dbar (Fig.5a). AAIW (defi ned as in Table 1) exists below 500 dbar on the southern section at 6°N and is transported by the MUC. Along the northern 18°N section, the surface Kuroshio with a maximum velocity of 4.2 cm/s and the LUC with avelocity of 0.3 cm/s are located above and below 500 dbar, respectively. NPIW (defi ned as in Table 1) is located between 400 dbar and 700 dbar along 18°N, then transported by the LUC (nearshore part) and Kuroshio (off shore part) (Fig.5b). The NEC resides in a broad latitude range between 8°N and 18°N above 400 dbar with a core velocity of 24 cm/s (Fig.5c). The NEUC has three cores with velocities of 1.8 cm/s at 9° N, 0.9 cm/s at 13° N and 0.7 cm/s at 17° N, which are locations similar to that found by Qiu et al. (2013) although the velocities are smaller. AAIW exists below 500 db on the 130°E section with salinity decreasing northward (Fig.5c). NPIW exists in the northern part of the 130°E section. NPIW is at about 500 dbar depth with lower salinity but increasing salinity extending southward. NPIW can extend to 10°N and the depth shoals to 300 dbar. Most AAIW is transported eastward by the NEUC on the 130°E section, while the NPIW is transported westward by the NEC in the shallower layer (Fig.5c).

Table 1 Defi nitions of AAIW and NPIW
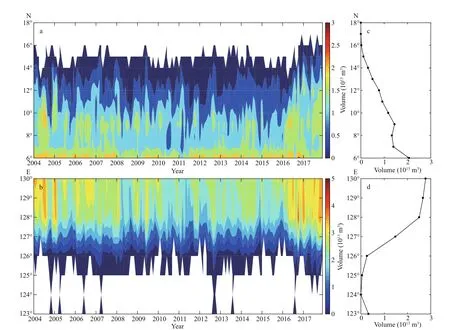
Fig.6 The time series of the zonal mean (a) and meridional mean (b) volume of AAIW (10 13 m 3), (c) and (d) are mean volumes of (a) and (b)
3.2 The temporal features of AAIW and NPIW
The volume of AAIW and NPIW in the Philippine Sea is calculated using gridded Argo data (horizontal resolution of 1°×1° and vertical resolution of 10 dbar) according to the defi nition of AAIW and NPIW in Table 1. A northward decreasing tendency of the volume of AAIW can be clearly seen in Fig.6a & c. Wang et al. (2015) revealed AAIW was tranported southward by MUC and part of the AAIW turned eastward with the NEUC at 9.5°N. The variations of AAIW volume near 9.5°N might be attributed to the NEUC (Figs.5c, 6b). The volume of AAIW decreases north of 12.5°N and AAIW does not extend beyond 14.5°N in most of the time series (Fig.6a & c). The majority of AAIW is located east of 126.5°E since Mindanao Island restricts fl ow to the west (Fig.6b & d). The zonal and meridional distribution of the mean volume of NPIW are shown in Fig.7. The majority of NPIW is located north of 10.5°N (Fig.7a & c). The maximum volume is located near 127°E, which is due to the high volume transport from Kuroshio (Figs.5b, 7b, 7d).
Figure 8a shows the monthly volume of AAIW and NPIW in the study area (according to the defi nition in Table 1) and 5-month moving average results. The volume of AAIW and NPIW in the western tropical Pacifi c are correlated negatively with a correlation coeffi cient of -0.359, which exceeds the 95% signifi cance level. Signifi cant seasonal variations in the volume of the NPIW and AAIW can be seen in Fig.8b. The volume of AAIW is large in winter (February) and summer (July), small in spring (May) and autumn (November), while the volume of NPIW is opposite—large in spring (April) and autumn (October) and small in winter (February) and summer (June). The wavelet power spectrum of the volume of AAIW and NPIW show signifi cant peaks in the AAIW and NPIW of 6 and 8 months, respectively (Fig.8c & d). The volume of AAIW decreased before 2011, then subsequently increased, but there is no similar tendency in the volume of NPIW.

Fig.7 The time series of the zonal mean (a) and meridional mean (b) volume of NPIW (10 13 m 3), (c) and (d) are mean volumes of (a) and (b)
4 SUMMARY AND DISCUSSION
The dimensional and temporal distribution of AAIW and NPIW were studied using Argo profi les and gridded Argo data. By distingushing the minimum salinity of the intermediate water (25.5≤ σθ≤ 27.5 kg/m3), we found the main core of AAIW is located east of 127°E, south of 10°N, and below 600 dbar and is characterized by a salinity of 34.5-34.55 and a potential density of 27.0-27.3 kg/m3. The fresh NPIW is located from 25°N to 10°N, and 300-700 dbar and is characterized by a salinity of 34.0-34.4 and a potential density of 26.2-27.0 kg/m3. AAIW is transported northward by the MUC across the southern 6°N section and eastward by the NEUC on eastern 130°E section. NPIW is transported southward by the LUC and northward by the Kuroshio on the northern section at 18°N and westward by the NEC on the eastern 130°E section.
The volume of AAIW and NPIW during January 2004 to December 2017 has distinct seasonal and interannual variations, and they are negatively correlated (Fig.8a & b). The dominant periods of AAIW and NPIW variability are 6 and 8 months, respectively. Semi-annual signals of meridional currents have previously been detected in the Philippine Sea (Qu et al., 2008; Qiu et al., 2015; Wang et al., 2016; Ren et al., 2018). The variation of NEUC has a strength semiannual peak between 8°N-20°N (Qiu et al., 2015), which coincides with the timing of meridional transport in the MC/MUC system (Qu et al., 2008). Qu et al. (2008) reported a semiannual variation signal of the MC which is forced by local Ekman pumping and the western propagation of Rossby waves originating in the central tropical Pacifi c. Wang et al. (2016) revealed the prominent semi-annual variability of subthermocline meridional fl ow along the Minanao coast using a mooring system at 8°N, 127°3′E during 2010-2014, which put forward the intermediate water exchange. Ren et al. (2018) also found the MC below 150 m is dominated by semi-annual variations, which is caused by semiannual surface wind and superimposition of the fi rst and second baroclinic modes. The variation of the intermediate water masses was infl uenced by the volume transport and local mixing, so we calculated the input (positive) and output (negative) volume tranport of AAIW and NPIW through the sections , respectively. The volume transport calculation formula is
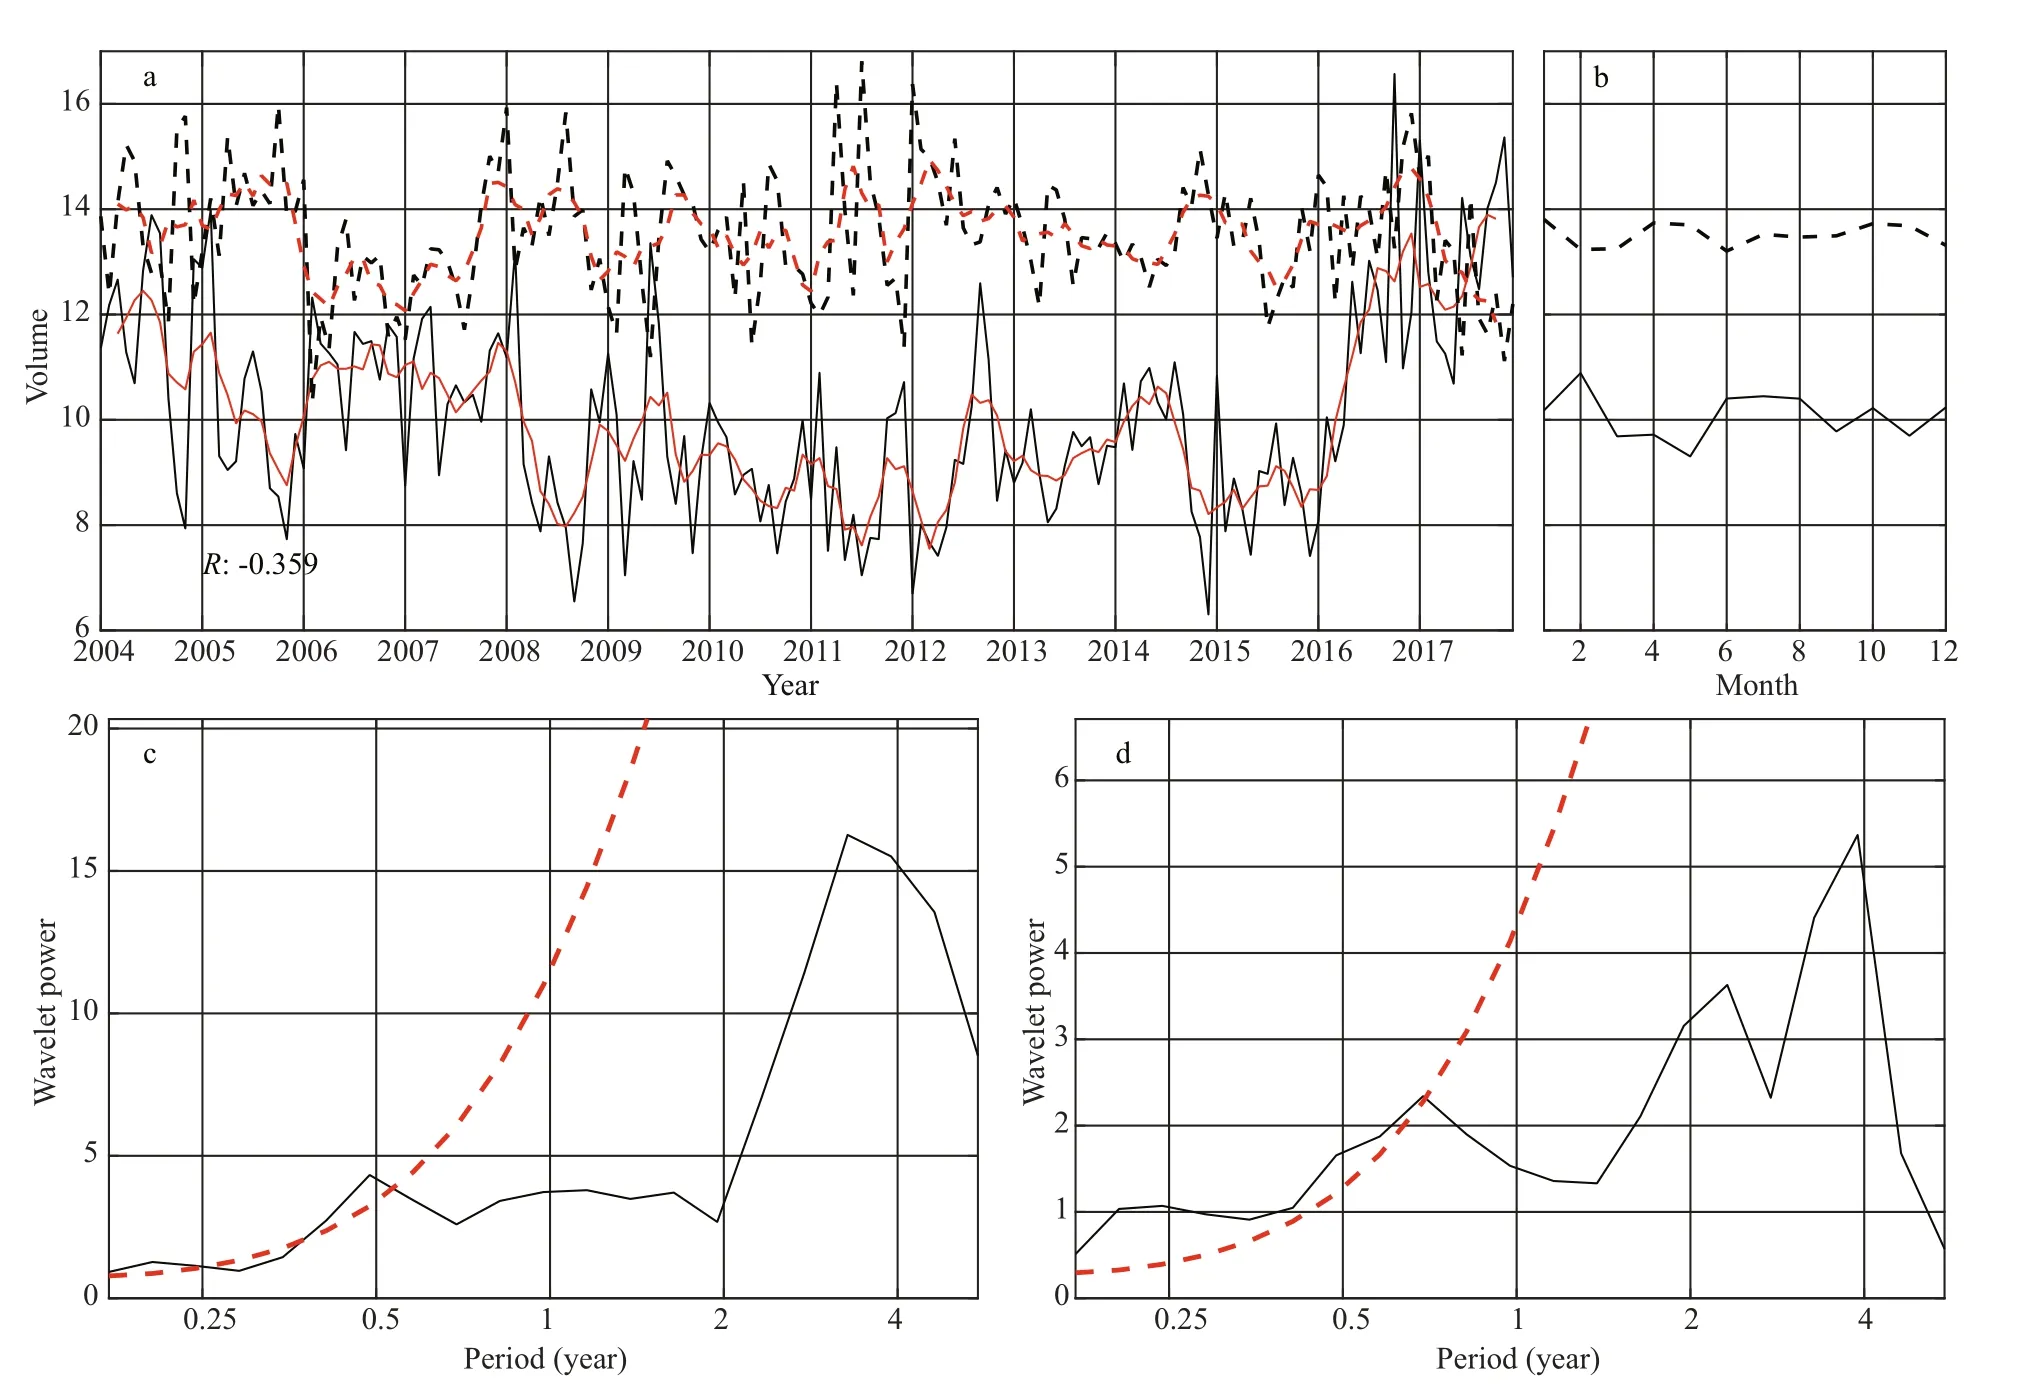
Fig.8 Time-series of the volume of AAIW (solid black line) and NPIW (dotted black line) during January 2004 to December 2017 in the Philippine Sea (10 13 m 3), and their 5 month moving average results (red solid line and dotted line) (a); climatological monthly volume of AAIW(solid line) and NPIW (dotted line) (b), wavelet power spectrum of AAIW volume (c) and NPIW volume (d)

where vi(o)is the input (output) velocity (e.g. the input fl ow is westward, while the output fl ow is eastward crossing 130°E), Ai(o)is the area of water masses along the sections (also are calcualted according to Table 1).
Figure 9 shows the wavelet spectrum of volume transports crossing three sections. The signifi cant peak of AAIW through 130°E and 6°N are 6 months (Fig.9a & b), which is same as the peak of AAIW volume. The signifi cant peak of NPIW through 130°E and 18°N are 5 and 6 months (Fig.9c & d), which is slightly diff erent from NPIW volume (8 months). We also calculated the 5-month moving average volume transport through each section and showed the correlation coeffi cient with volume of NPIW and AAIW in Table 2. There are signifi cant correlations between volume transport through 130°E and volume of AAIW (0.64 and -0.28), while the correlations between volume transport through 6°N and volume of AAIW are not signifi cant. Similarly, the correlations between volume transport through 130°E and volume of NPIW are 0.36 and -0.32, which both exceed the 95% signifi cance level. The correlation between output volume transport through 18°N and volume of NPIW is -0.17, which also exceeds the 95% signifi cance level. The volume transport through 130°E are mainly transferred by the NEC and NEUC in diff erent layers, so we inferred that NEC and NEUC are the main reasons for the variations of NPIW and AAIW.

Fig.9 Wavelet power spectrum of volume transport of AAIW through 130°E (a), AAIW through 6°N (b), NPIW through 130°E (c), NPIW throuth 18°N (d)

Table 2 The correlation coeffi cient of the volume transport through each section and the volume of intermediate water masses after 5-months moving average
The potential mechanisms of variation of water masses may be related to the variations of regional currents that are dominated by the wind system, local eddies, ocean waves. At the same time, the signals of temperature and salinity variations in the source regions could be transferred along the transportation path of water masses. In this article, we only discussed the local current infl uence on the volume of AAIW and NPIW. The impact from source regions and pathways of AAIW and NPIW, and the correlation with global climate change will be studied in future studies.
5 DATA AVAILABILITY STATEMENT
The Argo data are available from the China Argo Real-time Data Center (http://www.argo.org.cn/)
References
Bingham F M, Lukas R. 1994. The southward intrusion of North Pacifi c intermediate water along the Mindanao Coast. Journal of Physical Oceanography, 24(1): 141-154, https://doi.org/10.1175/1520-0485(1994)024<0141:TSIONP>2.0. CO;2.
Bingham F M, Lukas R. 1995. The distribution of intermediate water in the western equatorial Pacifi c during January-February 1986. Deep Sea Research Part I: Oceanographic Research Papers, 42(9): 1 545-1 573.
Bingham F M, Suga T. 2006. Distributions of mixed layer properties in North Pacifi c water mass formation areas: comparison of Argo fl oats and World Ocean Atlas 2001. Ocean Science, 2(1): 61-70, https://doi.org/10.5194/os-2-61-2006.
Fine R A, Lukas R, Bingham F M, Warner M J, Gammon R H. 1994. The western equatorial Pacifi c: a water mass crossroads. Journal of Geophysical Research: Oceans, 99(C12): 25 063-25 080, https://doi.org/10.1029/94JC02277.
Firing E, Kashino Y, Hacker P. 2005. Energetic subthermocline currents observed east of Mindanao. Deep Sea Research Part II: Topical Studies in Oceanography, 52(3-4): 605-613, https://doi.org/10.1016/j.dsr2.2004.12.007.
Gao S, Qu T D, Hu D X. 2012. Origin and pathway of the Luzon Undercurrent identifi ed by a simulated adjoint tracer. Journal of Geophysical Research: Oceans, 117(C5): C05011, https://doi.org/10.1029/2011JC007748.
Hanawa K, Talley L D. 2001. Mode waters. In: International Geophysics. Elsevier, Amsterdam.
Hu D X, Cui M C. 1989. The western boundary current in the far Western Pacifi c Ocean. In: Picaut J, Lukas R, Delcroix T eds. Western Pacifi c International Meeting and Workshop on Toga Coare: Proceedings. ORSTOM, Nouméa.
Hu D X, Cui M C. 1991. The western boundary current of the pacifi c and its role in the climate. Chinese Journal of Oceanology and Limnology, 9(1): 1-14, https://doi.org/10. 1007/BF02849784.
Hu D X, Hu S J, Wu L X, Li L, Zhang L L, Diao X Y, Chen Z H, Li Y L, Wang F, Yuan D L. 2013. Direct measurements of the Luzon undercurrent. Journal of Physical Oceanography, 43(7): 1 417-1 425, https://doi.org/10. 1175/JPO-D-12-0165.1.
Kashino Y, Ishida A, Kuroda Y. 2005. Variability of the Mindanao Current: mooring observation results. Geophysical Research Letters, 32(18): L18611, https://doi.org/10.1029/2005GL023880.
Nitani H. 1972. Beginning of the Kuroshio. In: Stommel H, Yoshida K eds. Kuroshio: its physical aspects. University of Tokyo Press, Tokyo, p.129-163.
Oka E, Suga T. 2005. Diff erential Formation and Circulation of North Pacifi c Central Mode Water. Journal of Physical Oceanography, 35(11): 1 997-2 011, https://doi.org/10. 1175/JPO2811.1.
Qiu B, Lukas R. 1996. Seasonal and interannual variability of the North Equatorial Current, the Mindanao Current, and the Kuroshio along the Pacifi c western boundary. Journal of Geophysical Research: Oceans, 101(C5): 12 315-12 330, http://doi.org/10.1029/95JC03204.
Qiu B, Rudnick D L, Cerovecki I, Cornuelle B D, Chen S M, Schönau M C, McClean J L, Gopalakrishnan G. 2015. The Pacifi c North equatorial current: new insights from the origins of the Kuroshio and Mindanao Currents (OKMC) Project. Oceanography, 28(4): 24-33, https://doi.org/10.5670/oceanog.2015.78.
Qiu B, Rudnick D L, Chen S M, Kashino Y. 2013. Quasistationary North Equatorial Undercurrent jets across the tropical North Pacifi c Ocean. Geophysical Research Letters, 40(10): 2 183-2 187, https://doi.org/10.1002/grl.50394.
Qu T D, Chiang T L, Wu C R, Dutrieux P, Hu D X. 2012. Mindanao Current/Undercurrent in an eddy-resolving GCM. Journal of Geophysical Research: Oceans, 117(6): C06026, https://doi.org/10.1029/2011JC007838.
Qu T D, Gan J P, Ishida A, Kashino Y, Tozuka T. 2008. Semiannual variation in the western tropical Pacifi c Ocean. Geophysical Research Letters, 35(16): L16602, https://doi.org/10.1029/2008GL035058.
Qu T D, Kagimoto T, Yamagata T. 1997. A subsurface countercurrent along the east coast of Luzon. Deep Sea Research Part I: Oceanographic Research Papers, 44(3): 413-423, https://doi.org/10.1016/S0967-0637(96)00121-5.
Qu T D, Lindstrom E J. 2004. Northward intrusion of Antarctic intermediate water in the Western Pacifi c. Journal of Physical Oceanography, 34(9): 2 104-2 118, https://doi.org/10.1175/1520-0485(2004)034<2104:NIOAIW>2.0.CO;2.
Qu T D, Mitsudera H, Yamagata T. 1998. On the western boundary currents in the Philippine Sea. Journal of Geophysical Research: Oceans, 103(C4): 7 537-7 548, https://doi.org/10.1029/98JC00263.
Qu T D, Mitsudera H, Yamagata T. 1999. A climatology of the circulation and water mass distribution near the Philippine Coast. Journal of Physical Oceanography, 29(7): 1 488-1 505, https://doi.org/10.1175/1520-0485 (1999)029<1488:ACOTCA>2.0.CO;2.
Reid J L, Mantyla A W. 1978. On the mid-depth circulation of the North Pacifi c Ocean. Journal of Physical Oceanography, 8(6): 946-951, https://doi.org/10.1175/1520-0485(1978)008<0946:OTMDCO>2.0.CO;2.
Ren Q P, Li Y L, Wang F, Song L N, Liu C Y, Zhai F G. 2018. Seasonality of the Mindanao current/undercurrent system. Journal of Geophysical Research: Oceans, 123(2): 1 105-1 122, https://doi.org/10.1002/2017JC013474.
Sarmiento J L, Hughes T M C, Stouff er R J, Manabe S. 1998. Simulated response of the ocean carbon cycle to anthropogenic climate warming. Nature, 393(6682): 245-249, https://doi.org/10.1038/30455.
Schönau M C, Rudnick D L. 2017. Mindanao Current and Undercurrent: thermohaline structure and transport from repeat glider observations. Journal of Physical Oceanography, 47(8): 2 055-2 075, https://doi.org/10.1175/JPO-D-16-0274.1.
Schönau M C, Rudnick D L, Cerovecki I, Gopalakrishnan G, Cornuelle B D, McClean J L, Qiu B. 2015. The Mindanao Current: mean structure and connectivity. Oceanography, 28(4): 34-45, https://doi.org/10.5670/oceanog.2015.79.
Talley L D. 1993. Distribution and formation of north Pacifi c intermediate water. Journal of Physical Oceanography, 23(3): 517-537, https://doi.org/10.1175/1520-0485(1993) 023<0517:DAFONP>2.0.CO;2.
Talley L D. 1997. North Pacifi c intermediate water transports in the mixed water region. Journal of Physical Oceanography, 27(8): 1 795-1 803, https://doi.org/10.1175/1520-0485 (1997)027<1795:NPIWTI>2.0.CO;2.
Talley L D, Nagata Y, Fujimura M, Iwao T, Kono T, Inagake D, Hirai M, Okuda K. 1995. North Pacifi c intermediate water in the Kuroshio/Oyashio mixed water region. Journal of Physical Oceanography, 25(4): 475-501, https://doi.org/10.1175/1520-0485(1995)025<0475:NPI WIT>2.0.CO;2.
Talley L D, Sprintall J. 2005. Deep expression of the Indonesian Throughfl ow: Indonesian intermediate water in the South Equatorial Current. Journal of Geophysical Research: Oceans, 110(C10): C10009, https://doi.org/10. 1029/2004jc002826.
Toole J, Millard R, Wang Z, Pu S. 1990. Observations of the Pacifi c North Equatorial Current bifurcation at the Philippine coast. Journal of Physical Oceanography, 20(2): 307-318, http://doi.org/10.1175/1520-0485(1990) 020<0307:OOTPNE>2.0.CO;2.
Tsunogai S, Watanabe S, Honda M, Aramaki T. 1995. North Pacifi c Intermediate Water studied chiefl y with radiocarbon. Journal of Oceanography, 51(5): 519-536, https://doi.org/10.1007/BF02270522.
Wang F, Hu D X. 1998. Dynamic and thermohaline properties of the Mindanao Undercurrent I. dynamic structure. Chinese Journal of Oceanology and Limnology, 16(2): 122-127, https://doi.org/10.1007/BF02845177.
Wang F, Hu D X. 1999. Preliminary study on the formation mechanism of counter western boundary undercurrents below the thermocline—A conceptual model. Chinese Journal of Oceanology and Limnology, 17(1): 1-9, https://doi.org/10.1007/BF02842694.
Wang F, Song L N, Li Y L, Liu C Y, Wang J N, Lin P F, Yang G, Zhao J, Diao X Y, Zhang D X, Hu D X. 2016. Semiannually alternating exchange of intermediate waters east of the Philippines. Geophysical Research Letters, 43(13): 7 059-7 065, https://doi.org/10.1002/2016GL069323.
Wang F, Zang N, Li Y L, Hu D X. 2015. On the subsurface countercurrents in the Philippine Sea. Journal of Geophysical Research: Oceans, 120(1): 131-144, https://doi.org/10.1002/2013JC009690.
Wang Q Y, Hu D X. 2012. Origin of the Luzon Undercurrent. Bulletin of Marine Science, 88(1): 51-60, https://doi.org/10.5343/bms.2011.1020.
Yasuda I. 1997. The origin of the North Pacifi c Intermediate Water. Journal of Geophysical Research: Oceans, 102(C1): 893-909, https://doi.org/10.1029/96JC02938.
Yasuda I, Okuda K, Shimizu Y. 1996. Distribution and modifi cation of North Pacifi c Intermediate Water in the Kuroshio-Oyashio interfrontal zone. Journal of Physical Oceanography, 26(4): 448-465, https://doi.org/10.1175/1520-0485(1996)026<0448:DAMONP>2.0.CO;2.
Zenk W, Siedler G, Ishida A, Holfort J, Kashino Y, Kuroda Y, Miyama T, Müller T J. 2005. Pathways and variability of the Antarctic intermediate water in the western equatorial Pacifi c Ocean. Progress in Oceanography, 67(1-2): 245-281, https://doi.org/10.1016/j.pocean.2005.05.003.
Zhang L L, Hu D X, Hu S J, Wang F, Wang F J, Yuan D L. 2014. Mindanao Current/Undercurrent measured by a subsurface mooring. Journal of Geophysical Research: Oceans, 119(6): 3 617-3 628, https://doi.org/10.1002/ 2013JC009693.
 Journal of Oceanology and Limnology2020年5期
- Journal of Oceanology and Limnology的其它文章
- Distribution, sources and burial fl ux of sedimentary organic matter in the East China Sea*
- Photoelectrochemical cathodic protection of Cu 2 O/TiO 2 p-n heterojunction under visible light*
- Antioxidant bisabolane-type sesquiterpenoids from algalderived fungus Aspergillus sydowii EN-434*
- Calcium isotopic signatures of depleted mid-ocean ridge basalts from the northeastern Pacifi c*
- Application of confocal laser Raman spectroscopy on marine sediment microplastics*
- Corrosion behavior of Q235B carbon steel in simulated seawater pumped storage system under operational conditions*
