Optimizing the Extraction of Anthocyanins from Pitaya (Hylocereus undatus) Pericarp
Shuiming CHENG Xia ZENG Guoyu ZHOU Caimei YAN


Abstract [Objectives] This study was conducted to confirm the existence of anthocyanins in pitaya (Hylocereus undatus) pericarp and optimize the extraction condition.
[Methods] Single-factor tests were carried out on five factors: ethanol concentration, extraction temperature, ultrasonic power, solid-to-liquid ratio and extraction time. Based on the single-factor test results, four factors and three levels of process conditions were optimized by Box-Behnken design test.
[Results] Anthocyanins exist in the pericarp of pitaya, and the optimum conditions were extraction temperature 49 ℃, ultrasonic power 120 W, extracted time 2 h and ethanol concentration 60%. Under these conditions, the average yield of anthocyanins was 80 mg/100g.
[Conclusions] This study provides a theoretical basis for the extraction of anthocyanins from the pericarp of red-flesh pitaya.
Key words Hylocereus undatus pericarp; Anthocyanin; Ultrasound-assisted extraction; Response surface design
Pitaya (Hylocereus undatus Britt) belongs to Hylocereus in Cactaceae[1]. Its flesh is red, pink, purple or white[2]. It is native to Mexico and Central America[3]. At present, pitaya is planted in Guangdong, Hainan, Guangxi, Guizhou, Yunnan and other places in China in large areas, with an industrial scale of 333-4 400 hm2[4]. The whole body of pitaya is a treasure. The pericarp is the main byproduct in the process of processing, and the amount accounts for 25% of the total weight of pitaya. The pericarp contains a large amount of natural pigments, flavonoids, polysaccharides and dietary fiber. However, at present, only a very small amount is used as a raw material for extracting natural pigments and dietary fiber, and most of them are thrown away as waste, resulting in serious waste of resources[5]. At present, the research on the pericarp focuses on the extraction of pigments and pectin, and there are many research reports on pigments[6-9]. Most of existing studies believe that the pigment component of pitaya cortex is β-cyanoside, and it does not contain anthocyanins[10-12]. However, Yang et al.[13] believed that the red pigment of pitaya is composed of a mixture of plant pigments with various structures, including betanin, as well as anthocyanins. At present, the research on the extraction of pitaya pigments focuses on the red pigments[14-18], while few studies have been conducted on betanin and anthocyanins. Anthocyanins can be used not only in the food industry, but also in the beauty industry, healthcare, etc., and their added value is higher. Are there anthocyanins in the pericarp? How can we extract them effectively? This problem is not only a basic research problem that must be solved academically, but also has a close relationship with the industrial transformation and development, and is worthy of in-depth study.
Materials and Methods
Test materials and instruments
Test materials
Red-flesh pitaya: "Dalong" variety, native to Taiwan, commercially available; hydrochloric acid, sodium hydroxide and absolute ethanol, all analytically pure.
Instruments
Freeze dryer, CHYZ-10N, Ningbo Scientz Biotechnology Co., Ltd.; ultrasonic cell disintegrator, XO-10000D, Nanjing Xianou Instruments Manufacture Co., Ltd.; UV-Visible spectrophotometer, UV-5500PC, METASH; pH meter, PHS-2F, INESA Scientific Instrument Co., Ltd.; electronic analytical balance, FA2104, Shanghai Liangping Instrument Co., Ltd.
Experimental methods
Anthocyanin extraction process
Peeling pitaya→washing the pericarp→cutting to small pieces of 2-3 cm→freeze-drying→crushing and sieving→extracting with ethanol→detecting
Single factor test design
Material-to-liquid ratio (a): A certain amount of the pericarp powder (1 g) was weighed, and added with 15, 20, 25, 30, 35 and 40 ml of 60% ethanol aqueous solution, respectively. Ultrasonic extraction was performed at 100 W for 30 min, and the extraction systems were heated in a 50 ℃ water bath for 2 h, followed by filtration. The filtrates were determined for absorbance, and the extraction amount of anthocyanins was calculated.
Ultrasonic power (b): A certain amount of the pericarp powder (1 g) was weighed and added into conical flasks, respectively, each of which was added with 25 ml of 60% ethanol. The mixture was ultrasonically extracted at 60, 80, 100, 120 and 140 W for 30 min, respectively, and then heated in a 50 ℃ water bath for 2 h, followed by filtration. The filtrates were determined for absorbance, and the extraction amount of anthocyanins was calculated.
Extraction time (d): A certain amount of the pericarp powder (1 g) was weighed and added into conical flasks, respectively, each of which was added with 25 ml of 60% ethanol. The mixture was ultrasonically extracted at 100 W for 30 min, and heated in a 50 ℃ water bath for 1, 1.5, 2 , 2.5 and 3 h, respectively, followed by filtration. The filtrates were determined for absorbance, and the extraction amount of anthocyanins was calculated.
Ethanol concentration (e): A certain amount of the pericarp powder (1 g) was weighed, and added with 25 ml of 40%, 50%, 60%, 70% and 80% ethanol aqueous solutions, respectively. Ultrasonic extraction was performed at 100 W for 30 min, and the extraction systems were heated in a 50 ℃ water bath for 2 h, followed by filtration. The filtrates were determined for absorbance, and the extraction amount of anthocyanins was calculated.
Determination of the maximum absorption wavelength of anthocyanins[19]
The anthocyanin extract was added with buffer solutions with pH 1.0 and pH 4.5, respectively, and the obtained liquids were subjected to full-wavelength scanning in the range of 400-600 nm. The wavelength where the absorbance difference was maximum was selected as the maximum wavelength for the determination of anthocyanins.
Calculation of anthocyanin extraction amount
Referring to the method in reference[20], the absorbance difference of anthocyanins at different pH values was calculated first according to the formula △A= (A1-A2)-(A3-A4), where A1 and A2 are respectively the absorbance of the extract (pH=1.0) at the maximum wavelength and the wavelength of 700 nm, and A3 and A4 are respectively the absorbance of the extract (pH=4.5) at the maximum wavelength and the wavelength of 700 nm. Then, the extraction amount of anthocyanins was calculated according to the formula M=[(1×ε)/(MW×△A)]×1 000×Df, where MW and ε are the standard anthocyanin control product cyanidin-3-O-glucoside (449.2) and molar extinction coefficient (26 900), and Df is the dilution factor.
Response surface test design
According to the single-factor test results, an anthocyanin extraction process optimization test was designed through the Box-Behnken central composite design, and a verification test was conducted on the optimized process conditions.
Data processing method
The experimental data was processed with Excel, and figure drawing was performed with Oringin 9.0. The response surface optimization test used Design Expert 8.0 for data processing and drawing.
Results and Analysis
Maximum wavelength for anthocyanin detection
After testing, the maximum difference in the absorption of the anthocyanin extract between pH 1.0 and pH 4.5 in the range of 300-700 nm corresponded to a wavelength of 525 nm, and the subsequent test used 525 nm as the determination wavelength of anthocyanins.
Single factor test results
Effect of material-to-liquid ratio on anthocyanin extraction
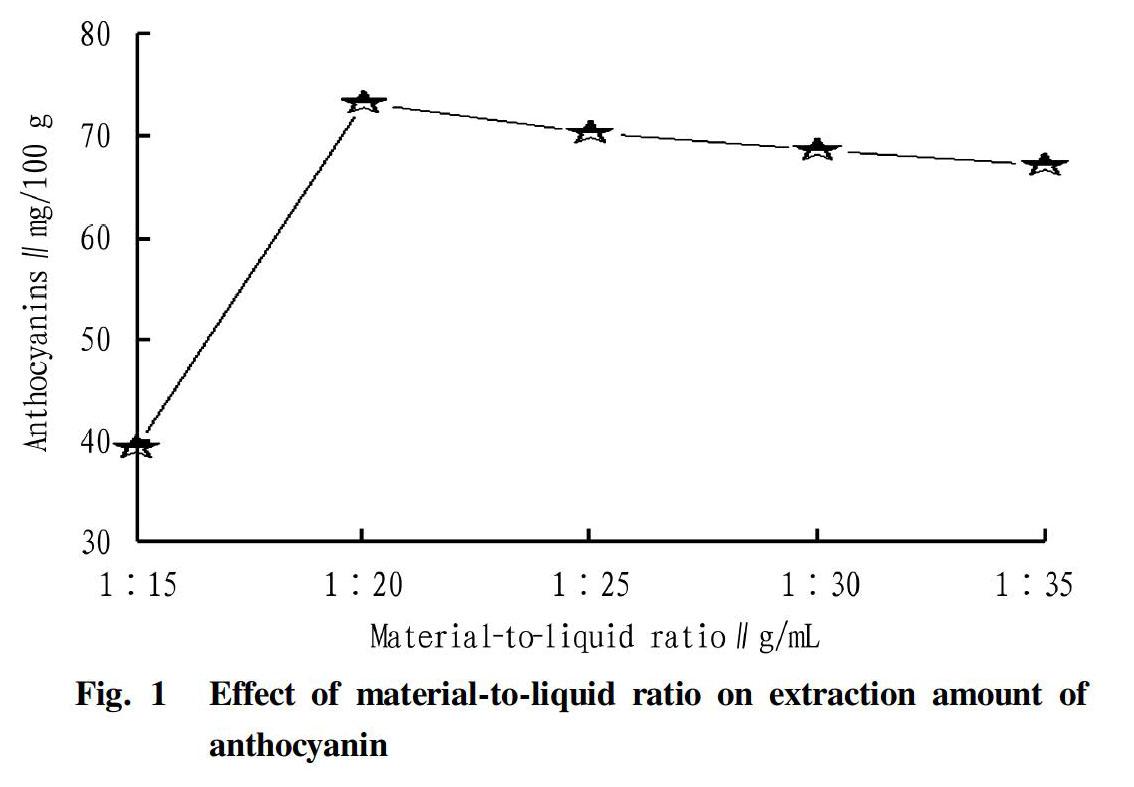
The effect of material-to-liquid ratio on anthocyanin extraction is shown in Fig. 1.
As can be seen in Fig. 1, as the material-to-liquid ratio changed from 1∶15 (g/ml) (the same below) to 1∶20, the extraction amount increased, and the maximum value was 73 mg/100 g at 1∶20. With the further increase in material-to-liquid ratio, the extraction amount decreased instead. The reason was that as the extraction dose increased, other coexisting pigments competed with anthocyanins for solvents. From operation and economic considerations, 1∶20 was selected as the material-to-liquid ratio for anthocyanin extraction.
Effect of ultrasonic power on anthocyanin extraction
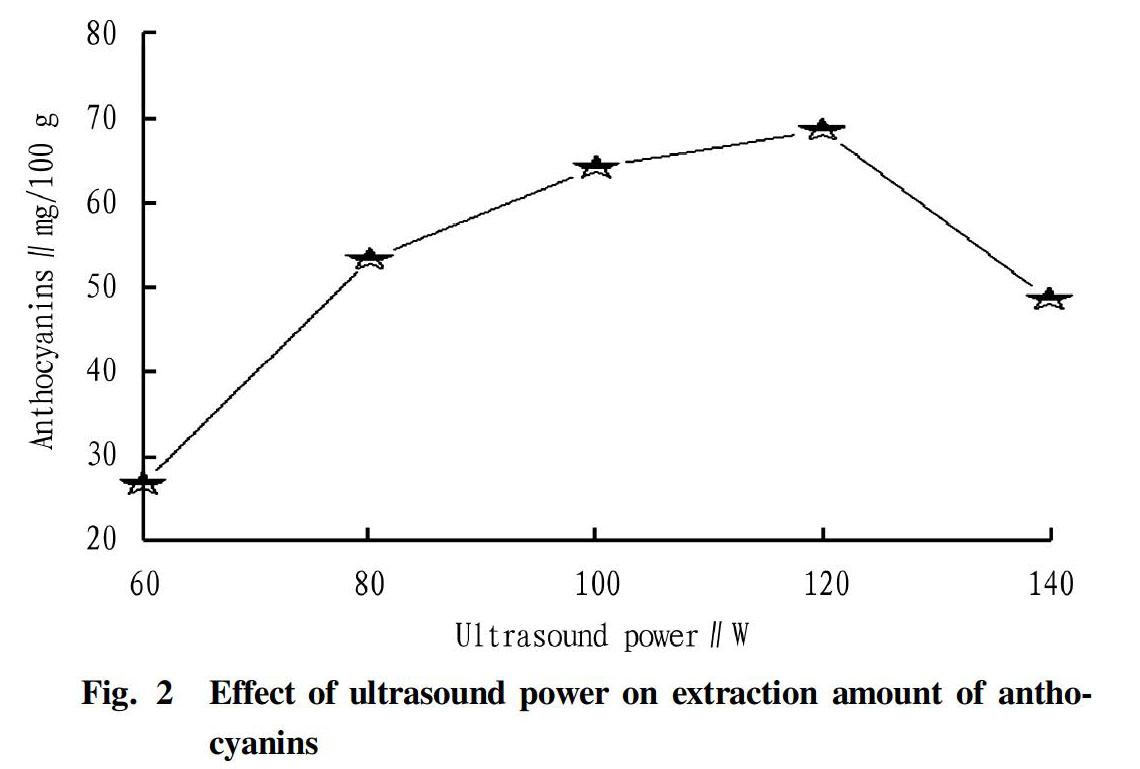
The effect of ultrasonic power on anthocyanin extraction is shown in Fig. 2.
It could be seen from Fig. 2 that when the power was from 60 to 140 W, the amount of anthocyanin extraction increased first, but dropped after the power exceeded 130 W. The reason was that the greater the power, the stronger the crushing effect, and the greater the heat production, which accelerated the dissolution of anthocyanins, but a too-high power led to too-high heat production, destroying anthocyanin structure. Therefore, 100-120 W was used as the power for anthocyanin extraction.
Effect of temperature on extraction of anthocyanins
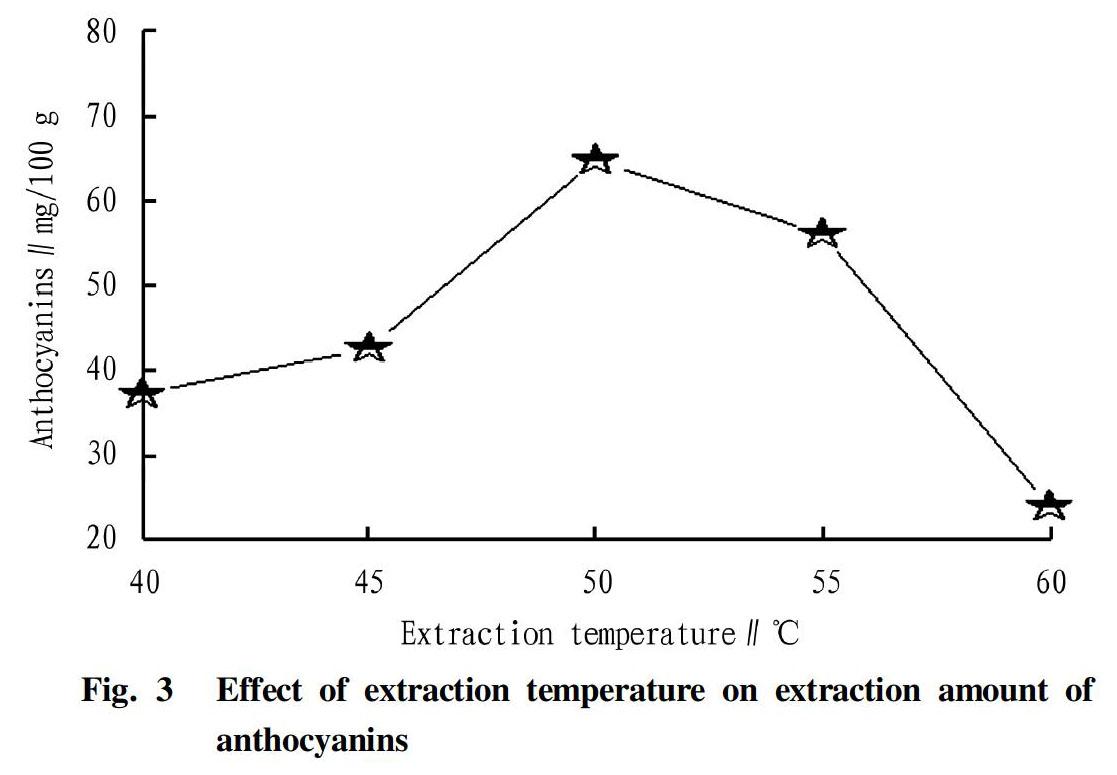
The effect of temperature on the extraction of anthocyanins is shown in Fig. 3.
As can be seen in Fig. 3, the extraction amount of anthocyanins increased in the range of 40-50 ℃, but began to decrease after the temperature exceeded 50 ℃. It was due to that as temperature rose, coexisting impurities competed to dissolve. The extraction temperature suitable for subsequent test was determined in the range of 45-55 ℃.
Effect of extraction time on anthocyanin extraction
The effect of time on the extraction of anthocyanins is shown in Fig. 4.
It could be seen from Fig. 4 that the extraction amount of anthocyanins continued to increase within 1-2 h of extraction. The extraction amount of anthocyanins was the highest at 2 h, reaching 65 mg/100 g, and the extraction amount decreased after 2 h.
Effect of ethanol concentration on anthocyanin extraction
The effect of ethanol concentration on anthocyanin extraction is shown in Fig. 5.
It could be seen from Fig. 5 that the anthocyanin extraction amount gradually increased with the ethanol in the extracting solution increasing from 40% to 60%, but it begun to decrease after the ethanol concentration exceeded 60%, because alcohol-soluble impurities were dissolved. The ethanol concentration was more suitable in the range of 50%-70% for the extraction experiment.
Response surface test results
The establishment and analysis of mathematical model
Combined with the Box-Behnken design on the basis of the single factor test, a 4-factor 3-level response surface test was designed and carried out at a material-to-liquid ratio of 1∶20 (g/ml) with four factors ethanol concentration (A), ultrasonic power (B), extraction temperature (C) and extraction time (D) as the influencing factors and the extraction amount of anthocyanin as the response value. The Box-Behnken test scheme is shown in Table 1.
The response surface test results are shown in Table 2. Design-Expert. V8.0 software was used to perform regression model analysis of variance on the test data in Table 2. The results are shown in Table 3.
Multiple regression equation fitting was performed on the test results in Table 2 using Design-Expert.V8.0 software, obtaining a quadratic regression fitting equation with anthocyanin extraction amount as the objective function:
Y=+0.078+0.002 5 A+0.000 33 B-0.004 6 C+0.000 25 D-0.000 25 AB-0.003 AC-0.000 25 AD-0.000 5 BC-0.000 25 BD-0.000 25 CD-0.016 A2-0.009 63 B2-0.016 C2 -0.001 1 D2.
It could be seen from Table 3 that the regression model was extremely significant (P<0.001), and the lack of fit was not significant (P=0.594 5>0.05). The model had R2=0.947 8 and R2Adj=0.976 6, so the model had a good degree of fitting, and could predict the response value very well. The one degree terms A and C and the quadratic terms AC, A2, B2 and C2 were extremely significant (P<0.01), and the order of the effects of various factors on the extraction amount of anthocyanin ranked as C (extraction temperature)>A (ethanol concentration)>B (ultrasonic power)>D (extraction time).
Analysis of interaction between influencing factors
Referring to literature[21]and literature[22], one parameter was set at the zero level, to explore the effect of the interaction between the remaining two parameters on the extraction amount of anthocyanins, and the response surface and contour lines are shown in the figures.
Fig. 6 could intuitively reflect the influence degree of the interaction between ethanol concentration, ultrasonic power, extraction temperature and extraction time on the extraction of anthocyanin from the pericarp. The steeper the response surface, the more obvious the interaction between the two influencing factors[23-24]. It could be seen from Fig. 6 that the interaction between ethanol concentration and extraction temperature had a significant effect on the extraction of anthocyanins (P<0.05), and the interaction between the remaining factors was not significant (P>0.05), which was consistent with the analysis of variance.
Verification test
The established model was analyzed by software. The conditions for extracting anthocyanins were ethanol concentration of 60.45%, ultrasonic power of 120.19 W, extraction temperature at 49.26 ℃ and extraction time of 2.05 h, with which the expected extraction amount of anthocyanin was 78 mg/100g. Taking into account the feasibility of actual operation, the extraction conditions were corrected to ethanol concentration 60%, ultrasonic power 120 W, extraction temperature 49 ℃, and extraction time 2 h. Under these conditions, the reliability of the regression model was tested and a verification test was conducted. After three parallel tests, the average extraction amount of anthocyanin was 80 mg/100 g, which was very close to the predicted value of the model, indicating that the regression model equation obtained by the experiment had good reliability and practicality.
Conclusions
With the pericarp of red-flesh pitaya as a material, anthocyanins in the pericarp was extracted by the ultrasound-assisted method, which confirmed that anthocyanins were contained in pitaya pericarp. Based on the single factor test, with the ultrasonic power, ethanol concentration, extraction temperature and extraction time as the influencing factors and the anthocyanin extraction amount as the response value, the response surface method was used to optimize the anthocyanin extraction process. The experimental results showed that the optimal extraction conditions were extraction time 2 h, ethanol concentration 60%, extraction temperature 49 ℃, and ultrasonic power 120 W, with which the extraction amount of anthocyanins in the pericarp of red-flesh pitaya reached 80 mg/100 g.
References
[1] XUE WD, WANG AG. Preliminary report on introduction and cultivation of pitaya in Taiwan[J]. South China Fruits, 2003, 32(2): 34-35. (in Chinese)
[2] FABIOLA P, JOS JB, ALEJANDRO C. Landscape management and domestication of Stenocereus pruinosus (Cactaceae) in the Tehuacán valley: human guided selection and gene flow[J]. Journal of Ethnobiology and Ethnomedicine, 2012(8): 32.
[3] YEN MW. Effects of heat, pH, antioxidant, agitation and light on betacyanin stability using red-fleshed dragon fruit (Hylocereus polyrhizus) juice and concentrate as models[J]. Journal of Food Science &Technology, 2015, 52(5): 3086-3092.
[4] ZHAI SP. Development status and countermeasures of pitaya industry in Suixi County[J]. South China Agriculture,2018,12(36): 89-90. (in Chinese)
[5] ZHANG FP. Nutritional health care effect and development of pitaya fruit[J]. Food Research and Development, 2002, 23(3): 49-50. (in Chinese)
[6] LI HL, LIU KD, YUAN CC, et al. Optimization of Extraction Technology of red-flesh pitaya pericarp Pigments and Its Antioxidant Activity[J]. Food and Fermentation Industries, 2014, 40(12): 203 -209. (in Chinese)
[7] HE YQ, SONG XY, LIU BL, et al. Effects of different drying methods on physicochemical qualities of the pitaya pericarp[J]. Food and Fermentation Industries, 2019, 45(2): 159-165. (in Chinese)
[8] JIANG B. Research progress of pitaya pigments[J]. Food Engineering, 2015(4): 6-10. (in Chinese)
[9] WANG MX, XIONG JW, HE LY, et al. Research progress of red pigments in pitaya[J]. Grain Science and Technology and Economy, 2016, 41(6): 65-68. (in Chinese)
[10] ZHAO ZZ. Optimization of extraction technology of red-flesh pitaya pigments and analysis of its chemical composition[D]. Fuzhou: Fujian Agriculture and Forestry University, 2012. (in Chinese)
[11] LIU XL, XU SY, WANG Z. Identification of the basic properties and structure of pitaya pigments[J]. Journal of Jiangnan University, 2003, 22(3): 62-66. (in Chinese)
[12] YUAN YF, ZHAO ZZ, WANG W, et al. Separation, purification and HPLC-MS analysis of the peel pigments of red pulp pitaya[J]. Journal of Fujian Agriculture and forestry University: natural science edition, 2013, 42(6): 589-592. (in Chinese)
[13] YANG HY, HUANG KS. Study on extraction technology and properties of pitaya red pigment[J]. Anhui Agricultural Science Bulletin, 2009, 15(3): 151-152. (in Chinese)
[14] MA BX, PAN T, REN ZQ, et al. Study on the extraction technology of anthocyanins from pitaya pericarp[J]. Beijing Agriculture, 2013(4): 213-215. (in Chinese)
[15] HU WR, WANG JP, SU H, et al. Optimization of enzymatic extraction of anthocyanidins from fruit pericarp of pitaya by response surface methodology[J]. Guangdong Agricultural Sciences, 2013, 22(20): 97-100. (in Chinese)
[16] YONG PH, JAE HC, EUN H. Purple sweet potato anthocyanins attenuate hepatic lipid accumulation through activating adenosine monophosphate-activated protein kinase in human HepG2 cells and obese mice [J]. Nutrition Research, 2011, 31(21): 896-906.
[17] ZHONG LL, TU D, YANG Y, et al. Research progress on physiological function of anthocyanins and their application prospects[J]. Current Biotechnology, 2013, 3(5): 346-352. (in Chinese)
[18] MA Y, ZHANG Z, WANG D, et al. Study on the effect of anthocyanin beverage on alleviating human visual fatigue[J]. Food Science and Technology, 2015, 40(2): 104-107. (in Chinese)
[19] TIAN XQ, DONG YP, ZHAO DJ. Study on optimization of black rice anthocyanin extraction process and its stability[J]. China Brewing, 2016, 35(6): 161-164. (in Chinese)
[20] RYU D, KOH E. Application of response surface methodology to acidified water extraction of black soybeans for improving anthocyanin content, total phenols content and antioxidant activity [J]. Food Chemistry, 2018, 43(18): 260-266.
[21] HUO DQ, WANG HB, SONG XX, et al. Optimization of fermentation process of raw kiwi wine by response surface methodology[J]. Science and Technology of Food Industry, 2013, 34(9):219-223. (in Chinese)
[22] WANG HP, HUANG HS, GUO L. Optimization of fermentation conditions of cherry wine by response surface method[J]. China Brewing, 2011, 30(9): 75-79. (in Chinese)
[23] LUO K, HUANG XF, ZHOU YF, et al. Optimization of multi-enzymatic extraction of polysacchardes from Cardamine hupingshanensis and their antioxidant activity[J]. Food Science, 2017, 38(4):237-242. (in Chinese)
[24] PENG B, LEI Y, ZHAO H, et al. Response surface methodology for optimization of fermentation process parameters for improving apple wine quality[J]. Journal of Food Science & Technology, 2015, 52(11): 7513-7518.
- 农业生物技术(英文版)的其它文章
- Investigation on Agronomic Characters of Dwarf Mutant 778 in Broomcorn Millet (Panicum miliaceum L.) and Analysis of Its Sensitivity to GA
- Construction of Technology System on Development and Repropagation in Vitro of Several Cultivars in Pear
- Construction of Camellia oleifera Cultivation Standardization System
- Nutrients Determination in Nuts from Different Torreya grandis Cultivars
- Photosynthetic Physiological Response to Drought Stress of Populus euphratica at Different Ages in Minqin
- Effects of UV-B Radiation on the Activity of Antioxidants in Flue-cured Tobacco Leaves

