
Quantitatively estimate the components of natural runoff and identify the impacting factors in a snow-fed river basin of China
2020-07-01 08:13JiaQinJinKuiWuTianDingHanQiuDongZhao
Jia Qin ,JinKui Wu ,TianDing Han ,QiuDong Zhao
1.Key Laboratory of Eco-hydrology Inland River Basin,Northwest Institute of Eco-Environment and Resources,Chinese Academy of Sciences,Lanzhou,Gansu 730000,China
2.State Key Laboratory of Cryospheric Sciences,Northwest Institute of Eco-Environment and Resources,Chinese Academy of Sciences,Lanzhou,Gansu 730000,China
ABSTRACT Snowmelt water is an essential runoff source of some alpine rivers in China.This study selected the Upper Burqin River(UBR),a typical snow-fed river,to quantitatively assess the runoff contributions of different components,as well as the causes of runoff variations under the background of cryosphere change and global warming.Based on the spatial-temporal distributions of snow and glaciers during a year,as well as the altitudinal variations of 0°C isotherm,the high flow hydro‐graphs in UBR was separated into two parts:seasonal snowmelt flood of lower altitudes(<3,000 m)and glacier-snow melt flow in high altitudes(3,000−4,296 m).The daily baseflow hydrograph of UBR was separated by the digital filtering tech‐nique.It is concluded that the contributions of snowmelt flow,glacier melt flow,and baseflow(includes rainfall runoff component)to total annual flow volumes are 27.2%(±2.7%),8.5%(±1.7%),and 64.3%(±3.0%),respectively.The speed of air temperature rise in spring may be the controlling factor for monthly snowmelt flow distributions in the snow-fed riv‐er.The volume of snowmelt was determined by spring precipitation(SP)and previous winter's precipitation(PWP).The PWP changes can explain 43.7%of snowmelt changes during 1981−2010 in UBR,while snowmelt change in 1957−1980 is more impacted by SP.The determining factor of snowmelt variation was changed from SP to PAP during the recent de‐cades.Precipitation in current year,excluding previous year's rainfall and snowfall,can only explain 32%−70%of the vari‐ability in total runoff.
Keywords:snowmelt process;runoff separation;precipitation;air temperature;snow-fed river
1 Introduction
Most large rivers in Northwest China originate from alpine regions,which supply essential water re‐sources for living,agricultural and ecological pur‐poses in lower altitudes(Aeschbacher et al.,2005;Smith-Adao et al.,2011;Ding et al.,2017).Runoff of these rivers is always recharged by one or several components of rainfall,glacier melting water,snow‐melt water, and groundwater.A large part of the Earth's land surface receives precipitation in the form of snow.Rivers in Altai and Tacheng districts of Chi‐na are mainly snow-fed pattern(Yang,1991;Nuerlan et al.,2014).Snowmelt water can supply large amounts of discharge for the alpine rivers there.In addition,many other aspects,such as migratory fish,ecosys‐tems and cultivation practices,have evolved to bene‐fit from the snow-fed flow(Arheimer et al.,2017).
The snow-fed rivers are characterized by low flow during the winter followed by a high spring peak flood event(Kure et al.,2013;Sharma et al.,2013).The temporal and spatial changes of snowfall and its volume can significantly influence runoff-generated processes and seasonal runoff distributions(Ghanbar‐pour,2007;Wang et al.,2015).Snowmelt water of a specific alpine watershed is hard to directly and accu‐rately measure,and is always calculated by the ener‐gy-water balance equation,runoff separation meth‐ods,as well as hydrological modelling approach(Li‐ang,1994;Lohmann et al.,1998;Qin et al.,2013,2017;Zhao et al.,2019).The scarce measured hydro‐logical and meteorological data in alpine regions causes large difficulties and uncertainty in water bal‐ance simulations. Separating runoff based on the flow hydrographs comparatively can be a more appli‐cable and effective method of runoff-component esti‐mation,including snowmelt water(Qin et al.,2017).
Alpine runoff,as well as glacier melt water and snow melt water are sensitively reponded to cryo‐sphere change and global warming(Ding et al.,2017;Zhang et al.,2019;Zhao et al.,2019).Some existing studies concluded that changes of temperature and precipitation in recent decades affected the timing and volume of natural stream-flow in snow-fed rivers(Shen et al.,2007;Chen et al.,2015).There has been an early trend onset in snow melting caused by tem‐perature rise since the 1960s(Nuerlan et al.,2014).Several researchers have pointed out that the annual peak flood event may be less distinct and even disap‐pear in some snow-dominated areas by the end of this century because of global warming(Molini et al.,2011;Godsey et al.,2013).Arheimer et al.(2017)even proposed that regulation of snow-fed rivers af‐fects flow regimes more than climate change on a global scale. The existing studies effectively en‐hanced our understandings about the effect,changes and their causes of stream-flow in snow-fed rivers.
This study tried to quantitatively separate the com‐ponents of natural runoff based on the altitudinal vari‐ations of 0°C isotherm and the annual hydrograph in a typical snow-fed river, the Upper Burqin River(UBR).Here,we developed the theory and method of alpine-hydrology study by separating snowmelt and identifying impacting factors of different river runoff components in alpine snow-fed rivers.
2 Study areas
The Burqin River originates from Friendship Peak of the Altai Mountains,and it is a major tributary of Irtysh River.The upper reaches of the Burqin River are located at 86°54′−88°35′E,47°56′−49°11′N(Fig‐ure 1),and the watershed covers an area of 8,442 km2,about 14.8%of the Irtysh River Basin's area.Water re‐sources in the UBR are plentiful.The elevation of the UBR basin ranges from 650 m to 4,296 m,and most areas of the basin(about 91.8%)are in the elevation band of 1,000−3,000 m(Figure 1).The study area is in the northern temperate zone and has a cold conti‐nental climate,with annual average precipitation of 261.6 mm and an average air temperature of 2.8°C.In winter,snow covers almost the whole river basin.There exists some glaciers in high altitudes,and ap‐proximately 7%of the river runoff on average is re‐charged by glacier meltwater in UBR(Yang,1991).Nearly 65%of the study area is covered by grassland and the second largest land-use type is forest,with a coverage rate of approximately 20%.
3 Data and methods
3.1 Data
In this study,precipitation,air temperature,runoff,snow cover,glacier,as well as landscape data were used.Monthly precipitation and air temperature data during 1957 −2010 were gained from the controlled hydrological station of the UBR Basin(Qunkule Sta‐tion,1957 −2003)and National Meteorological Sta‐tion of China(Burqin Station,2000 −2010),located 86.52°E,47.42°N near the Qunkule Station.Daily and monthly runoff data were obtained from the Qunkule hydrological Station.Daily runoff of each year was used into wet,dry and normal year respec‐tively.The proportions of monthly runoff to total an‐nual runoff in each decade from 1950s to 2010s also were analysed.In addition,snow cover datasets were obtained from the National Snow&Ice Data Centre(nsidc.org/data).The 8 days and monthly snow cover data during 2000−2010 are gained from Terra MODIS data,to analyse in detail the snow melt process in the study area.The DEM,with a resolution of 3 arc-sec‐ond,was derived from the SRTM digital elevation model(http://srtm.csi.cgiar.org/Index.asp)(Jarvis et al.,2008).The landscape distribution of the UBR ba‐sin,mainly land-use data,were provided by the Envi‐ronmental and Ecological Science Data Centre for West China,National Natural Science Foundation of China(http://westdc.westgis.ac.cn/)(Ran et al.,2010).Glacier data were derived from the Chinese Glacier In‐ventory Dataset(http://wdcdgg.westgis.ac.cn/)(Li et al.,2008).All data used in the study were checked and assessed by the SPSS software,and they are credi‐ble.Some outliers,such as annual runoff and precipi‐tation data in 1968,1979,1987 and 2003 were exclud‐ed in the analysis.
3.2 Methods
In an attempt to analyse snowmelt runoff variation and its reasons,annual hydrographs of UBR was sepa‐rated by a digital filtering technique and process anal‐ysis of snow and ice temporal-spatial variation.Based on snowmelt runoff and total runoff change on season‐al and inter-annual time scales,the causes of runoff change in snow-fed rivers were analysed in detail.The impact of climate factors on snowmelt water and total runoff in the typical snow-fed river were as‐sessed by the coefficient of determination,calculated by correlation analysis.

Figure 1 The position of the UBR Basin and proportions of the area in different elevation bands to total area
3.2.1 Runoff separation
There are always two precipitation peaks in the UBR Basin.The November-January peak represents snowfall,and May-September peak represents rainfall in summer half of the year(Yang,1991).Rainfall in the study area is scarce,with a total value less than 130 mm from May to September on average.Rainfall in each month of May-September ranges from 20.0 to 31.8 mm during 1957−2010,and there are few tor‐rential thunderstorms,which could result in ephemer‐al flood flow,and a large amount of evapotranspira‐tion in the basin.The comprehensive effects make rainwater a minor contributor to river runoff in UBR.In this study,it is assumed that the river flow in UBR is recharged by baseflow(Qb),snowmelt runoff(Qs),and glacier melt runoff(Qg).Though rainwater is hard to generate slopes-runoff in UBR,it possibly contrib‐utes to Qb.Thus,the Qbof UBR includes the rainwa‐ter component.
The daily value of Qbis calculated by a digital fil‐tering technique(Nathan and McMahon,1990),based on daily river runoff data of UBR.We adopted the first forward filtering and the filtering coefficient(β)was set to 0.85 according to existing studies in the ba‐sins of Northern Xinjiang(Zhang et al.,2015;Wang et al.,2017).The daily Qbwas calculated by the Equa‐tions(1)and(2):

where qtand qt−1are the rapid response runoff filtered in time t and t−1,the unit:m3/s;β is the filtering pa‐rameter,which affects the attenuation of baseflow;Qtand Qt−1is the runoff at time t and t−1,the unit:m3/s.Qbtis the baseflow at time t,the unit of t is d(day).
In winter,with the temperature below 0°C,no runoff is recharged by meltwater,so Qbshould equal to Qt(total discharge).If it is found that Qb≥Qtthen Qb=Qtand Qs=Qg=0.With the temperature rising,seasonal snow in the basin begins to melt from lower altitudes to higher altitudes.A method about the quan‐titative estimation of snow coverage fractions(SCF)for a river basin was described by Mukhopadhyay(2013).Using this method,monthly SCF and the cov‐erage variation of seasonal snow and ice(CVSS)in the UBR Basin can be obtained.The start and end time of seasonal snow melting in a year can be analysed ac‐cording to monthly SCF variations.We also determined the elevation bands of seasonal snow and glacier dis‐tributed in the UBR Basin based on CVSS and DEM data.The monthly altitudinal variations of freezing ele‐vations also can be ascertained according to the ob‐served vertical lapse rate of air temperature in UBR,and the time of sub-zero temperatures regions receding and descending can be confirmed.Then,we separated high flow of the summer half year into two flow re‐gimes:high flow recharged only by seasonal snowmelt(Stage H1);high flow recharged by meltwater of gla‐ciers and perennial snow(Stage H2).For stage H1,no glacier melt,and Qs=Qt−Qb.For stage H2,Qs+Qg=Qt−Qb.In stage H2,winter snow cover on the glacier surface and adjacent areas will firstly melt,and then the glaciers will melt after the removal of surface snow.Based on summer hydrographs,the period of peak flow recharged by both seasonal snow and glacier can be obtained.We assumed that the proportions of snowmelt to total melt flow in stage H2 are changing from 100%to 0.Meantime,the proportions of glacier meltwater to total melt flow are changing from 0 to 100%.Based on the aforementioned methods,the an‐nual hydrograph can be separated,and the monthly and annual proportions of three different components to total discharge in UBR can be ascertained.
4 Results
4.1 Temporal-spatial variation of snow coverage in UBR
Figure 2a shows monthly SCF variations in UBR from March 2000 to December 2010.The seasonal snows begin to accumulate in August-September,and reach maximum accumulation in winter(December−February) (Figure 2a). Approximate 100% of the study region is covered by snow and ice in the winter‐time of a year.They start to recess from March,and most melt away by the end of June.Considering the snowmelt spatial-temprol process(Figures 2a,3),and the elevation bands of the UBR basin(Figure 1),com‐bined with the altitudinal variation of 0°C isotherm(Figure 2b),it can be judged that seasonal snows are mainly distributed in elevations<3,000 m in the UBR basin.The regions of elevation band 3,000−4,296 m mostly cover glaciers, perennial snow and winter snows,which will start to melt in June after tempera‐tures above 0°C(Figure 2b).
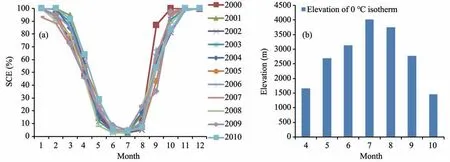
Figure 2 Monthly variations of snow coverage fractions(SCF)during 2000−2010(a)and altitudinal variation of 0°C isotherm(b)in different months in the UBR Basin
4.2 Quantitatively assess the contributions of different flow sources to total runoff
According to the analysis above,two stages of the high flow regimes in UBR can be determined:March−June(H1)and June−September(H2).Based on varia‐tions of monthly 0°C isotherm,SCF and hydrographs in UBR,it is ascertained that flood peak in early H2 is recharged by both seasonal snow and glacier in high altitudes.The snow-fed effect gradually disappears and it is replaced by glacier melt water during the middle and late H2 stage.To assess the different con‐tributions of three flow sources to the total river run‐off,daily hydrographs of UBR in 2001(wet year),2006(common year)and 2008(dry year)were sepa‐rately analysed.Based on runoff separation methods described above, the percentages of contributions made by three flow sources to the total volumes of an‐nual discharge were calculated(Figure 4).Baseflow is the largest river runoff component,and then is the snowmelt water and glacier water.27.2%(±2.7%),8.5%(±1.7%),and 64.3%(±3.0%)of the total flow in the study area are recharged by snowmelt water,gla‐cier water,and baseflow,respectively.

Figure 3 Spatial changes of snow-cover melt process from April to June in 2003 in the UBR watershed
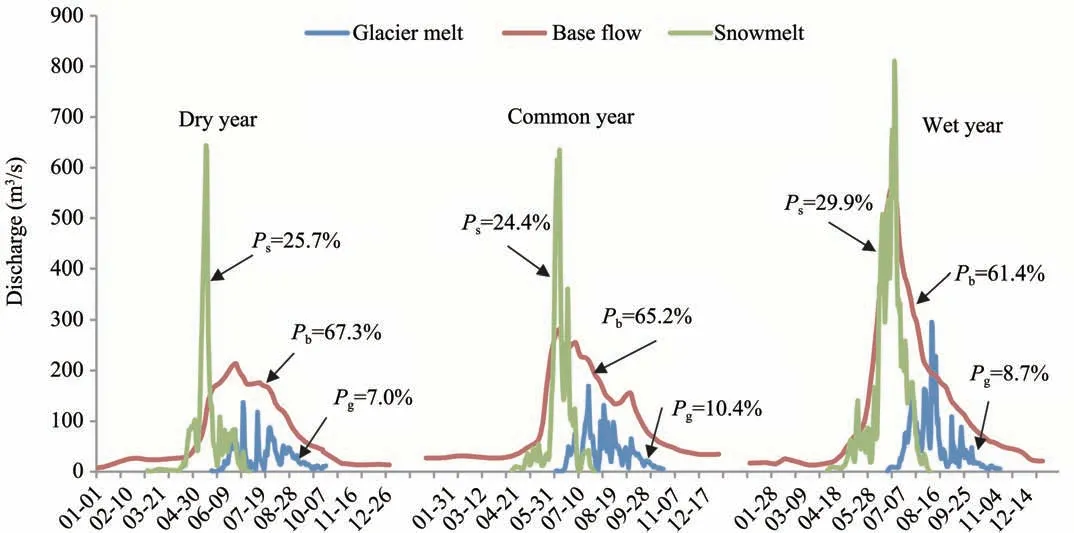
Figure 4 Daily processes of baseflow,snowmelt,and glacier melt flow in UBR.Pb,Ps and Pg represent the corresponding proportions of baseflow,snowmelt flow,and glacier melt flow to total volumes of annual discharge,respectively
4.3 Characteristics and causes of monthly snowmelt and baseflow changing
Though annual precipitation and runoff in the wet year(2001)are nearly two times larger than those in the drought year(2008)(Figure 5),the contributions of each water source to total runoff all have very small change ratios(<20%).Snowmelt flow distribu‐tion in the dry year is very different from that in the wet year.The maximum monthly snowmelt was grad‐ually shifting from June in 2001 to May of 2008(Fig‐ures 4,5).The proportion of snowmelt flow in May was decreasing from a dry year to a wet year,and that in June was correspondingly increasing. Monthly precipitation has no visible relations with snowmelt and baseflow change in the dry year and the wet year,presented in Figure 5.Through comparing tem‐perature rising process from February to May in each year,we found that the rate of temperature rise in 2001 is 5.7°C per month,which is obviously small‐er than that in 2008(8.3°C/month).The rate of tem‐perature rise in spring may be the controlling factor for monthly snowmelt distributions in the snow-fed river.With increasing speed of temperature rise in spring,earlier snowmelt flow peak arrives during a year.

Figure 5 Monthly variations of baseflow,snowmelt,precipitation and temperature in dry year(2008),common year(2006)and wet year(2001),respectively.Primary y-axis represents the proportions of baseflow,snowmelt,and precipitation to their respective total amount in each year.Secondary y-axis represents monthly temperature.R-annual runoff,Pt-annual precipitation,Tave represents annual mean temperature
In an attempt to find the reason for snowmelt vol‐ume variation in UBR,we plotted annual snowmelt against spring precipitation(SP),the previous winter's precipitation(PWP),and the previous autumn's pre‐cipitation(PAP)(Figure 6).According to Figure 7,snowmelt is concentrated in May−June,and contrib‐utes 48.3%−53.4%of total river runoff in this period.Furthermore,Pshas approximate value in the drought and the wet year,and therefore runoff in May −June was selected as a proxy for snowmelt changing of each year.Using accumulative anomaly analysis(Wang et al.,2012),1980 is an inflexion point of snowmelt and total runoff variations(1957−2010)in UBR,and data series were divided into two periods:1957−1980 and 1981−2010.In 1957−1976,snowmelt was significant‐ly positively impacted by SP,PWP,and PAP,with their correlation coefficients(R2)changing from 0.24 to 0.46(significance level of 95%).The impact of PAP on snowmelt was not significant during 1981 −2010.The previous winter snowfall contributed more impact during 1981 −2010 than during 1957 −1980.The PWP can explain 43.7%of snowmelt changes dur‐ing 1981−2010.It also can be determined that snow‐melt in 1957−1980 is more impacted by SP,compared to that in 1981−2010.The determining factor of snow‐melt variation changed from SP to PAP after 1980.

Figure 6 Linear regression plots of precipitation and snowmelt(filled circles)in the UBR Basin
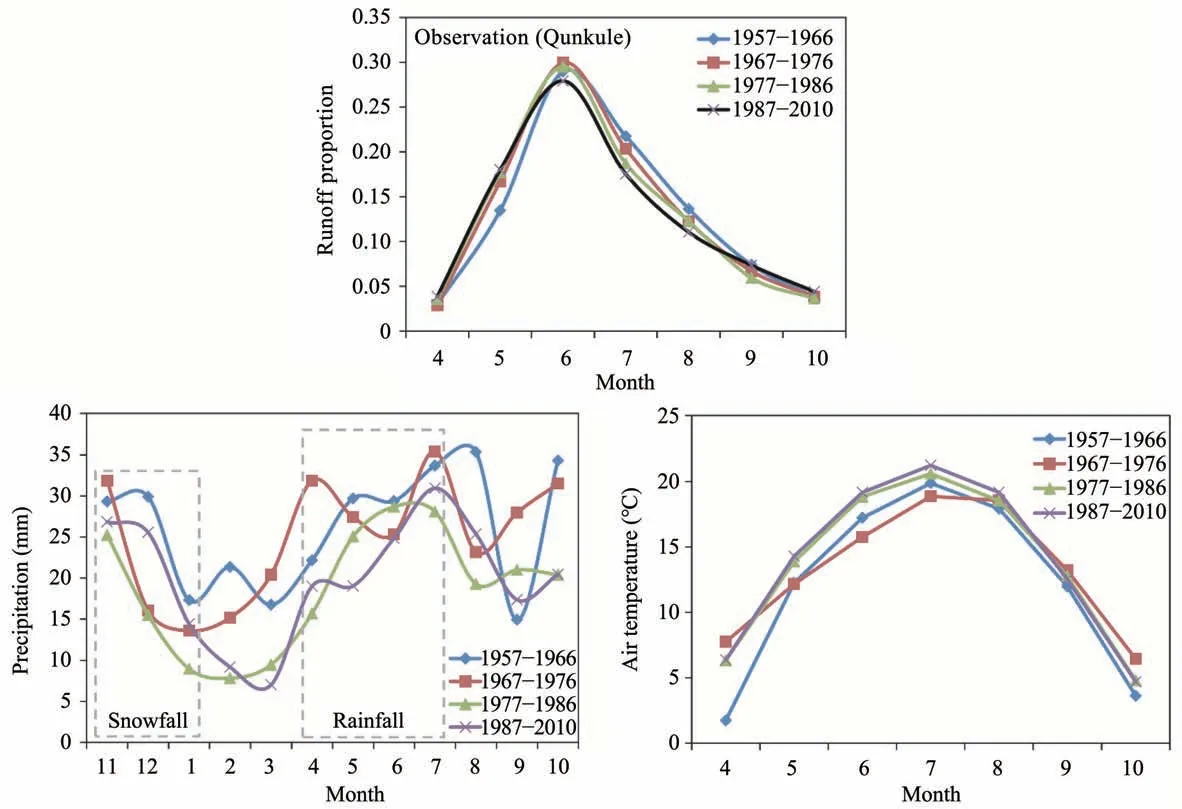
Figure 7 Precipitation,temeprature,and proportions of monthly observed runoff to total volumes of annual runoff in different decades of 1957−2010 in the study area
4.4 Reasons for total runoff variation in the snow-fed river
The proportions of runoff in each month during April−October to the total annual runoff in UBR were calculated and presented in Figure 7.The runoff peak arrived earlier than the maximum monthly precipita‐tion(in July)in the typical snow-fed river,based on historical runoff and precipitation data.In addition,monthly runoff changed significantly in different de‐cades of 1957−2010(Figure 7).Runoff proportions in spring were gradually increasing,but decreasing in summer since 1957(Figure 7).The spring flood pro‐cesses in the snow-fed river were gradually shifting to an earlier time of a year during 1957−2010(Figure 7).The mean temperature during April−October was grad‐ually rising since 1957(except the period 1967−1976),which was very similar to the runoff flood forming process(April to June)and is opposite to changes of flood recession process(July to October)(Figure 7).To this point,the advance of the flood process during a year is mainly impacted by increasing temperatures.
Precipitation is a main runoff source of river dis‐charge.In order to find a precipitation metric that could account for the previous year's rainwater stor‐age and explain inter-annual runoff variability in re‐cent decades,we plotted annual runoff against precipi‐tation(P(t)),previous year's rainfall(Rain(t−1)),and previous year's winter snowfall(Snow(t −1))(Figure 8).According to Figure 8,the combination of P(t),Rain(t−1),and Snow(t−1)account for 41%−82%of the variability in annual runoff during 1957 −2010,while P(t)can only explain 32%−70%of the variabili‐ty in annual runoff.It can be concluded that not only previous year's winter snowfall,but also antecedent water storage caused by previous year's rainfall have effective impacts on annual runoff in snow-fed rivers.In addition,the correlation coefficients between each precipitation combination and annual runoff were de‐creasing from 1957−1980 to 1981−2010(Figure 8).This means that contribution of precipitation to annu‐al runoff variations had been reduced,and other fac‐tors were playing a more important role on runoff change since 1980 in UBR.

Figure 8 Correlations between annual runoff(anomaly value)and precipitation(P(t))combined with previous year's rainfall(Rain(t−1))or snowfall(Snow(t−1))in the UBR Basin.t is water year.The filled circles are effective data,and the blocks(in red)represent outliers in different periods
5 Discussions
5.1 Contributions of snowmelt to total river flow in UBR compared with other regions
According to Biswajit and Asif(2014),the contri‐bution rate of snowmelt to annual river flow is 38%−50%in the Upper Indus Basin(265,598 km2in area),a snow-fed river in southern Eurasia.In addition,about 45%of the annual flow of the Kelan River Ba‐sin(1,655 km2),near the UBR Basin,is derived from the melting of snow(Shen et al.,2007).Snowmelt flow in the two basins(with different size)of the midlatitudes both account for larger proportions of annual flow than that in the UBR Basin(24%−30%).In addi‐tion,snowfall quantity in winter/early spring dominat‐ed the spring flood volumes in snow-fed rivers.In the Upper Indus basins,the precipitation peak(snowfall)occurs in February−April during a year,and the Kelan River Basin has larger than 60%of annual precipita‐tion(620 mm)falling in winter as snow(Shen et al.,2007;Biswajit and Asif,2014).Scarce quantity and small proportions of winter snowfall lead to a fewer contribution of snowmelt to annual flow in UBR.The winter water storage as snow and its subsequent re‐lease upon melting(warmer air temperatures in May)are one of the major factors that influence the snowfed river discharge and associated extremely large floods events in spring/early summer of middle lati‐tudes(Cao et al.,2002;Ding et al.,2017).This is particularly true for the other river basins of Eur‐asia,such as the Ob and Lena river basins(Yang et al.,2003).
5.2 Determining factors of runoff variation in snow-fed rivers
According to the analysis above,snowmelt and to‐tal flow in UBR were significantly influenced by pre‐vious year's rainfall and snowfall.A combination of above-average precipitation, plentifully antecedent snowfall,and a large amount of storage water resulted from previous summer's rainfall is required to gener‐ate large volumes of runoff in snow-fed rivers.It is obvious that plentifully antecedent snowfall in past spring and winter is essential to large snowmelt water generation,while a quantity of rainfall can effectively enhance next year's baseflow production.The factors controlling runoff generation are in many ways simi‐lar to those rivers recharged by other water sources in cold-climate regions(Spence,2006;Woo and Guan,2006;Helbig et al.,2013;Svetlana et al.,2017;Chen et al.,2018).To this point,consideration of rainfall and snowfall in previous water year is essential for ac‐curately analysing and simulating river runoff.Spring runoff peak,even total runoff in a year could be influ‐enced by snowmelt water and previous year's water storage surplus.This lag effect between antecedent precipitation and river runoff should be seriously con‐sidered in water balance simulation and hydrological analysis.
In recent years,more and more warm winters oc‐curred in the Northern Hemisphere,especially in Asia(Qin et al.,2020),and they are potentially at risk of converting from a snow-dominated to a rain-dominat‐ed winter precipitation regime under a climate-warm‐ing scenario(Nolin and Daly,2006;Räisänen and Eklund,2012).In this case,the impact of winter pre‐cipitation on snow-fed runoff distributions during a year will likely be changed as the climate warms,and springtime flood perhaps will be dominated by spring precipitation in snow-fed rivers.
5.3 Possible impacts of landscape and regulation on runoff change
In this study,we analysed the impacts of climate change on natural river runoff.Landscape changes al‐so have significant impacts on runoff distributions during a year. In general, forest and brushwood strongly reduces the surface albedo under snow-cov‐ered conditions,and the springtime surface cooling is stronger,which leads to obvious snowmelt peak delay in spring(Douville and Royer,1996;Ding et al.,2017).The role of the forest and brushwood is mostly that of a"storeroom".In addition,landscapes,such as forest,grassland and brushwood,play an important role as a water source field,and they also have a wa‐ter conservation function(Qin et al.,2013).In fact,human regulation is also a significantly controlled fac‐tor for runoff flow.Hydropower regulation is a key driver of the flow regime change in snow-dominated regions and is more important than future climate change(Arheimer et al.,2017).The natural river re‐gime in snowy regions has low flow when snow is stored and a pronounced peak flow when snow is melting.Global warming and hydropower regulation could change this temporal pattern similarly,causing less difference in river flow between seasons.
6 Conclusions
In this study,a new method,based on the altitudi‐nal variations of 0°C isotherm,was proposed to sepa‐rate the flow hydrographs,and estimate the different components of runoff in a specific snow-fed river,the UBR watershed.According to seasonal variations of snow cover in different elevation bands,the UBR wa‐tershed was separated into two parts for further runoff separation:lower altitude region with seasonal snows mainly distributed at elevations<3,000 m,and high altitude region covered by snow and glaciers at an ele‐vation band of 3,000 −4,296 m.Combed with base‐flow separation and snow and glacier melting process‐es,the components of runoff in the UBR were estimat‐ed.The 24.4%−29.9%of the total flow is recharged by snowmelt water,and more than 60%of the total flow is supplied by baseflow in UBR.This method has some reference and can be extended to other al‐pine snow-fed rivers,especially in regions that lack measurements.
Furthermore, we recognised that the speed of temperature rise in spring was the controlling factor for monthly snowmelt distributions in the snow-fed river.With an increased speed of temperature rise in spring,earlier snowmelt flow peak arrives during a year.The quantity of snowmelt was determined by SP and PWP.The PWP can explain 43.7%of snow‐melt changes during 1981−2010 in UBR,while snow‐melt in 1957−1980 is more impacted by SP.The de‐termining factor of snowmelt variation was changed from SP to PAP during the recent decades.In addi‐tion, the contributions of precipitation to annual runoff variations have been reduced since the 1980s in UBR.
Acknowledgments:
This work was supported by the National Natural Sci‐ence Foundation of China (Nos. 41877156,41730751,41771040,41771084),and the Internation‐al Science&Technology Cooperation Program of China(No.2018YFE010010002).
 Sciences in Cold and Arid Regions2020年3期
- Sciences in Cold and Arid Regions的其它文章
- A modified numerical model for moisture-salt transport in unsaturated sandy soil under evaporation
- Editors-in-Chief Yuanming Lai and Ximing Cai
- Numerical simulations on cutting of frozen soil using HJC Model
- Mapping the dynamic degree of aeolian desertification in the Shiyang River Basin from 1975 to 2010
- A meta-analysis of the impacts of forest logging on soil CO2 efflux
- Fast genetic mapping in barley:case studies of cuticle mutants using RNA-sequencing