
A modified numerical model for moisture-salt transport in unsaturated sandy soil under evaporation
2020-07-01 08:13WeiWenYuanMingLaiZheMinYou
Wei Wen ,YuanMing Lai *,ZheMin You
1.State Key Laboratory of Frozen Soil Engineering,Northwest Institute of Eco-Environment and Resources,Chinese Academy of Sciences,Lanzhou,Gansu 730000,China
2.University of Chinese Academy of Sciences,Beijing 100049,China
ABSTRACT Soil salinization,caused by salt migration and accumulation underneath the soil surface,will corrode structures.To ana‐lyze the moisture-salt migration and salt precipitation in soil under evaporation conditions,a mathematical model consist‐ing of a series of theoretical equations is briefly presented.The filling effect of precipitated salts on tortuosity factor and evaporation rate are taken into account in relevant equations.Besides,a transition equation to link the solute transport equation before and after salt precipitation is proposed.Meanwhile,a new relative humidity equation deduced from Pitzer ions model is used to modify the vapor transport flux equation.The results show that the calculated values are in good agreement with the published experimental data,especially for the simulation of volume water content and evaporation rate of Toyoura sand,which confirm the reliability and applicability of the proposed model.
Keywords:moisture-salt transport;precipitated salt;Pitzer ions model;relative humidity;evaporation rate
1 Introduction
The soil salinization is widespread in arid and semi-arid regions (Van-Camp et al., 2004; Kar‐pachevskii et al.,2008).Salt accumulation often occurs within a certain depth near the soil surface(Figure 1).Suffering from the continuous salt corro‐sion and weathering,the service life of structures will be shortened(Benavente et al.,2007;Cardell et al.,2010;Shao,2012;Wang,2014;Kang et al.,2016;Wan,2017).Until now,a large number of studies have been carried out on the migration and distribu‐tion of moisture-salt in soil,and the theoretical solu‐tions gave fair agreement with the experimental data(Nassar and Horton,1999;Zhang et al.,2014;Jamb‐hekar et al.,2015;Nachshon and Weisbrod,2015).
For moisture flux equation,Noggle(1985)pro‐posed a formula that can calculate the pores relative humidity generated by salt solutions;the relevant ef‐fective osmotic coefficient was calculated by Stokes equation(Robinson and Stokes,1955),then the os‐motic pressure of the solution was obtained by Low's Formula based on Van't Hoff Equation(Low,1955).Combined the relative humidity and the osmotic pres‐sure with the Fick's law and the Darcy equation,the moisture flux equation was obtained.For salt precipi‐tation or crystallization,Gran et al.(2011)proposed a mixture theory,which can predict the crystallization process well of solute in sand columns under evapora‐tion.With the precipitation of salt,the dynamic vis‐cosity,density and chemical potential of liquid water changed(Kestin et al.,1981;Voss and Provost,2002),which will affect the migration of liquid water in soil pores.Then the evaporation rate decreased dramatical‐ly(Gran et al.,2011;Nachshon and Weisbrod,2015).Meanwhile,the increasing condensed water will grad‐ually dissolve a portion of precipitated salts near evap‐oration front,which attracted extensive attention in re‐cent years(Yang et al.,2002;Espinosa et al.,2008).
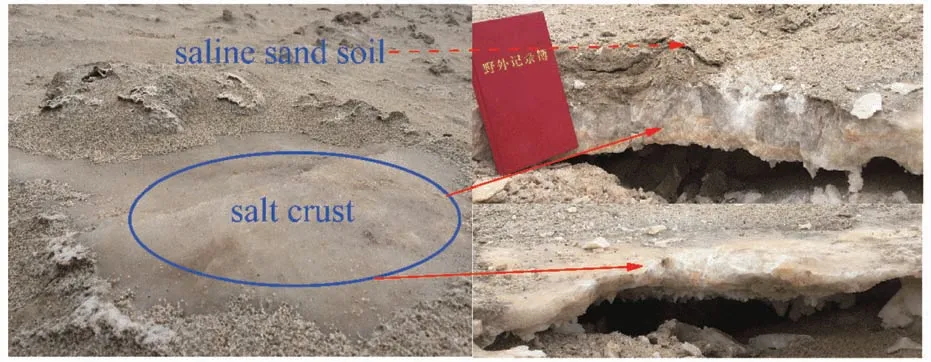
Figure 1 Salt layer containing soil in Qaidam Basin
Although lots of researches about moisture-salt migration have been carried out in sandy soils,some deficiencies still exist in application.Fitted equa‐tions more rather than Pitzer ions model for calculat‐ing the effective effect osmotic coefficient were used in literatures;besides,there is no reasonable equa‐tion to simulate the mass of precipitated salts and consider the effect of precipitated salts on evapora‐tion rate.Therefore,the Main contents of this paper include the following three points:Firstly,the fitted effective osmotic coefficient is replaced by the wide‐ly used Pitzer ions model.Secondly,the filling and barrier effect of precipitated salts on moisture trans‐portation are considered in relevant flux equations.Finally,the evaporation rate is deduced from the cap‐illary cross section area changing with the mass of precipitated salt.
2 Experiment procedure
The soil samples are Masa loamy sand and Toyou‐ra sand and the relevant particle size distribution can be referred to references.During preparation,the sand samples are compressed as uniformly as possible into an organic glass barrel 3.8 cm in diameter and 5.2 cm high with impermeable bottom.The bulk densities,porosities,saturated hydraulic conductivities,initial pressure heads,aerodynamic resistances,air relative humidity,room temperatures and solute concentra‐tions are all presented in Table 1.
3 Governing equations
Vapor and liquid water are two forms of water in unsaturated soil.The migration of moisture is affected by soil types,water content,temperature,salt types and solute concentration.Under the effects of those factors,the vapor and liquid water are interacted with each other.
3.1 Moisture transport
The osmotic potential is not taken into account in liquid water transport equation because the effect of salt sieve on liquid water transport is not obvious in sandy soil(Bear,1972).Therefore,the matric pres‐sure head and the gravity are the main driving forces of moisture migration.
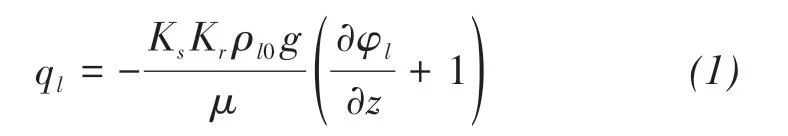
where ql(m/s)is the liquid water fluxes,Ks(m2)is the intrinsic permeability,Kris the relative permea‐bility,ρl0(kg/m3)is the densities of liquid water,g(m2/s)is the magnitude of the gravitational accelera‐tion,μ(kg/(m ⋅s))is the dynamic viscosity of liquid water,φl(m)is the pressure head,and z(m)is the ver‐tical coordinate.
It is assumed that the pore gas pressures at differ‐ent depths in soil are the same and equal to the atmo‐spheric pressure.Thus,the vapor flux equation can be expressed as(Philip and Vries,1957).
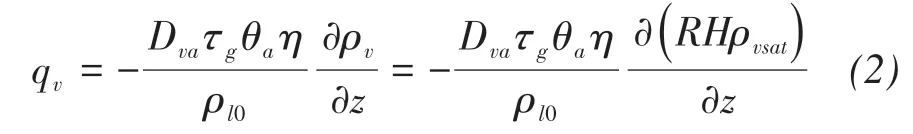
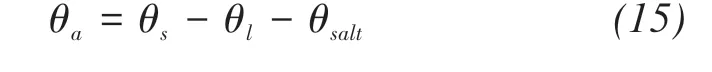
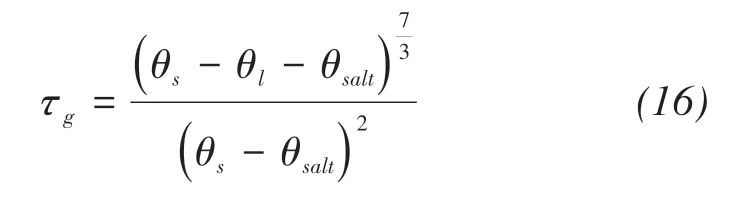
where qv(m/s)is the water vapor fluxes;Dva(m2/s)is the molecular diffusivity of water vapor in the air;τgis the tortuosity factor;θa(m3/m3)is the volumetric air content;η is an enhancement factor;ρv,ρvsat(kg/m3)are the densities of unsaturated and saturated vapor water,respectively;RH is the pores relative humidity(shown in Figure 3).
Based on the assumption that the vapor content is in equilibrium with the local liquid water content(Philip and Vries,1957)and the fact that the mass of vapor is negligible compared with liquid water,the storage change of local vapor content is not consid‐ered in governing equation(Zhang et al.,2014).
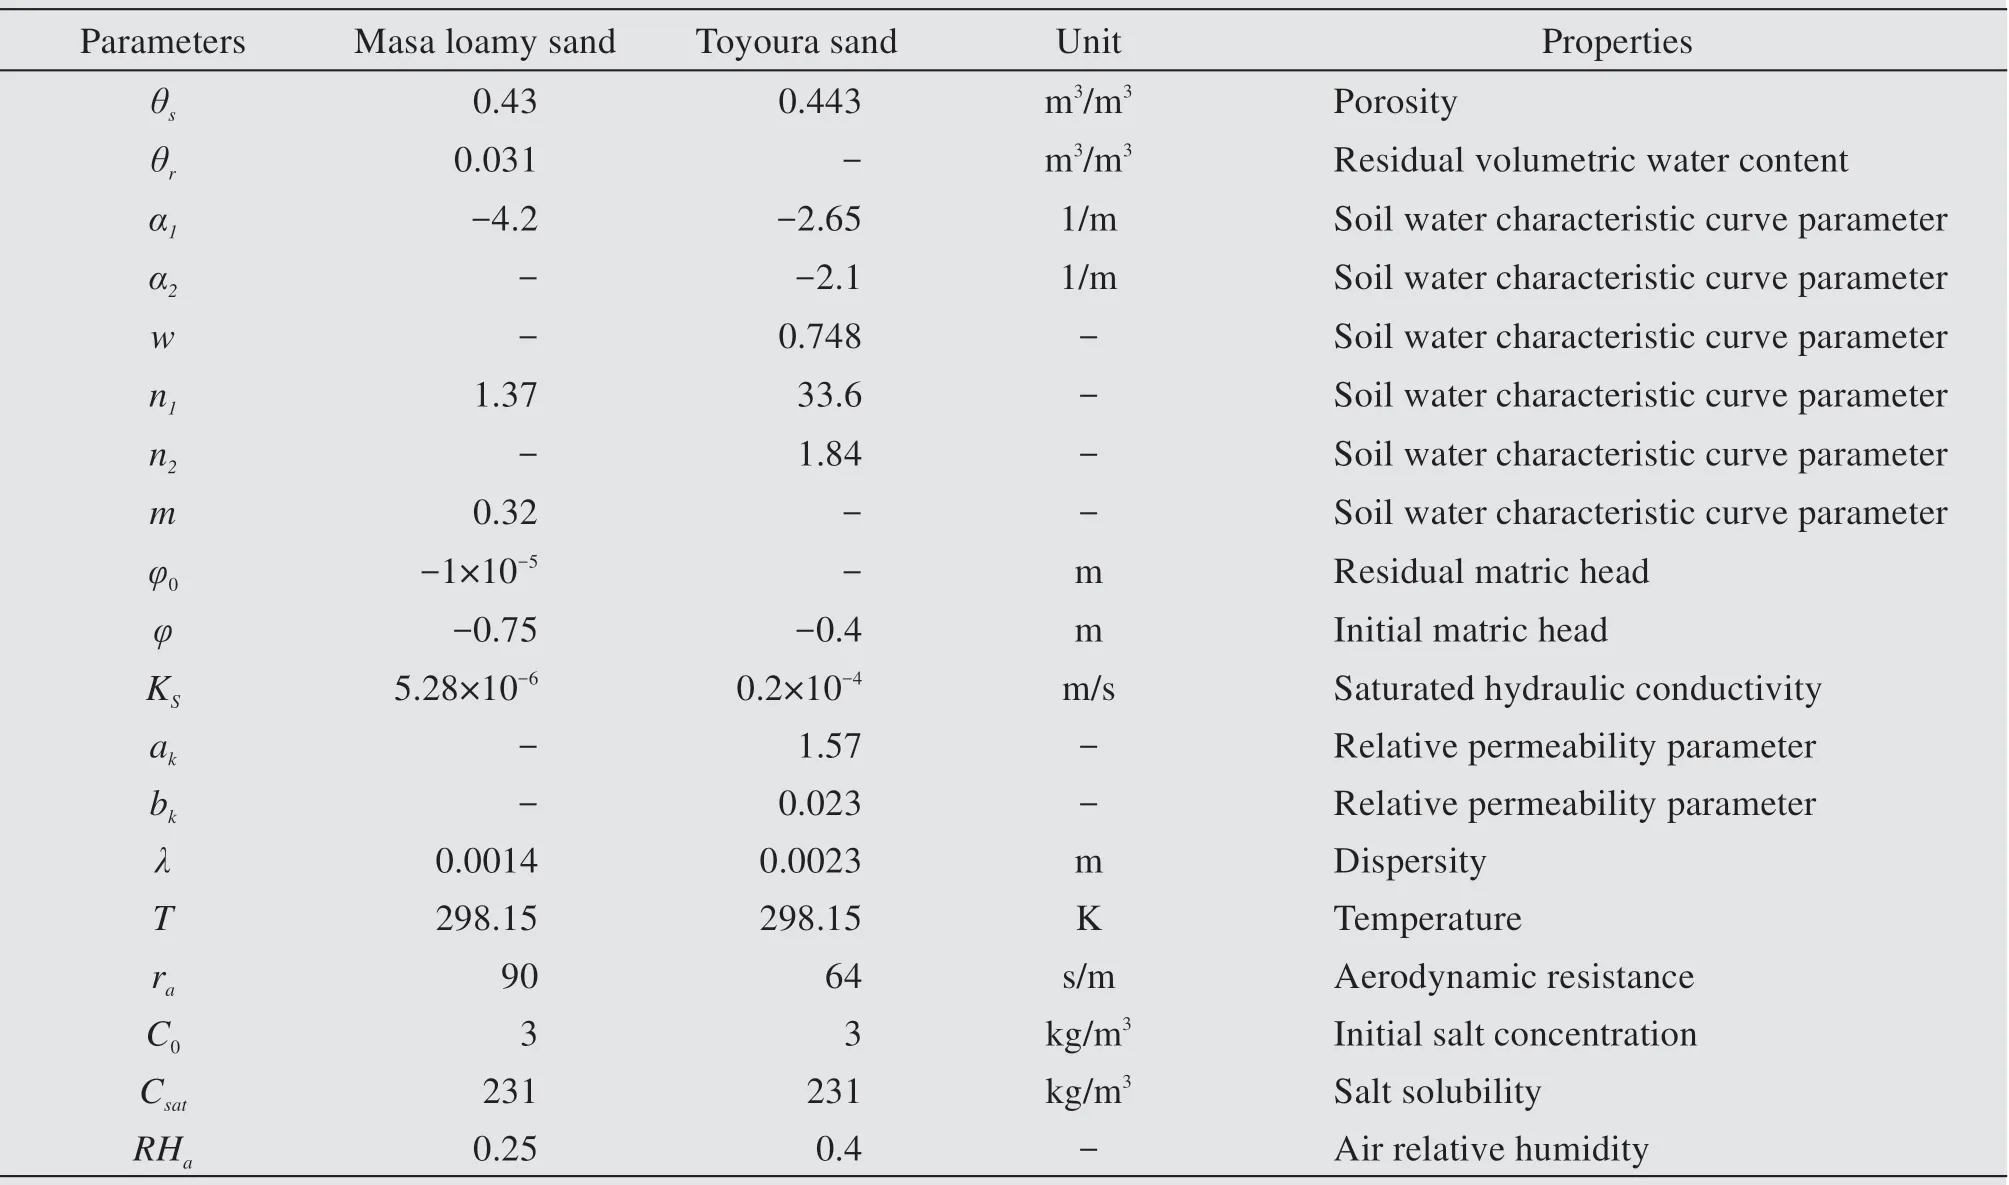
Table1 Parameters values employed in numerical simulation
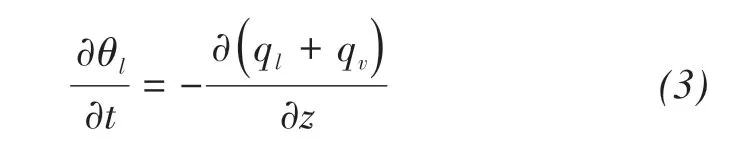
where θl(m3/m3)is the volumetric water content,and t(s)is the time.
3.2 Salt transport
Convection-Diffusion Equation (CDE) can be used as solute transport flux equation,and the temper‐ature-dependent solute transport is not considered here.

where c(kg/m3)is the solute concentration in the liq‐uid water,Di(m2/s)is the molecular diffusion coeffi‐cient,Dm(m2/s)is the mechanical dispersion coeffi‐cient,that is(Zhang et al.,2014),
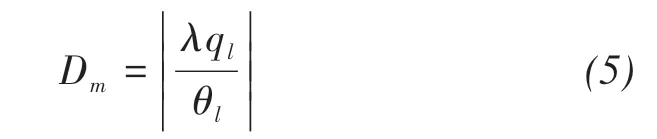
where λ(m)is the longitudinal dispersity.
With the evaporation continues,the solute will precipitate from solution,and the mass of precipitated salt per unit volume can be written as:
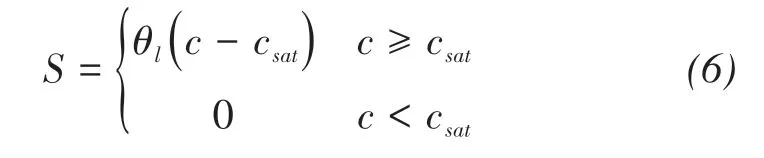
where csat(kg/m3)is the saturated solute concentration or solubility.S(kg/m3)is the mass of precipitated salt per unit volume.
Finally,the equation of salt mass conservation becomes:
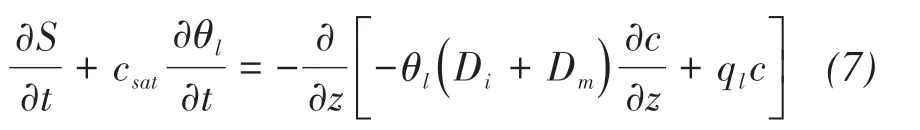
where the first term on the left-hand side represents the variations of precipitated salts over time,and the second is the variations of solute over time.
4 Moisture transport properties
4.1 Liquid water transport properties
Different soils have different physical characteris‐tics,so they need to be calculated separately.In this paper,two different sands(Masa loamy sand and Toy‐oura sand)are selected.
For Masa loamy sand(Fujimaki et al.,2006)
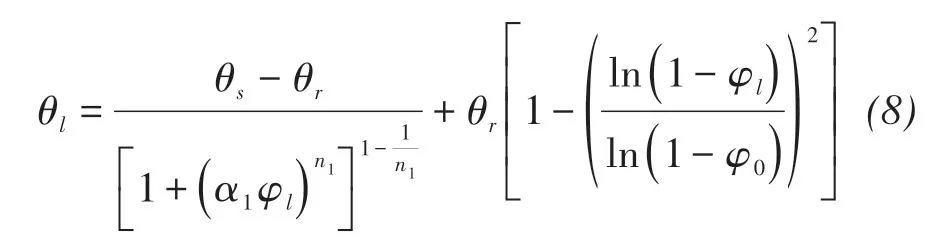
where θr,θs(m3/m3)are the residual and saturated vol‐umetric water content, respectively, α1, n1are the curve fitting parameters,and φ0(m)is the residual pressure head.
For Toyoura sand(Fujimaki et al.,2006)
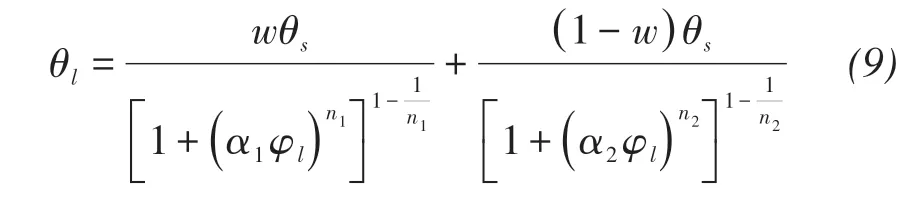
where α2,n2,w are the curve fitting parameters.
Substituting the parameters listed in Table 1 into Equation(8)and Equation(9),the relevant soil water characteristic curves are shown in Figure 2.
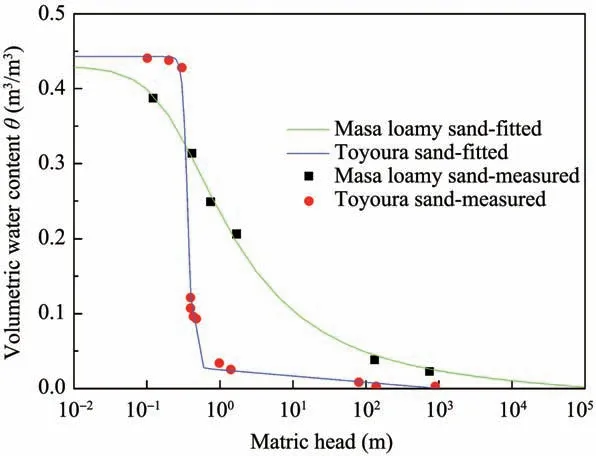
Figure 2 Soil water characteristic curve for Masa loamy sand and Toyoura sand
With the duration of evaporation,the soil water content changes from saturated to unsaturated.There‐fore,it is necessary to multiply the relative permeabil‐ity by the saturated hydraulic conductivity to consider the reduction of hydraulic conductivity.
For Masa loamy sand,the relative permeability is given by(Fujimaki et al.,2006)

For Toyoura sand(Fujimaki et al.,2006)
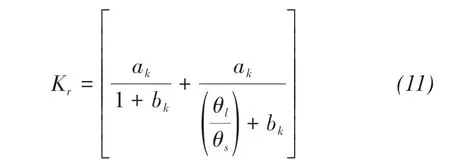
where ak,bkare the curve-fitting parameters.
The effect of precipitated salts on intrinsic permea‐bility should be considered here(Zeidouni et al.,2009)because the solute precipitated in soil pores will block the channel of water transport,and the intrinsic per‐meability in Equation(1)can be calculated by the sat‐urated hydraulic conductivity(Kasenow,2002).
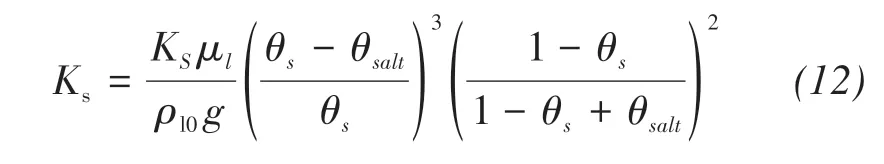
where KS(m/s)is the saturated hydraulic conductivity,θsaltis the volumetric solid salt content:
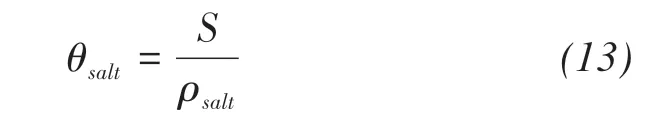
where ρsalt(2,165 kg/m3)is the density of precipitated salts.
Without considering the effect of precipitated salts on dynamic viscosity expressed in Equation(1),the dynamic viscosity is calculated by (Kestin et al.,1981):

where μl,μs(kg/(m ⋅s))are the dynamic viscosity of salt-free water and solute,respectively,c(kg/m3)is the solute concentration.
4.2 Vapor transport properties
With the precipitation of solute,the filling effect of precipitated salts on pores is considered.
Similarly,the filling effect of precipitated salts on tortuosity factor is considered too(Millington and Quirk,1961).
The coefficient of vapor diffusion in the air is de‐fined as(Kimball et al.,1976)
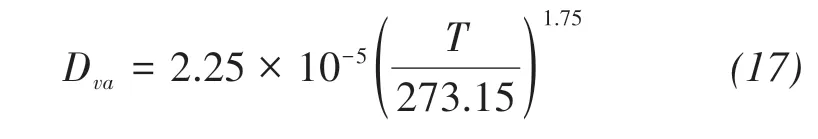
where T(K)is the temperature in soil.
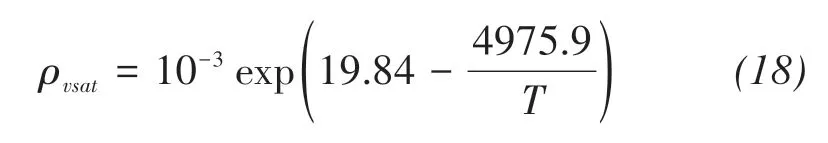
The saturated vapor density can be calculated by(Kimball et al.,1976)
Based on the assumption that the chemical poten‐tial of saline solution in soil is equal to that of vapor,the relative humidity of solution can be written as(Wen et al.,2020)
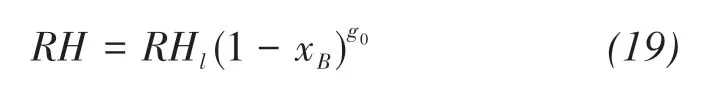
where xBis the molar fraction of solute in solutions,RHlis the relative humidity cause by pressure head,that is(Philip and Vries,1957)
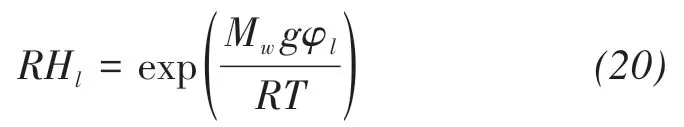
where Mw(0.018 kg/mol)is the molecular weight of water,and R(8.314 J/(mol⋅K))is the ideal gas constant.
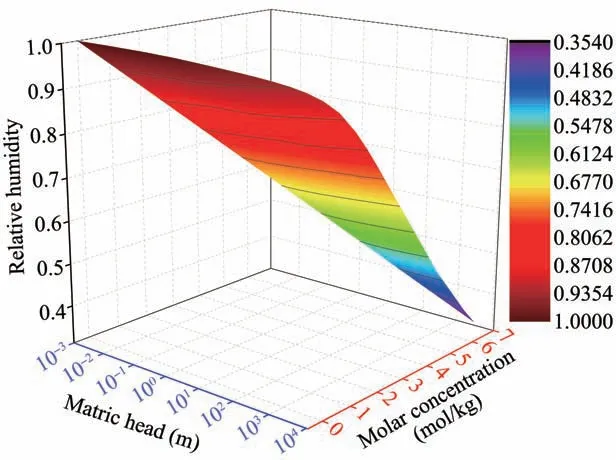
Figure 3 Changes of relative Humidity with matric head and solute concentration
g0is the rational osmotic coefficient(shown in Figure 4),that is(Robinson and Stokes,1955),

where φ is the effective osmotic coefficient(shown in Figure 4),v is the total number of cations and anions in electrolytes,xAis the molar fraction of solvent in so‐lutions(xA+xB=1,xA=nA/(nA+vnB)),and nA,nB(mol)are the molar quantity of solvent and solute in solution,respectively.
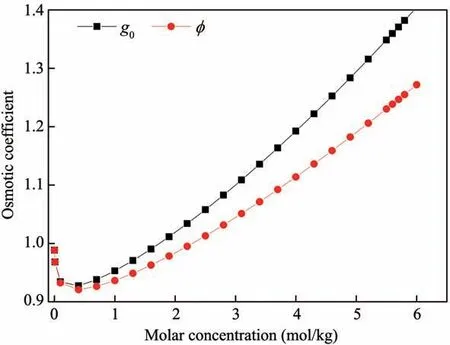
Figure 4 The osmotic coefficient of solution at different solute concentration
The effective osmotic coefficient can be calculat‐ed by Pitzer ions model(Pitzer and Mayorga,1973)
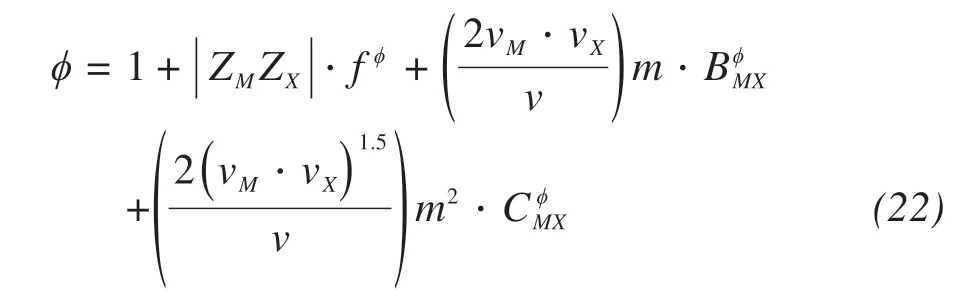
where ZM,ZXare the charge numbers of cationic and anionic in electrolyte,respectively;f,B,C are the pa‐rameters of Pitzer ions model,vM,vXare the number of cations and anions in a solute molecule(v=vM+vX,vNaCl=2),m(mol/kg)is the molar quantity of solute in solution,and M,X are the denotes of cations and an‐ions in electrolyte,respectively.
The enhancement factor resulting from consider‐ing the temperature difference between vapor and soil particles in soil can be expressed as(Cass et al.,1984;Campbell,1985;Nassar and Horton,1989)
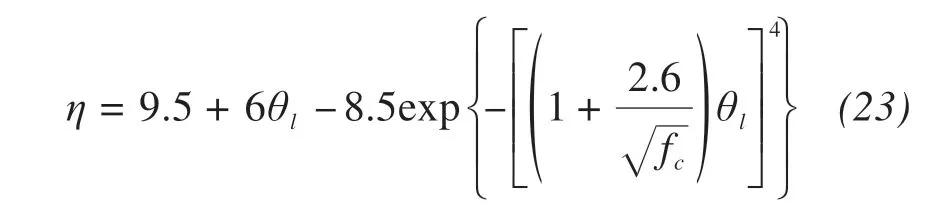
where fc(kg/kg)is the mass fraction of clay in the soil.
5 Boundary conditions
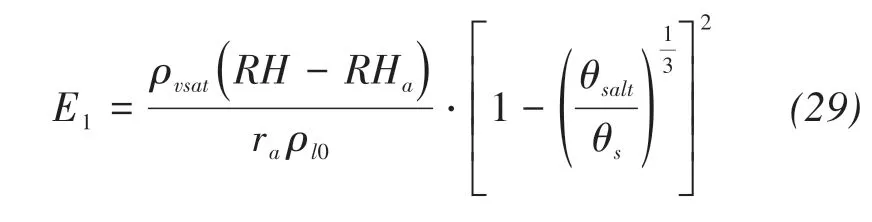
The thermal boundary condition and the latent heat required for evaporation are not considered here.Therefore,the evaporation rate on soil surface in ini‐tial stage without considering the filling effect of pre‐cipitated salts can be written as(Daamen and Sim‐monds,1996):
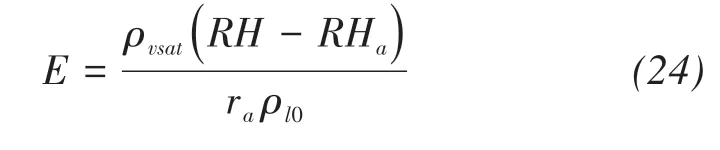
where RHais the air relative humidity,RH is the rela‐tive humidity on soil surface,and ra(s/m)is the aero‐dynamic resistance.
If the supplying rate of liquid water is larger than or equals to the evaporation rate,the solute will only precipitate on soil surface;if not,the solute will pre‐cipitate from evaporation front to soil surface.The evaporation rate then decreased as the mass of precipi‐tated salts increased.Therefore,the filling effect of precipitated salts(shown in Figure 5)on evaporation rate should be considered.
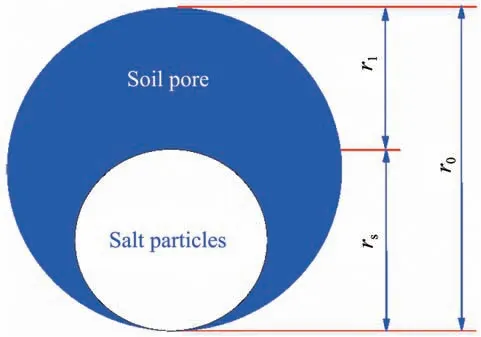
Figure 5 Schematic diagram of the process of precipitated salt filling the soil pores
It is assumed that the volume and the scale of the soil pores remain constant under evaporation,this can be concluded that the number of pores remains con‐stant under evaporation.Therefore,the number of soil pores can be assumed to be np.Then,the number of pores for solute to precipitate also equal to np.With the precipitation of solute,the average radius of precipitated salts increased gradually until rs=r0,then the evapora‐tion on soil surface ceased.Thus,the average radius of precipitated salts can be determined by the ratio of the volumetric content of precipitated salts to the porosity.

where r0,rsare the average radius of initial soil pores and precipitated salt particles,respectively,and npis the number of soil pores.
The maximum radius of unblocked pores can be calculated by subtracting the average radius of precip‐itated salts from the initial average radius r0.
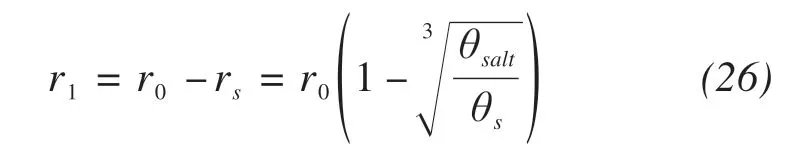
where r1is the maximum radius of unblocked pores.
The shape of unlocked pores is assumed to be spherical also,and the residual cross-sectional area for moisture migration can be calculated by un‐blocked pore radius.
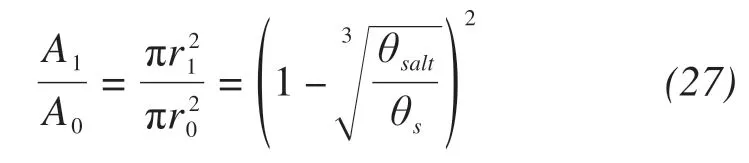
where A1,A0(m2)are the cross-sectional area of resid‐ual soil pores and initial soil pores,respectively.
Therefore,the evaporation rate affected by precipi‐tated salts can be obtained by analogy:

where E0,E1(m/s)are the initial evaporation rate un‐der salt-free conditions and the modified evaporation rate,respectively.
Assuming that the ratio constant of cross-sectional area to evaporation rate is 1,the new evaporation rate can be obtained as
6 Model validation and numerical simulation
As the experiment involves the three-field cou‐pling of water,salt and vapor.Comsol Multiphysics,a commercial software which is more mature in solving the multi-physical field coupling problem,is selected to solve the equations.The parameters used in govern‐ing equations are shown in Table 1.
Measured evaporation rates are shown in Figure 6.The point A and B are the inflection points of sol‐ute precipitation,it can be found that the calculated values are in good agreement with the experimental data when the effect of precipitated salts on evapora‐tion rate is considered.Comparatively speaking,the proposed model is more suitable for Toyoura sand,and some errors occurs in Masa loamy sand.The main reason for this is that the dispersity in original paper is a constant,while in practice,the coefficient is related to water content,porosity,pore water velocity and particle geometry(Klotz et al.,1980;Wheatcraft and Tyler,1988;Maraqa et al.,1997)and changes with the relevant factors.

Figure 6 Comparison between the measured and predicted evaporation rate for both soils
Measured volumetric water content are shown in Figure 7.A good agreement between the experimental and simulated values can be seen from Toyoura sand,and there is a large error near the soil surface in Masa loamy sand,the possible reason is that the air relative humidity is very low,and the water in sand is easy to evaporate during sampling.
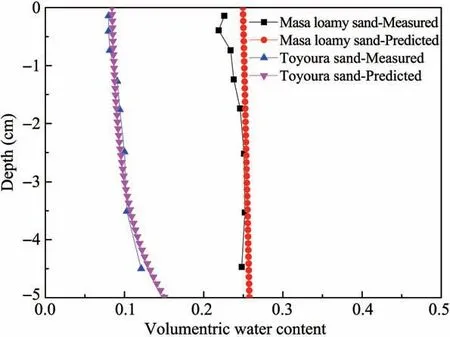
Figure 7 Comparison between the measured and predicted volumetric water contents
Measured solute concentrations are shown in Fig‐ure 8,with the duration of evaporation,the solute con‐centration on soil surface increased gradually until sat‐urated.There is a saturated layer underneath the soil surface during the process of simulation,while the sat‐urated layer is not reflected in experiment,the possi‐ble reason can be viewed as the limited precision of manual measurement.Overall,the simulated solutions are in good agreement with the experimental data,and the simulation effect of Masa loamy sand is better than that of Toyoura sand.
Figure 9 shows the variation of precipitated salts.It is obvious that the precipitation rate is dif‐ferent from soils and the mass of precipitated salts from evaporation front to soil surface is always in‐creasing in both soils,which can be illustrated by the soil structures, moisture transport properties and evaporation conditions.Meanwhile,the thick‐ness of precipitated salts is in consistent with that of solute saturated layer as the solute precipitate on‐ly under condition of solute concentration beyond the solubility.
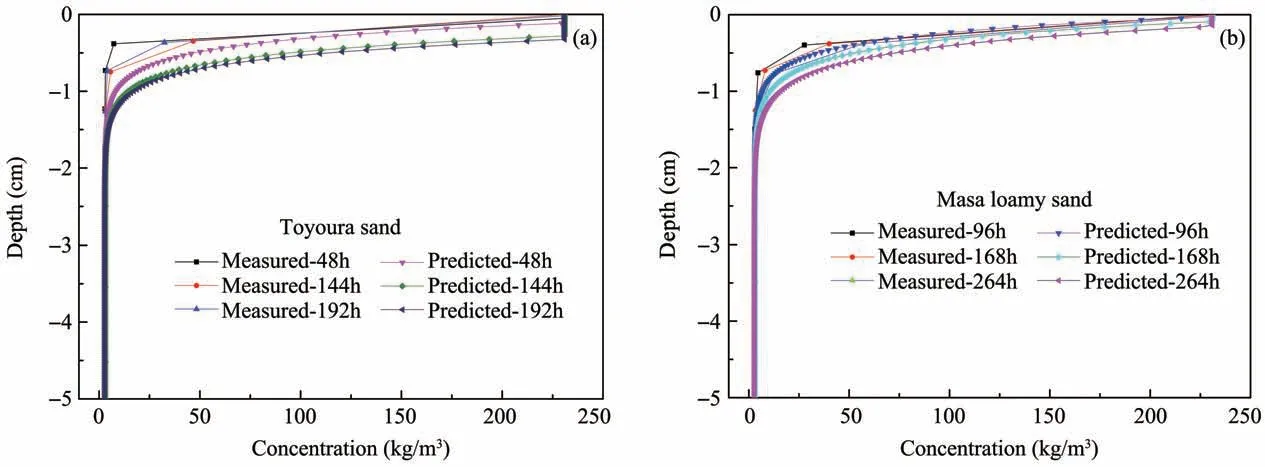
Figure 8 Concentration distributions during the course of evaporation for different sands

Figure 9 Precipitated salt in soils at different times for both sands
7 Conclusions
The mathematical model describing moisture and solute transport in isothermal conditions was briefly presented in this paper.The filling effect of precipitat‐ed salts was taken into account in evaporation rate and moisture transport equations.Meanwhile,a transi‐tion equation is proposed,which convenient for con‐version of solute migration governing equation when the solute concentration beyond the solubility.
During the process of simulation,one can notice the receding front of moisture obviously,which is typ‐ical for soils with no enough water supplying;and one can observe a sustainable increase of the precipitated salts from evaporation front to soil surface.The re‐sults show that the simulated evaporation rates agreed well with the experimental data for both soils;and the predicted water content and solute concentration were also in good agreement with measured values.Over‐all,the numerical solutions gave fair agreement with the measured data illustrated that the moisture-salt transport in soil can be simulated by a series of theo‐retical equations,which indirectly proves the effec‐tiveness of this model.
Acknowledgments:
This research was supported by the National Key Re‐search and Development Program of China(Grant No.2018YFC0809605);the National Natural Science Foundation of China (Grant Nos. 41230630,41601074);the Key Research Program of Frontier Sciences of Chinese Academy of Sciences(Grant No.QYZDY-SSW-DQC015)and the Program of the State Key Laboratory of Frozen Soil Engineering(Grant No.SKLFSE-ZT-23).
 Sciences in Cold and Arid Regions2020年3期
- Sciences in Cold and Arid Regions的其它文章
- Editors-in-Chief Yuanming Lai and Ximing Cai
- Numerical simulations on cutting of frozen soil using HJC Model
- Mapping the dynamic degree of aeolian desertification in the Shiyang River Basin from 1975 to 2010
- Quantitatively estimate the components of natural runoff and identify the impacting factors in a snow-fed river basin of China
- A meta-analysis of the impacts of forest logging on soil CO2 efflux
- Fast genetic mapping in barley:case studies of cuticle mutants using RNA-sequencing