
Mapping the dynamic degree of aeolian desertification in the Shiyang River Basin from 1975 to 2010
2020-07-01 08:13JieLiaoTaoWangShaoXiuMaJianGuo
Jie Liao ,Tao Wang ,ShaoXiu Ma ,2,Jian Guo
1.Key Laboratory of Desert and Desertification,Northwest Institute of Eco-Environment and Resources,Chinese Academy of Sciences,Lanzhou,Gansu 730000,China
2.Drylands Salinization Research Station,Northwest Institute of Eco-Environment and Resources,Chinese Academy of Sciences,Lanzhou,Gansu 730000,China
3.Lanzhou Branch,Chinese Academy of Sciences,Lanzhou,Gansu 730000,China
ABSTRACT
Keywords:aeolian desertification;dynamic degree;Shiyang River Basin;Minqin
1 Introduction
Desertification can be defined as"Land degrada‐tion in arid,semiarid,and dry sub-humid areas result‐ing from various factors,including climatic variations and human activities"(UNCCD,1995).Globally,de‐sertified land amounts to 3.6×10⁷km2,which covers 24.1%of Earth's land surface and affects about onesixth of the world's population,much of whom live in poverty (Middleton and Thomas, 1997).Since the 1970s,the phenomenon of desertification has been at the forefront of international community concerns due to its powerful destabilizing potential of the natural environment and human society(Perini et al.,2009).Efficiently combating desertification requires assess‐ment and mapping of desertification in arid and semiarid environments(Jacques et al.,2015).Therefore,a range of projects focusing on desertification identi‐fication and monitoring has been carried out on a global scale(FAO/UNEP,1984,1997;Kosmas et al.,1999;GIWA,2001;Irvine and Cosmas,2003;Liniger et al.,2008;Lamchin et al.,2016;Dharumarajan et al.,2018).
Aeolian desertification,characterized by wind ero‐sion mainly resulted from excessive human activities in arid, semiarid, and sub-humid regions (Wang,2011),is the dominant type of desertification in north‐ern China(Wang et al.,2015).Aeolian desertification causes huge economic losses of 45 billion CNY per year,threatening nearly 300 million people's liveli‐hoods and welfare in northern China(Wang,2014).To combat aeolian desertification with efficiency and targets,Zhu(1985)started the aeolian desertification monitoring and mapping in China and monitored the situation,trend and rate of Aeolian Desertified Land(ADL)in Northern China during 1950s−1970s by us‐ing aerial photos.Wang et al.(2004),the successors to Zhu,mapped the status of aeolian desertification in northern China by the first combined use of Landsat images and 3S techniques (Remote Sensing,Geo‐graphical Information System,Global Position Sys‐tem).Since then,massive mapping and monitoring projects focusing on different areas have been carried out to study the status and dynamic of aeolian deserti‐fication(Liu and Wang,2007;Yang et al.,2007;Yan et al.,2009;Guo et al.,2010;Hu et al.,2011;Dawell‐bait M et al.,2012;Wang et al.,2012,2013;Wang et al.,2015;Wang et al.,2017;Zhang et al.,2018;Duan et al.,2019).
Currently,a huge amount of satellite-remote-sens‐ing data(e.g.,Landsat MSS/TM/ETM+/OLI)can be freely accessed from websites such as USGS or NOAA(Scuderi et al.,2015)allows scientists to mon‐itor aeolian desertification in multiple periods in order to capture more details about its dynamics.However,this creates another problem of how to map the over‐all dynamics and spatial pattern of aeolian desertifica‐tion during a study period with multiple sub-periods.At the present time,through spatial analysis,we can only compare and map the spatial pattern of aeolian desertification dynamics over two sub-periods.
Minqin County is in the lower reaches of the Shi‐yang River Basin,located between the Badain Jaran Desert and the Tengger Desert.Due to its unique geo‐graphic location,the issue of aeolian desertification in Minqin is so severe that it aroused the attention of for‐mer Premier Wen JiaBao,who gave instructions of"We must never allow Minqin county to repeat the tragedy of Lop Nur.".Lop Nur was once the second largest inland lake in China which dried up six times during 2001−2007 due to reduced water supply(Zhao,2007).Now,Lop Nur is called the Sea of Death be‐cause nothing alive can survive there.These instruc‐tions of former Premier Wen elevated the issue of aeo‐lian desertification in Minqin and Shiyang River Ba‐sin as a national concern.Although a series of deserti‐fication control projects have been carried out in the Shiyang River Basin since then,monitoring aeolian desertification in the Shiyang River Basin has rarely been reported.
In this study,taking the Shiyang River Basin as the study area,based on Landsat datasets from 1975 to 2010,through visual interpretation of the images,we will 1)monitor and map the status and trend of ae‐olian desertification;2)analyze the spatial patterns of dynamics between two sub-periods;3)and propose a Dynamic Index of aeolian desertification to map the spatial patterns of dynamics through the study period.The results will be a comprehensive assessment of the status and trends of aeolian desertification and will fa‐cilitate the planning and implementation of aeolian de‐sertification control projects in this region.
2 Materials and methods
2.1 Study area
The Shiyang River Basin(37.12°N −39.47°N,101.12°E−104.26°E)with a coverage of 40.58×10³km2is located in the eastern portion of the Hexi Corridor in Gansu Province,China,covering five counties/dis‐tricts(Gulang,Liangzhou,Yongchang,Jinchuan,and Minqin)(Figure 1).The terrain slopes downwards from the southern high and snow-capped Qilian Mountains(2,000−5,000 m)to the northern low and arid desert(less than 1,400 m)(Tang et al.,1992).Corresponding to elevation change,mean annual pre‐cipitation decreases markedly from 300 to 600 mm in the mountain areas to 150−300 mm in the central plain,and to less than 100 mm in the Minqin Basin.In con‐trast,potential evaporation increases from 700 mm in the mountains to more than 2,600 mm in the desert plain(Ma et al.,2005).Annual wind speed in the Shi‐yang River Basin is 3.15 m/s(Liu et al.,2011).
The Shiyang River,the third largest river in Gansu Province,is comprised of eight primary tributaries.From east to west,the tributaries are Dajin,Gulang,Huangyang,Zamu,Jinta,Xiyin,Dongda,and Xida rivers,all supplied by precipitation,melted snow and glacier in the Qilian Mountains(Figure 1).Except for the easternmost Dajin River and westernmost Xida River,the other six rivers converge into the main‐stream of Shiyang River,which flows north and irri‐gates the Minqin oasis.The total annual surface runoff is about 1.58 billion m3in the Shiyang River Basin,and the annual per capita renewable freshwater avail‐ability is only about 744 m3(Guo et al.,2010),way be‐low the threshold of serious water stress defined by UN WAAP(2009).Thus,the study area is facing seri‐ous water source shortage.About 86.4%of the water resource is used for agriculture,with a continuous in‐crease in farmlands since the 1970s(Zhou et al.,2015),resulting in over-exploitation of groundwater,water ta‐ble drop and vegetable degradation(Wen et al.,2013).
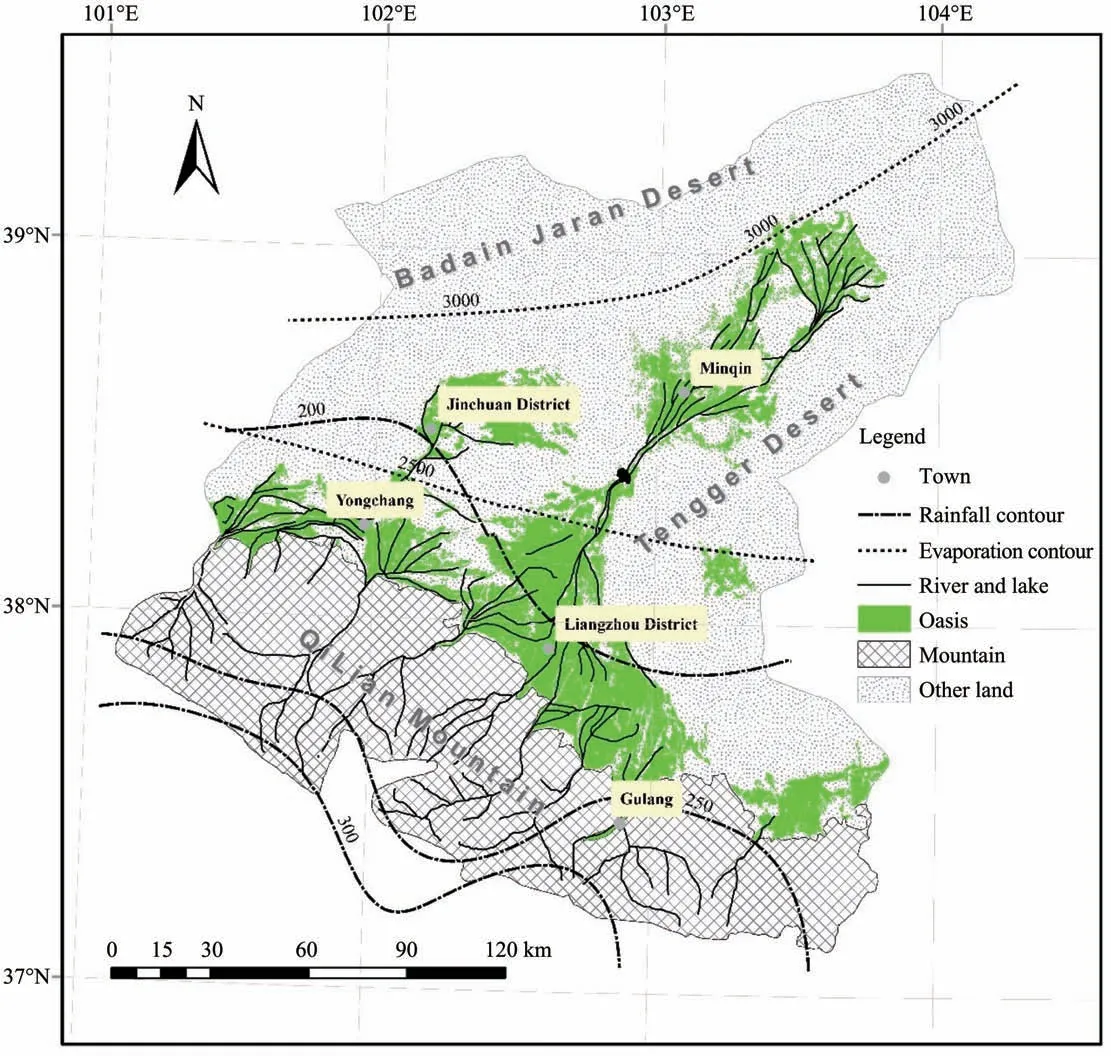
Figure 1 Location,terrain and hydrology of the Shiyang River Basin,China
2.2 Datasets
Landsat imagery is available since 1972 from eight satellites in the Landsat series.These satellites have been a major component of NASA Earth Obser‐vations(NEO)program,with five primary sensors evolving over forty years:MSS(Multi-spectral Scan‐ner),TM(Thematic Mapper),ETM+(Enhanced The‐matic Mapper Plus),OLI(Operational Land Imager)and TIRS(Thermal Infrared Sensor).By far,Landsat imagery is the most widely used and effective satellite remote sensing data source.Landsat images are also successfully used in aeolian desertification monitor‐ing(Liu and Wang,2007;Yang et al.,2007;Yan et al.,2009;Guo et al.,2010;Wang et al.,2012,2013;Zhang et al.,2018).In this study,images of four-time points from MSS(1975),TM(1990,2010)and ETM(2000)are employed for aeolian desertification moni‐toring.All images are freely provided by the United States Geological Survey(http://glovis.usgs.gov).Im‐ages from MSS have a spatial resolution of 78 m,and 30 m for the others.
Images were acquired in summer(July-Septem‐ber)when plants are at a peak growth stage.In this study,only near-infrared(NIR),visible red(VR),and visible green(VG)bands were used to monitor aeoli‐an desertification because vegetation has a high reflec‐tance in band NIR and strong absorption in band VR because of chlorophyll in leaves.Vegetation(red)and shifting sand/sand dunes(white or yellow)can be clearly distinguished in false color images obtained by combining these three bands.All images were geo‐referenced and orthorectified by using Erdas Imagine 2014.The mean location error after georectification of the images was less than 1.5 pixels.All images have a uniform Albers Conical Area/Krasovsky coor‐dinate system.
2.3 Methods
2.3.1 Aeolian desertified Land classification system
Based on previous studies on the classification of ADL severity(Liu and Wang,2007;Yan et al.,2009;Guo et al.,2010;Wang et al.,2012;Duan et al.,2019),ADL intensities are defined as Slight(SL),Moderate (M), Severe (S), and Extremely Severe(ES),according to coverage ratios of vegetation and shifting sand.ADLs with different severity show dif‐ferent colors,textures,patterns,and patch sizes,in corresponding remote sensing images.As a result,we established the ADL classification system for visual interpretation,as presented in Table 1.
2.3.2 Visual interpretation
According to the established ADL classification system(Table 1),satellite images were interpreted vi‐sually,under the support of ancillary materials such as topographic,soil,vegetation,and land cover maps.All visual interpretation works were carried out by us‐ing ArcSketch Module of ArcGIS Desktop 9.3.When interpreting,the following protocols must be used:(1)The minimum size for a delineated polygon should be no smaller than 200m×200m,that is about 6×6 pixels for TM/ETM images and 3×3 pixels for MSS images.(2)For polygons of narrow shapes,the width should be larger than 120 m.(3)Location deviation of delin‐eating is no larger than one pixel.(4)Interpretation ac‐curacy using sampling verification method should be higher than 95%.

Table 1 Aeolian Desertified Land(ADL)classification system
2.3.3 Dynamic Index(DI)of aeolian desertification
In this study,the Dynamic Index(DI)of aeolian desertification refers to the number of changes in a specific study period,for example,from Non-ADL to SL ADL,or from M ADL to ES ADL.Thus,in the present study,the DI is the number of changes in de‐sertification status during 1975 −2010.We can com‐pute the DI by comparing the attributes from two adja‐cent periods.As a result,DI(Dt)can be computed through the following equation:

We set D1=0,and t ∈[2,3,4],Ptrepresents the at‐tribute value of any polygon in the ADL datasets(or the severity of a little piece of ADL in reality)at time t.D4is DI computed during 1975−2010 and ranges be‐tween 0 and 3(integers only).DI=0 indicates a stable area where the desertification status was unchanged throughout the study period.In contrast,DI=3 indi‐cates a variable area where the desertification status keep changing throughtout the study period.
3 Results
3.1 The trend and spatial pattern of ADLs during 1975−2010
The total area of ADLs in the Shiyang River Basin was 5.06×10³km2in 1975,4.87×103km2in 1990,4.71×103km2in 2000 and 4.87×10³km2in 2010,ac‐counting for 12.46%,12.00%,11.61%and 12.01%of the total area of Shiyang River Basin,respectively.The total ADL area decreased by 0.34×10³km2from 1975 to 2000,but increased by 0.16×10³km2from 2000 to 2010.Throughout the study period of 1975−2010,the total area of ADLs was reduced by 0.18×10³km2in the Shiyang River Basin(Figure 2).

Figure 2 Temporal trend of ADLs with different severity from 1975 to 2010
From 1975 to 2010,the trend of SL,M and S ADLs was consistent with that of the regional sum.Although there were fluctuations,the area of SL,M and S ADLs decreased by 0.18×10³km2,0.11×103km2and 0.06×10³km2accordingly.In contrast,the area of ES ADL kept increasing from 1.97×10³km2in 1975 to 2.13×10³km2in 2010,with an increment of 0.16×10³km2(Figure 2),that was almost as much as the net decrement of the regional sum throughout the study period.Also,the ES ADL always took the larg‐est proportion over total ADLs of 38.95%,42.45%,44.22%and 43.66%at each monitoring time point of 1975,1990,2000 and 2010 accordingly.In addition,the ADL area also increased with increasing severity.Moreover,the regional ADL was dominated by S and ES ADLs,which together occupied 67.31%,69.35%,72.04%and 71.95%of the regional sum at each moni‐toring time points.These results together indicate the severe situation of aeolian desertification in the Shi‐yang River Basin.
As depicted in Figure 3,the spatial pattern of ADLs was comparatively stable at the four-time points,and no visible change can be easily identified.The ADLs are mostly distributed in the periphery of the oasis or scattered inside the oasis(Figures 1 and 3).It is worth noting that Minqin County in the lower reaches of the Shiyang River is the most concentrated area of ADLs(Figure 3),and the ADL area in Minqin was 3.86×10³km2in 1975,3.84×103km2in 1990,3.77×103km2in 2000 and 3.95×10³km2in 2010,occu‐pying 76.35%,78.94%,80.07%and 81.10%of the re‐gional total ADLs.Moreover,the total ADL area in Minqin kept increasing,which is contrary to the trend of regional sum.These results imply an increasingly worsening situation of aeolian desertification in Minqin.
3.2 The spatial pattern of ADL dynamics between two adjacent sub-periods throughout 1975−2010
From 1975 to 1990,0.32×103km2of ADLs was restored during the restoration stage of aeolian de‐sertification.Among the ADLs,there amounted to 0.17×10³km2of restored S ADL, accounting for 51.23%of the restored sum.Meanwhile,there was 0.18×10³km2of deteriorated ADLs,which was domi‐nated by SL ADL(0.15×10³km2,63.54%of the sum)which further degraded to ES ADL(Table 2).The re‐stored ADLs were concentrated in the lower reach of the Dajing River,the upper reach of the Hongshui River,and in the western part of Jianchuan District bordering Minqin County. The deteriorated ADLs were primarily located along the west bank of the middle Hongshui River,and the rest were scattered in Minqin County.Different from the concentrated distri‐bution of the restored and deteriorated ADLs,the new ADL was distributed in Yongchang County,Jinchuan District,and Minqin County(Figure 4a).
The dynamics of ADL in the Shiyang River Basin was still in a restoration stage from 1990−2000,when 0.23×10³km2of ADLs have been restored(Table 2).Moreover,further analysis indicated 68.9%of the re‐stored ADLs came from the former S(0.08×10³km2)and ES(also 0.08×10³km2)ADLs in 1990.However,there amounted to 0.22×10³km2of ADLs that further deteriorated during the same sub-period(Table 2).As presented in Figure 4b,the restored ADLs were dis‐tributed from along the Hongshui River downward to along the Shiyang River.The deteriorated ADLs were located in the triangle area between the Shiyang River and the county line bordering Yongchang County and Jinchuan District.
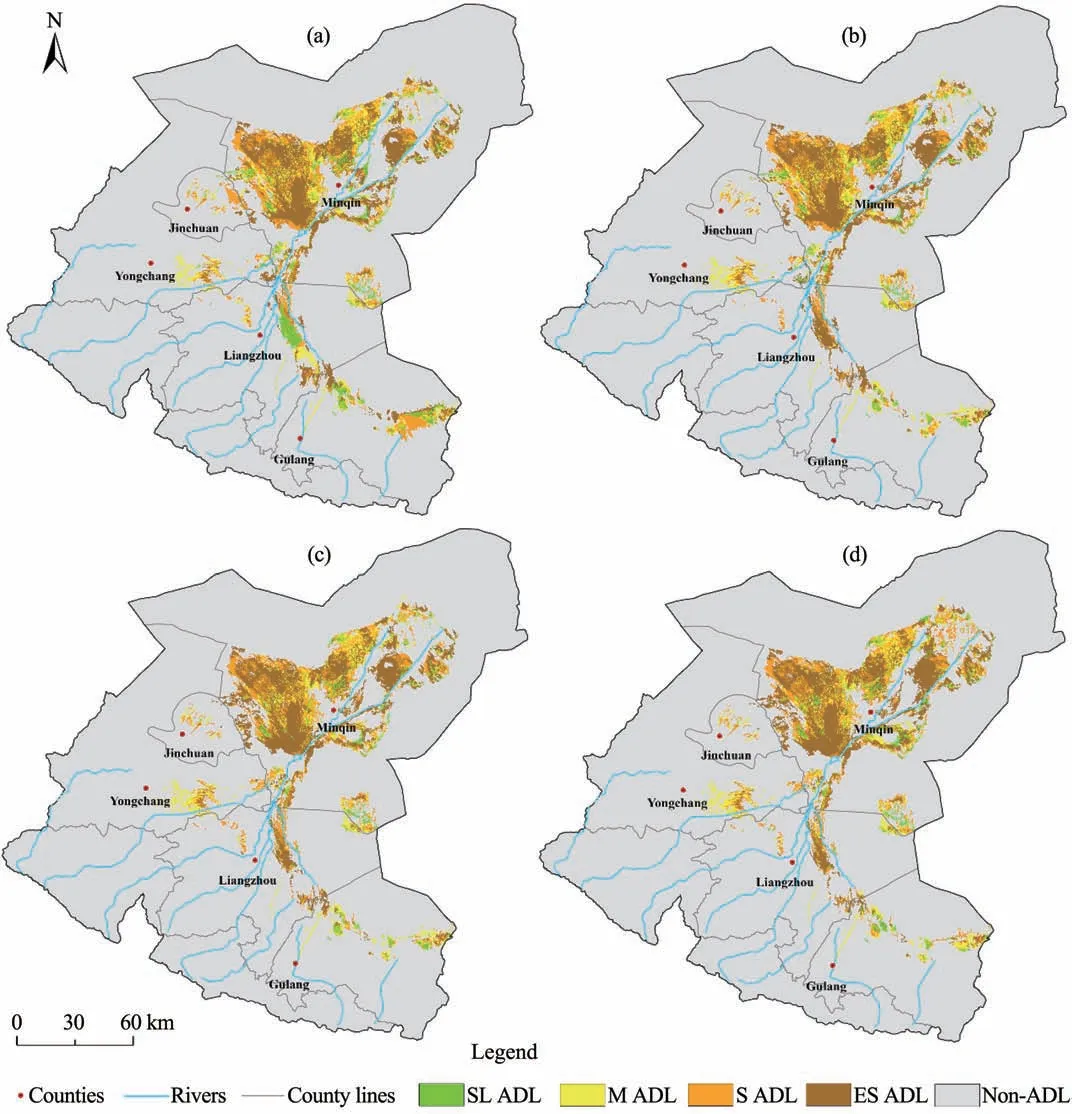
Figure 3 Spatial patterns of ADLs with different severity from 1975 to 2010(a,b,c,and d indicate the year 1975,1990,2000 and 2010 accordingly)
In contrast to the previous two sub-periods,the subperiod of 2000−2010 was the stage of aeolian deserti‐fication expansion,because the new ADL area was much larger than the others,reaching 0.20×10³km2,even larger than the sum of the restored,relieved and deteriorated ADLs(Table 2).Special attention should be paid to the fact that new ADLs mostly came from the abandoned farmland which mostly occurred in Minqin County,the lower reach of the Shiyang River(Figure 4c).
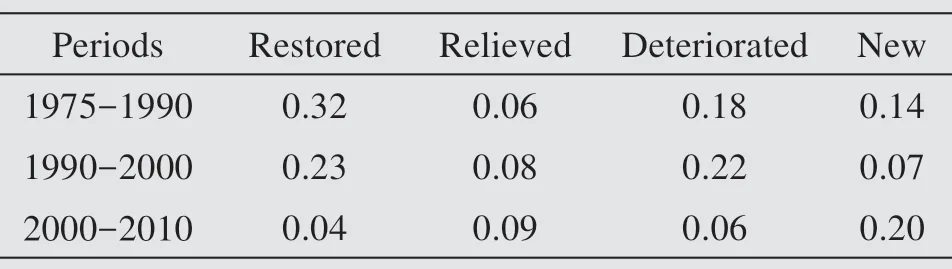
Table 2 Area of ADLs with different dynamic types(Unit:×103 km2)
3.3 The spatial pattern of DI throughout 1975−2010
Throughout the period of 1975 −2010,changed lands(including ADLs and Non-ADL)(DI>0)added up to 1.55×10³km2,among them,the changed ADLs(based on the status in 1975)amounted to 1.17×10³km2,accounting for 75.48%of the total changed lands since 1975. Moreover, the total changed ADLs occupied 23.04%of the total ADLs in 1975.In other words,the majority(76.96%of the sum in 1975)has been stable since 1975,which indicates the generally slow process of aeolian desertification in the Shiyang River Basin.As contrasted in Figure 5,changed S ADL had the larg‐est area of 0.37×10³km2,the others show the tendency of a decreased area with increasing severity.The ten‐dency was more evident if its ratio to the ADL area with corresponding severity was compared.The ratio of SL ADL had the largest value of 60.42%,which means 60.42%of SL ADL changed at least once(DI ≥1)from 1975 to 2010.Moreover,the ratio de‐creased with increasing severity to 10.69%,indicating only 10.69%of ES ADL changed during the same peri‐od(Figure 5).The above analysis suggests a decreased dynamic degree with increasing severity among ADLs,or the severer the ADL,the harder it is to be changed.

Figure 4 Spatial patterns of ADL Dynamics in the sub-periods of 1975−1990(a),1990−2000(b)and 2000−2010(c)(Restored ADL means ADLs became Non-ADL,Relieved ADL indicates ADLs of higher severity became ADLs of lighter severity.New ADL and Deteriorated ADL are the opposite of Restored ADL and Relieved ADL)
As depicted in Figure 6,changed lands with DI=1 had the largest area of 1.40×10³km2,accounting for 90.36%of the changed sum.Those with DI=2 only had an area of 0.15,accounting for 9.14%.Moreover,lands of only 0.003×10³km2(0.22%)had the largest DI value of 3.The above results imply that the majori‐ty of changed lands only changed once during the past 35 years(1975−2010),while the smallest area of land kept changing(DI=3)at every monitoring time points,which indicates a comparatively stable status of aeoli‐an desertification in the Shiyang River Basin.
As presented in Figure 6,changed ADLs were mostly distributed on the periphery of the stable ADLs or along the Shiyang River and its tributaries.Specifically,0.87×103km2(56.20%)of the change ADLs was located in Minqin County,followed by Gulang County(0.35×10³km2)and Jinchuan District(0.28×10³km2),accounting for 22.81%and 17.78%accordingly.It should be noted that ADLs in Minqin accounted for 79.12%of the regional sum on aver‐age during the study period.However,the changed ADLs only accounts for 56.20%of the total changed land,indicating that the dynamic degree of Minqin is lower than the regional average.Specifically,ADLs in Minqin were more stable than the regional aver‐age,and the ADLs in the middle reaches were less stable(Figure 6).
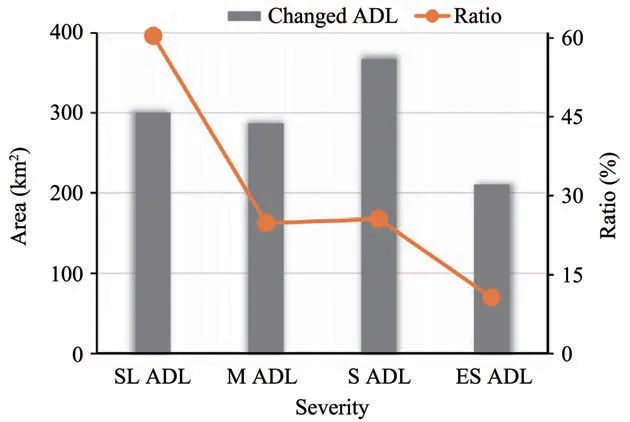
Figure 5 The area of changed ADLs with different severity and its ratio to the ADL area with corresponding severity from 1975 to 2010
4 Discussion
The total area of ADLs only accounted for 12.02%of the territory in the Shiyang River Basin on average from 1975 to 2010.This figure can hardly in‐dicate severe aeolian desertification.However,why did aeolian desertification in the Shiyang River Basin become a national concern?Because,Qilian Moun‐tain is located in the southwest,and the majority of the plain in the middle and lower reach is covered by sand desert and Gobi(Figure 1).The local people can only live in the oasis along the rivers.Also,almost all ADLs were distributed in the periphery of the oasis.According to Wen et al.(2013),the area of oasis in the Shiyang River Basin was 7.57×10³km2,7.73×103km2,7.13×103km2and 7.46×10³km2in 1975,1990,2000 and 2010 accordingly.The ADLs occupied 66.86%,62.99%,66.09%and 65.35%in corresponding moni‐toring years.These results indicate that ADLs in the Shiyang River Basin was much more concentrated than those in sandy lands in the east(Liu and Wang,2007;Guo et al.,2010;Duan et al.,2019),even the Tibet Plateau(Zhang et al.,2018).Moreover,com‐pared to the SL and M ADLs dominated ADLs in the eastern sandy lands,the ADLs was dominated by S and ES ADLs in the Shiyang River Basin.Also,the ES ADLs kept increasing throughout the study period.All these results indicate an increased severity status of aeolian desertification in the Shiyang River Basin.
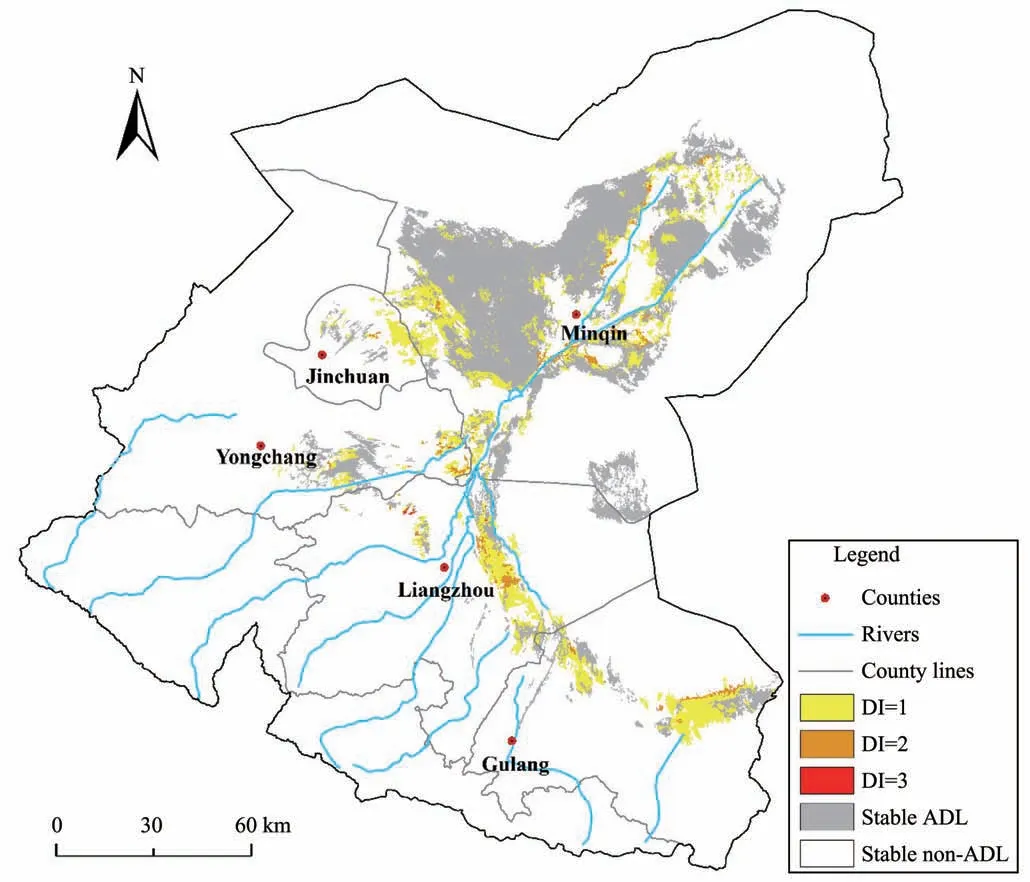
Figure 6 The spatial pattern of DI in the Shiyang River Basin from 1975 to 2010
The growing human population has spurred the continuous cultivation of grassland into farmland(Wen et al.,2013).This is especially true in the oasisdesert transition zone around the Minqin oasis,where desertification is most vulnerable.Also,development in the upper reaches resulted in a sharp drop of runoff flowing into Minqin.The runoff was 5.42×10⁸m3in the 1950s and decreased to only 1.00×10⁸m3in 2006(Chen et al.,2018).To meet the water resource de‐mands of industrial and agricultural development,hu‐man and livestocks consumption,local people in the lower reach of Minqin County have opted to dig wells and exploit the groundwater.From the 1970s to 2006,the average annual over-exploitation of groundwater reached 4.60×10⁸m3,dropping the groundwater table by 0.3−0.8 meters per year(Yin et al.,2016).The de‐creased groundwater table can not only cause a large area of shrub and grass communities to perish,but also lead to increased mineralization of shallow water by 0.20−0.35 g/(L·a),and even increased by 0.24 g/(L·a)for deep-water mineralization in Minqin(Chen et al.,2018).Due to the deterioration of shallow water quali‐ty in Minqin County,the water cannot be used for irri‐gation in some areas,creating a serious water short‐age.Thus,local farmers had to abandon some lowyield farmlands(Wang et al.,2011).
With implementation of the Key Management Plan for the Shiyang River Basin(KMPSRB)since 2007,farmlands in the oasis-desert transition zone were abandoned firstly(Xue et al.,2015).Without a water supply from the irrigation system,abandoned farmlands on the oasis edge is rapidly desertified un‐der the dual influence of drought and salinization,Thus,the natural vegetation will require a long time to recover which depends on groundwater supply and precipitation supply.This is why the dynamic of ADLs in Minqin kept increasing between 2000 and 2010 even when the KMPSRB was implemented in 2007.
In this study,we originally proposed the Dynamic Index(DI)to map the overall spatial pattern of ADL dynamics throughout three sub-periods.As presented in Figure 6,the DI map can clearly show where and how dynamic changes occur.As noted,DI cannot indi‐cate the change trend of aeolian desertification becom‐ing better or worse,but can indicate the possibility of being changed.Further analysis based on the DI map disclosed a stable status of aeolian desertification in the Shiyang River Basin and the DI decreased with in‐creasing ADL severity.These results can be mutually confirmed with the results from some other research(Guo et al.,2010;Wen et al.,2013)that ADLs in the Shiyang River Basin was dominated by S ADL and ES ADL,and the status of aeolian desertification was very severe.These results imply that SL ADL and M ADL in the Shiyang River Basin are easily changed,and if aeolian desertification control measures are apllied to SL ADL and M ADL,it will reduce the ADL in this area more quickly.
In addtion,based on these findings,it can be in‐ferred that in areas dominated by SL ADL and M ADL,where the DI should be larger than in the Shi‐yang River Basin,the ADLs there will be less stable than those in the Shiyang River Basin.Moreover,a question arises as to the general rule that ADLs in arid areas are more stable than those in semi-arid or subhumid areas.This question can only be answered when aeolian desertification monitoring for multiple periods throughout northern China is completed,which will be the focus of future research.
5 Conclusion
Through the visual interpretation of Landsat imag‐es,we monitored the status,trend,and spatial pattern of aeolian desertification in the Shiyang River Basin.The results reveal the severe status of aeolian deserti‐fication in the study area,and a worsening situation in Minqin County,that is,the irrational exploitation of groundwater caused a continuous increase of ADL ar‐ea in Minqin.The DI originally proposed in this study works well to identify areas with changes no matter the monitoring sub-periods.Based on DI results,we disclosed the stable status of aeolian desertification in the Shiyang River Basin,and the DI decreased with increasing ADL severity.
Through the aforementioned analysis,it can be clearly seen that desertification in the Shiyang River Basin is mainly affected by human activities,especial‐ly the water resources utilization mode and water re‐sources allocation between the upstream and down‐stream.To control desertification in the Shiyang River Basin,comprehensive,effective and long-term mea‐sures are necessary.Along with increased concerns from national and local governments paid to desertifi‐cation control in the Shiyang River Basin,and environ‐mental protection of Qilian Mountain,a series of eco‐logical policies including KMPSRB are being carrying out.Hopefully,these measure will alleviate the deserti‐fication status in the Shiyang River Basin in the future.
Acknowledgments:
This project was funded by The National Key R&D Program of China(2016YFC0500909)and the Interna‐tional Partnership Program of Chinese Academy of Sci‐ences(No.131B62KYSB20170031).Special thanks to NASA for their generous share of Landsat imagery.
 Sciences in Cold and Arid Regions2020年3期
- Sciences in Cold and Arid Regions的其它文章
- A modified numerical model for moisture-salt transport in unsaturated sandy soil under evaporation
- Editors-in-Chief Yuanming Lai and Ximing Cai
- Numerical simulations on cutting of frozen soil using HJC Model
- Quantitatively estimate the components of natural runoff and identify the impacting factors in a snow-fed river basin of China
- A meta-analysis of the impacts of forest logging on soil CO2 efflux
- Fast genetic mapping in barley:case studies of cuticle mutants using RNA-sequencing