
Design of a variable frequency comb reflectometer system for the ASDEX Upgrade tokamak
2020-06-28 06:14HAPPELKASPAREKHENNEQUINFLERHONORandtheASDEXUpgradeTeam
Plasma Science and Technology 2020年6期
T HAPPEL, W KASPAREK, P HENNEQUIN, K HÖFLER,4, C HONORÉ and the ASDEX Upgrade Team
1 Max-Planck-Institut für Plasmaphysik, Boltzmannstr. 2, 85748 Garching, Germany
2 IGVP, Universität Stuttgart, Pfaffenwaldring 31, 70569 Stuttgart, Germany
3 Laboratoire de Physique des Plasmas, CNRS, École Polytechnique, Sorbonne Université, F-91120 Palaiseau, France
4 Physik-Department E28, Technische Universität München, James-Franck-Str. 1, 85748 Garching,Germany
Abstract Comb reflectometers offer the advantage of measuring several radial positions in plasma simultaneously. This allows for the investigation of fast timescales during L-H transitions,I-phases, I-mode bursts, transients during heat wave propagation, etc. A drawback of many present-day systems is that they use a fixed frequency difference between the probing frequencies.Hence,although the central probing frequency can be varied,the probing frequency difference is usually fixed.The new design presented in this work uses an advanced microwave generation and detection scheme, which allows for arbitrary probing frequencies and probing frequency separations.
Keywords: reflectometry, microwaves, plasma diagnostic, reflectometer, turbulence(Some figures may appear in colour only in the online journal)
1. Introduction
A detailed understanding of physics processes in magnetic confinement fusion plasmas is of high importance in order to facilitate predictions for future devices,and possibly for their optimization in terms of efficiency. To obtain such a detailed understanding, detailed measurements of relevant physics quantities are required. Usually, not only good spatial and temporal resolution for a measurement is desired,but also that the measurement can be obtained at various radial locations in the plasmas at the same time. To this end, various diagnostic methods usually employ different lines of sight.
In the case of fluctuation reflectometry or Doppler backscattering, various radial positions can be probed by using different probing frequencies, since these reflect at different densities (O-mode) and additionally magnetic field strengths (X-mode). For fluctuation reflectometry and Doppler backscattering applications, usually the probing of different radial positions is obtained by using frequency hopping reflectometer systems [1–3]. These systems can change the probing frequency typically within less than a millisecond,which means that radial profiles of plasma parameters can usually obtained within 50–100 ms, depending on the radial resolution and radial coverage chosen.
A somewhat different concept is based on the launch of several probing frequencies simultaneously into the plasma and their simultaneous detection [4–14]. In this way, the information of several radial positions is obtained at the same time. Several drawbacks have previously prevented these systems from becoming the standard of reflectometer probing techniques, which is still the hopping system. First, the probing frequency difference has so far mostly been constant(excluding [12]). Second, the detection part of such a reflectometer has to be significantly more advanced and complex than for a hopping system. Third, since a comb reflectometer requires the data of various probing frequencies acquired simultaneously,the data acquisition system is also a critical part of a comb reflectometer.
This paper presents the design of a new comb reflectometer system for the W-band of frequencies (75–110 GHz)to be built for use on the ASDEX Upgrade tokamak (AUG).A variable frequency difference will be implemented,enabling measurements at arbitrary radial separations. Furthermore, the center frequency of the comb can be moved over the whole W-band, resulting in a high flexibility of the system. Two emitter concepts are proposed, one is based on two-tone input into the frequency multiplier,while the other is based on three-tone input.While these concepts will probably yield somewhat less signal-to-noise ratios than the systems based on nonlinear transmission lines [5, 7, 9, 11], they are expected to be significantly more flexible.
This paper is organized as follows: section 2 introduces the hardware concepts of two-tone (2.1) and three-tone (2.2)input into the multiplier, followed by the detection chain(2.3). In section 3 experimental measurement results are presented from both laboratory and an AUG plasma,followed by a summary in section 4.
2. Hardware concepts
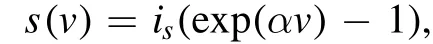
Several methods exist for the generation of a comb of frequencies, of which the most common one is probably the usage of a so-called nonlinear transmission line [5, 7, 9, 11].For the methods presented below, the nonlinear behavior of frequency multipliers is exploited. Therefore, the operational concept is briefly summarized.
It should be noted that real multipliers are significantly more complex than this simple example. For instance, the filtering in the W-band is obtained by building the multiplier such that several undesired harmonics are canceled out internally. Nevertheless, this simple exercise is useful to understanding the mixer output investigated in the following.
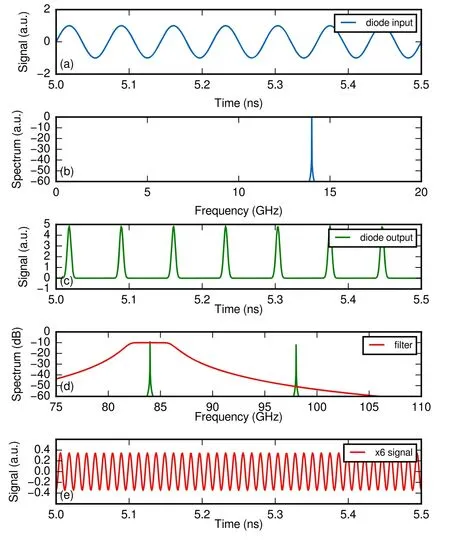
Figure 1.Harmonic generation of a typical frequency multiplier.(a) Diode input signal, (b) its spectrum, (c) diode output, (d) its corresponding spectrum (green), and the filter (red) used to obtain the (e) multiplied signal.
2.1. Two-tone input to multiplier
In section 2, a single frequency was used as input into the ×6-multiplier. If two frequencies are used, f1and f2, so-called intermodulation products will be generated on the output,which consist of 6f1, 5f1+f2, 4f1+ 2f2, 3f1+ 3f2, 2f1+ 4f1,f1+5f2, 6f2. This method hasbeenexplored in the context of Doppler backscattering previously on TCV [12].
In fgiure 2 the result of using two frequencies(f1=14 GHz, f2=16 GHz) as an input into the multiplier is depicted. As before, fgiure 2(a) shows an excerpt from the time trace of the diode input signal, and fgiure 2(b) shows the corresponding spectrum. The beat frequency fb=f2-f1=2 GHz is visible in the growth and the decay of the input signal(blue line)on a 0.5 ns timescale(periodT= 1 (f2-f1)).In the spectrum,two peaks are visible.The output of the diode is again shown in green in figure 2(c).In this case,the nonlinearity creates spikes of somewhat different shape than before.The spectrum of the signal after the diode(figure 2(d))shows again the harmonics and additionally the aforementioned intermodulation products.Specifically, and of importance for this application, there is a comb of frequencies in the W-band region between 6f1=84and 6f2=96 GHz, with the power the strongest in the center, at 90 GHz. This will also be seen in the plasma tests later (cf section 3.3). As above, appropriate bandpass filtering will result in the desired frequency comb in the W-band range of frequencies.This concept has been tested both in the laboratory and
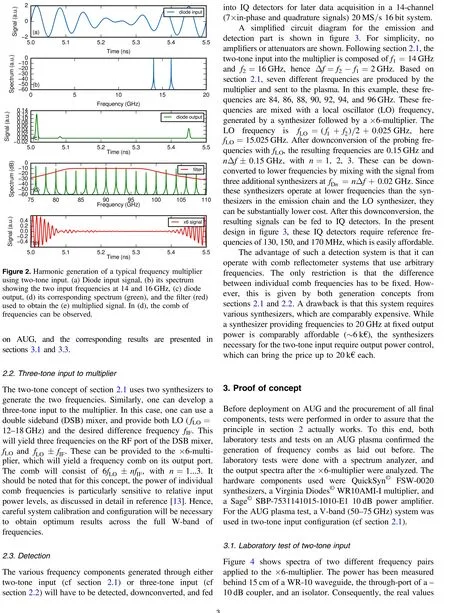
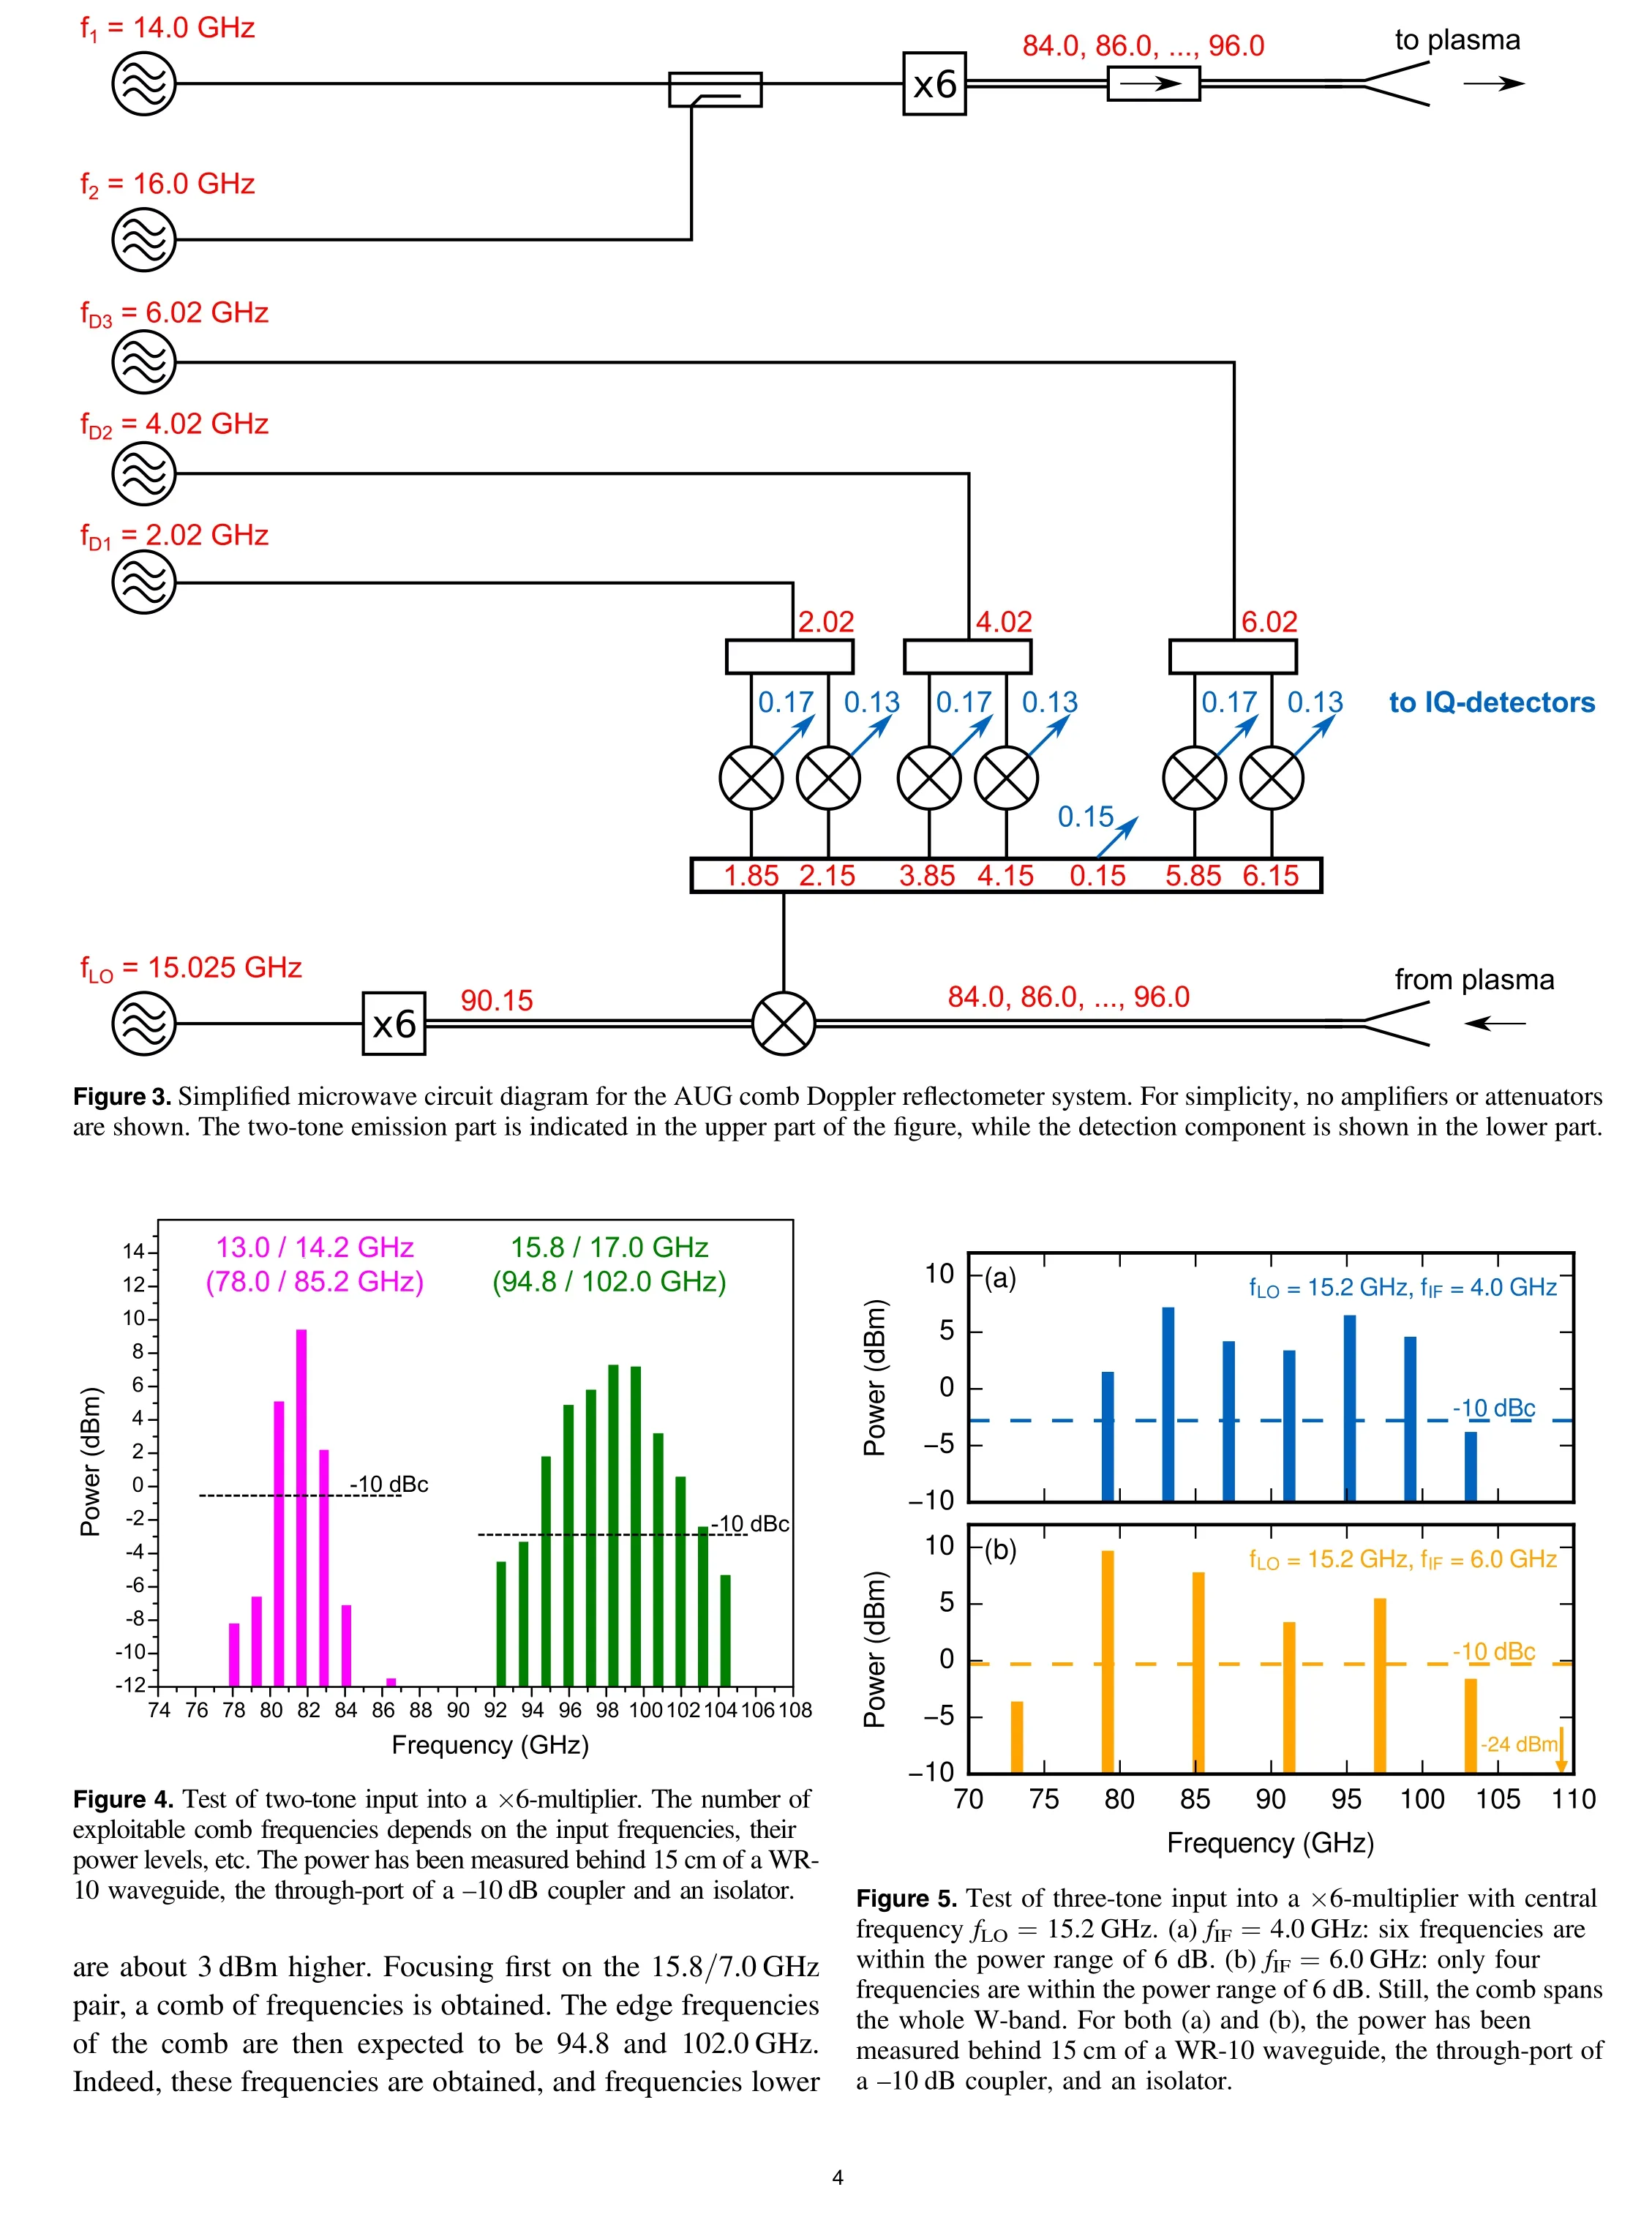

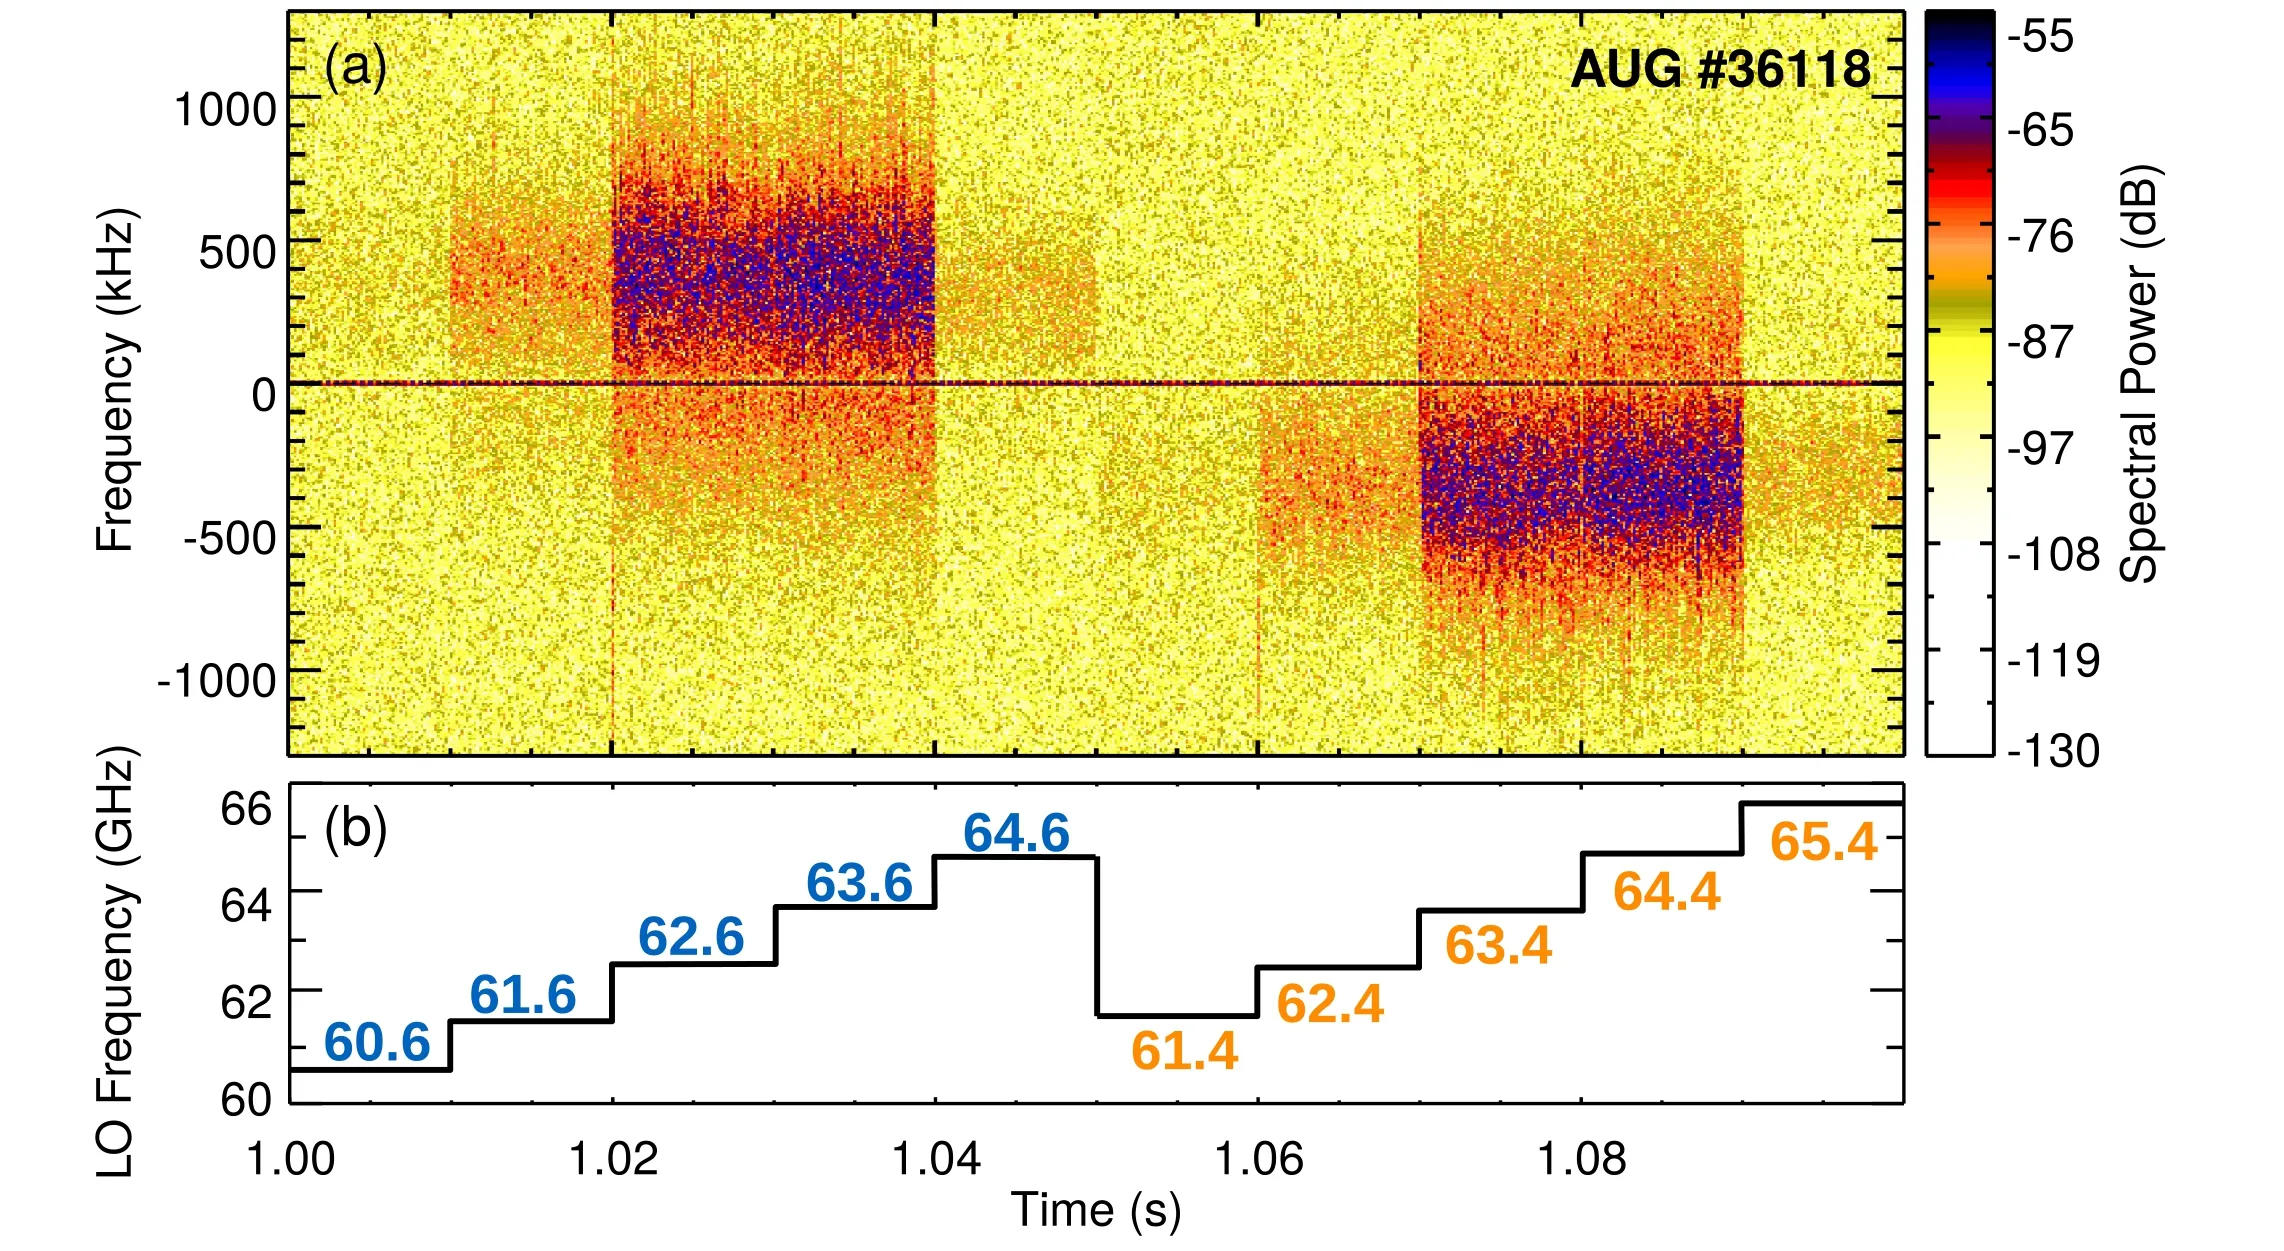
Figure 6.Test of two-tone input on a plasma in AUG.The spectrogram of a 100 ms time sequence,where different probing frequencies are analyzed by stepping the local oscillator frequency (b). For details, refer to the text.
In contrast, using a different combination of input frequencies(13.0/14.2 GHz),the spectrum after the×6-multiplier is significantly more peaked, i.e. only three out of the seven desired frequencies are inside a 10 dBc power window. The remaining frequencies are at significantly lower input powers(<-15 dBc),which is probably due to the non-optimized input power levels and non-optimum components involved. If this configuration was used in the experiment,this would mean that the low-power frequencies might be difficult to detect,or at least have insufficient signal-to-noise ratios. However, it should be pointed out that these are first tests,and further optimizations are ongoing in order to improve the resulting spectra.
In summary, frequency comb generation via two-tone input works, and a test system can be set up comparably easily. However, significant work is required in the optimization of different frequency inputs into the multiplier. It is likely that a lookup table has to be constructed with optimum input power levels for each combination of frequencies foreseen to be used in the final system.
3.2. Laboratory test of three-tone input
The method of three-tone input into the×6-multiplier has also been investigated in the laboratory.The DSB mixer used was a Marki©MMIQ-0520L model.For double sideband generation,the LO port and only one of the two in-phase and quadrature ports (with similar results) were used. The first results are shown in figure 5. In this example, fLO=15.2 GHz. In figure 5(a), the intermediate frequency is fIF=4.0 GHz. The resulting frequencies in the W-band have comparable power levels, which will give good signal-to-noise ratios once the system is deployed for operation on AUG. The measurement setup was as presented in section 3.1, so real values are about 3 dBm higher. The central frequency, 91.2 GHz, is somewhat lower than the other comb frequencies. This result is obtained when the multiplier output is adjusted such that the 10 dB power amplifier is in mild saturation.Six frequencies are within 6 dB, which is a good result for a comb reflectometer with variable center frequency and variable frequency separation.In
figure 5(b), the frequency difference is fIF=6.0 GHz. In this case, only four frequencies lie within 6 dB power and the frequency at 109.2 GHz is at a level that cannot be used for a Doppler backscattering experiment. Still, apart from the frequency at 109.2 GHz, a comb spanning the whole W-band is generated,which is a good confirmation of the results expected from section 2.2.
3.3. Experimental verification of two-tone input on an AUG plasma
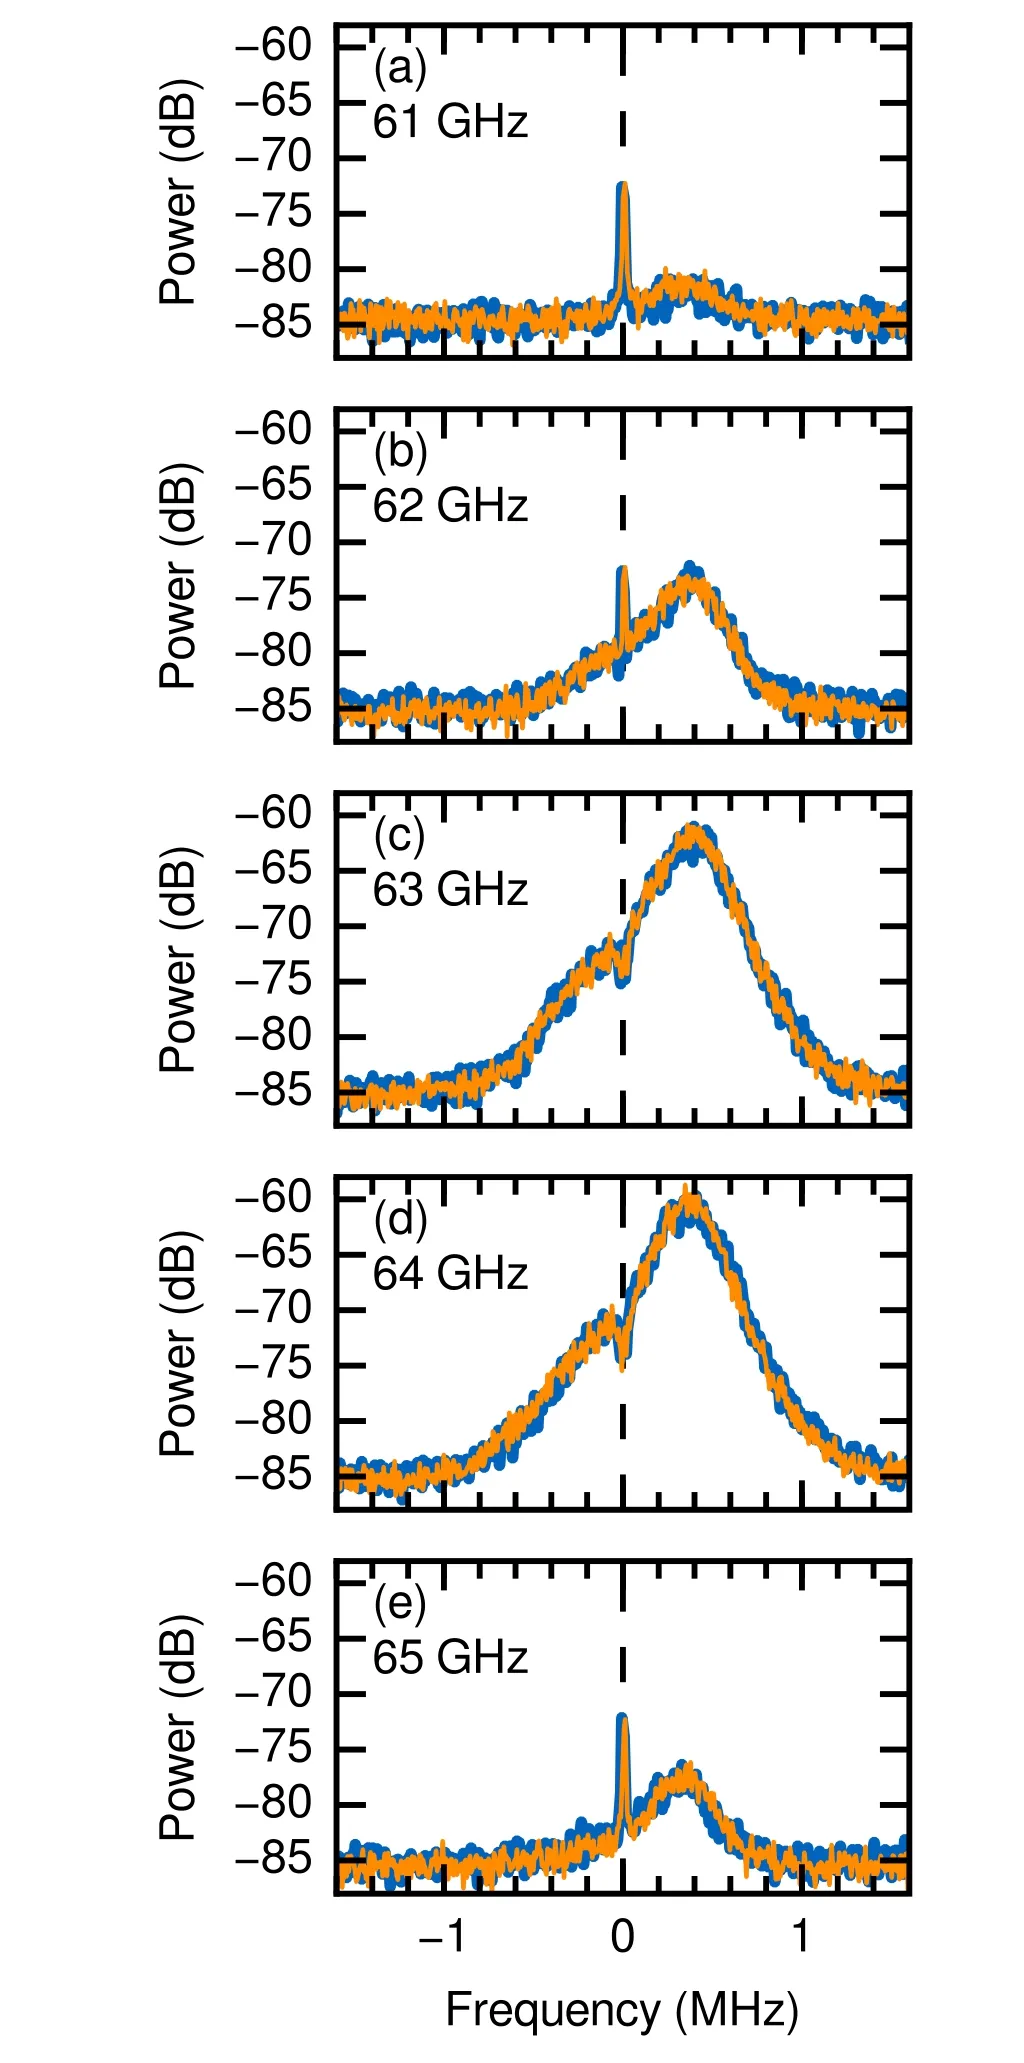
Figure 7. Spectra obtained from a system based on two-tone input into the multiplier from the AUG tokamak. The center frequencies show the largest power(-60 dB in(c)and(d)).Although the power is significantly lower at 61 and 65 GHz, a Doppler shifted peak is still visible. For details refer to the text.
A system working in the V-band of frequencies(50–75 GHz)is used to test the reliable operation of two-tone input into the multiplier. Since for the present V-band system [15] a ×4-multiplier is used, a comb with five frequencies is expected following the argument in section 2.1. For the present test,two synthesizers were used to generate the ×4-multiplier input at f1=15.25 GHz and f2=16.25 GHz. After the multiplier,a comb is expected with the frequencies of 61,62,63,64,and 65 GHz.These frequencies are sent to the plasma,and the backscattered wave is analyzed. Since no dedicated system was available to detect a comb of frequencies,the LO frequency was stepped in 1 GHz steps from 60.6–64.6 GHz,and then from 61.4–65.4 GHz. The two different patterns should result in the same backscattered spectra, but with the frequency axis reversed.
A spectrogram of this setup is shown for a 100 ms time window of AUG discharge#36118, which was in the L-mode during this time window, as shown in figure 6(a). The LO frequency is stepped every 10 ms, which results in the frequency pattern shown in figure 6(b).There is a Doppler shift visible for every probing frequency used. However, the strongest backscattered power is observed for the central frequencies, i.e. 63 and 64 GHz. The backscattered intensity at 62 and 65 GHz is significantly lower, and for 61 GHz, while visible, the backscattered power is very low. This is because the central frequencies are stronger when using a two-tone input than the ones corresponding to the edges of the generated comb spectrum.This is also visible in figure 2, where the peaks at 84 and 96 GHz are smaller than those at 88,90,and 92 GHz.In the test with plasma, this effect is more significant. However, it should be pointed out that the frequency comb in this test was generated with two synthesizers without output power control.It is highly likely that the power distribution among the different probing frequencies can be balanced much better than in figure 6(a).Another observation is that the Doppler shift goes from positive to negative frequencies when the intermediate frequency (IF)is changed from negative (-400 MHz) to positive (+400 MHz),which is to be expected, and a satisfying confirmation of the working principle of the two-tone input system.
The spectra of the backscattered wave are presented in figure 7 for the comb of five different probing frequencies.The blue spectra have been obtained by using the negative IF,and the orange spectra have been obtained using a positive IF,and have then been flipped. The spectra compare very well.The power drop from the strongest backscattered power(-60 dB in figure 7(d)) to the one with lowest backscattered power (-80 dB in figure 7(a)) is about 20 dB. As mentioned before, this can likely be at least partly avoided by using adequate multiplier input power levels in order to obtain a frequency comb of comparable power.
This result shows that a comb generation via the two-tone input method is possible, even without any optimizations in terms of ×4-multiplier input power, adaptation of power levels in the detection branch, or any filtering. Hence, the system is now being put forward, and it is expected to be operational in summer 2020 for deployment on AUG.
4. Summary
The design of a new comb reflectometer system for AUG has been presented. The system will work in the W-band of frequencies, and the comb will be generated either by two-tone or by three-tone input into a ×6-multiplier. The detection system is based on a two-step downconversion, which will provide the intermediate frequencies to be fed into standard IQ detectors. First laboratory tests and tests on an AUG plasma have shown the reliability of the concept.
The advantages of the presented concepts are that it can work at arbitrary frequencies and arbitrary frequency separations. Only the frequency separation between any two neighboring frequencies has to be the same. This will allow studies of the perpendicular velocity and its shear at various radial positions in the plasma simultaneously, radial propagation of events or the radial correlation measurement and its dynamic behavior.
Acknowledgments
This work has been carried out within the framework of the EUROfusion Consortium and has received funding from the Euratom research and training programme 2014–2018 and 2019–2020 under grant agreement No. 633053. The views and opinions expressed herein do not necessarily reflect those of the European Commission.
 Plasma Science and Technology2020年6期
- Plasma Science and Technology的其它文章
- Sensitivity of two drug-resistant bacteria to low-temperature air plasma in catheterassociated urinary tract infections under different environments
- First experimental results of intrinsic torque on EAST
- Gas pressure effect on plasma transport in a magnetic-filtered radio-frequency plasma source
- Optimization of plasma-processed air (PPA)inactivation of Escherichia coli in button mushrooms for extending the shelf life by response surface methodology
- Reconstruction of hollow areas in density profiles from frequency swept reflectometry
- Fullwave Doppler reflectometry simulations for density turbulence spectra in ASDEX Upgrade using GENE and IPF-FD3D