Ewing型热流计的原位地温梯度与甲板热导率的精确匹配
许明珠 张涛 沈中延 杨春国 管清胜,3 高金耀
研究论文
Ewing型热流计的原位地温梯度与甲板热导率的精确匹配
许明珠1,2张涛2沈中延2杨春国2管清胜2,3高金耀2
(1山东科技大学, 山东 青岛 266590;2自然资源部海底科学重点实验室, 自然资源部第二海洋研究所, 浙江 杭州 310012;3南京大学, 江苏 南京 210023)
由于Ewing型热流计具有安全性和便捷性的优点, 其在恶劣环境下的热流测量作业中得到广泛应用。使用Ewing型热流计测量热流值时, 通过原位测量获取海底沉积物的地温梯度, 并在实验室中测量沉积物样品的热导率。由于桩效应的原因, 即取样器的插入深度和所取样品长度并不一致, 热导率和地温梯度测量位置难以精确匹配, 其造成的误差可达3.5 mW·m–2。基于同一站位不同深度上的热流值较为一致的原则, 设计了“最小标准偏差法”来确定Ewing型热流计作业的最优偏移量。针对中国第9次北极科学考察采集的12个站位数据分析表明, 经最小标准偏差法改正后, 同一站位各深度上热流值的标准偏差从8.4 mW·m–2减小到3.8 mW·m–2, 其变化幅值约为平均热流值的9%。
北极 热流 热导率 地温梯度 最小标准偏差法
0 引言
海底热流是了解大洋地壳和岩石圈地幔热状态的重要方式, 对于研究地球内部热传输、大洋岩石圈演化、大陆边缘形成、板块俯冲过程以及热点岩浆作用等问题有重要意义[1]。同时, 海底热流也是认识天然气水合物的稳定区域和油气成藏状态的重要手段。目前测量海底热流主要有3种方法。Bullard最早提出了热流测量方法, 使用位于薄钢探头内的温度探针测量地温变化, 并在甲板测量热导率[2-3]。Ewing设计了第2种热流测量方法, 使用标准芯管获取沉积物样品, 同时使用安装在芯管外部的温度探针测量沉积物的原位温度[4]。第3种是由Lister设计的“弦”式探针, 通过固定在直径5—10 cm支架上的细长管状探针测量原位温度, 并利用可控热脉冲后的温度衰减来确定热导率[5-6]。
中国第9次北极科学考察在北冰洋使用Ewing型热流计测量了14个站位的热流数据。由于无法获取各站位的取芯率, 原位测量的地温值和甲板测量的热导率无法精确匹配, 导致简单匹配得到的热流值无法精确反映实际热流情况。目前的热流值主要反映了深部传导来的热量, 在不考虑热对流作用的情形下同一站位不同深度上的热流值应该较为一致。基于此判断原则, 本文中设计了“最小标准偏差法”应用于中国第9次北极科学考察中热流站位的温度梯度和热导率的位置匹配, 并对匹配效果进行了定量评价。
1 Ewing型热流计工作方式及位置匹配偏差
Ewing型热流计克服了Bullard型热流计测量时间过长、海底取样不同步等问题, 并且相对Lister型热流计具有较高的安全性和便捷性, 非常适合海底作业。Ewing型热流计结构如图1所示, 它由温度探针和重力柱组成。温度探针按一定距离安装在重力柱上, 并沿重力柱方向相互错开一定角度, 以尽量减小重力柱插入沉积物时前一支架的摩擦热对后面探针产生影响。温度探针随着重力柱一起下放, 在重力柱获取沉积物的同时得到沉积物内的平衡温度。在温度稳定的实验室使用热导率仪测量沉积物的热导率。

图1 Ewing型热流计结构示意图
Fig.1. Schematic diagram of Ewing heat flow meter
使用Ewing型热流计测量热流值时, 重力柱插入海底取样情况如图2所示。
由于桩效应的原因, 重力柱插入深度和取样长度是不一致的, 两者之间存在位置差ΔX (图2)。温度探针测量的是对应插入深度的原位温度, 实验室测量的是对应取样长度的热导率值, 两者之间的测量位置未精确对应, 所以需要重新调整热导率的位置, 使热导率和地温梯度可以最佳匹配。

图2 重力柱取样示意图. a)重力柱取样后的情况, b)重力柱插入沉积物的情况.图中黑色实点是每隔30 cm测量热导率的位置
Fig.2. Schematic diagram of gravity corer sampling. a) what happens after the sample is taken; b) what happens when the sediment is inserted. The solid black point in the figure is the position where the thermal conductivity is measured at an interval of 30 cm
2 中国第9次北极科学考察热流数据
在中国第9次北极科学考察中, 使用Ewing型热流计在北冰洋测量了14个站位的热流数据, 按照取样长度顺序将其编号为C1—C14(C13、C14站位数据无效), 其中站位C3、C5、C6、C8、C9和C10有4个地温梯度可用, 站位C1、C2、C4、C7、C11和C12有3个地温梯度可用。热流站位作业位置如图3所示。
中国第9次北极科学考察热流作业中, 重力柱上温度探针安装间隔为1 m, 每个站位安装4—5个温度探针, 在获取的沉积物上每隔30 cm打一个孔以测量热导率。每个孔测量5次热导率, 几乎所有孔都测量得到3个及以上有效数据[7]。多梯度和密集的热导率为校正匹配偏差提供了很好的数据支持。
本文中采用傅里叶定律计算热流值:

式中:λ,T(W·m–1·K–1)为经过现场压力和温度校正后的热导率,T(℃·km–1)是地温梯度。
2.1 地温梯度的计算
本文使用了“回归外推法”从原位测量温度计算地温梯度。该方法基于每个温度探针的温度(T)随时间(t)热衰减的长期近似(近似解)[8]:

图3 热流站位作业位置图. 图中红色点是热流作业位置
Fig.3. Heat flow station location map. The red dot in the figure is the position of heat flow operation

式中:(J·m–1)为探针插入沉积物摩擦产生的热量,(W·m–1·K–1)为热导率,T为沉积物的平衡温度。
采用与1/的线性回归,=0为传感器首次穿透沉积物的时间。当1/外推到接近0时, 假定达到了未受干扰的真实原位温度。根据每个温度探针的外推平衡温度计算得到原位梯度。探针稳定达到平衡温度时的温度和地温梯度如图4所示。
2.2 热导率的校正
中国第9次北极科学考察使用Teka公司的TK04型热导率测量单元测量了沉积物的热导率, 根据现场压力和温度条件, 校正了实验室测量值[9]:

式中: λP,T(W·m–1·K–1)为校正后的原位热导率, λlab(W·m–1·K–1)为实验室所测的热导率值, zw(m)为水深, ρ(g·cm–3)为沉积物密度, Tz(℃)为原位温度, Tlab(℃)为测量热导率时实验室的温度。改正后的热导率如图5所示,经过现场压力和温度校正后的热导率和实测热导率比值约为2.0%。
Fig.4. In situ temperature and geothermal gradient of typical station(C11). a) the in situ temperature when the temperature probe is stable; b) the geothermal gradient when the temperature probe is stable
3 最小标准偏差法及效果评价
热流的传递方式主要有热传导、热对流和热辐射这3种。由于海底沉积物的渗透率非常低[10],其热量传递方式主要为热传导, 因此通过Ewing型热流计测量得到的同一站位不同深度上的热流值应该较为一致。基于此原则认为同一站位中测量的不同深度上的热流值标准偏差最小时, 热导率和地温梯度为最优匹配, 即认为偏移量为ΔX, 文中以热流值标准偏差来表征热导率和地温梯度的匹配精度。本文认为不同深度上热导率和地温梯度的偏移量ΔX是相同的。

图5 典型站位(C11)的热导率校正图. 图中黑色实点是经过现场压力和温度校正后的热导率值, 蓝色点是实测的热导率值
Fig.5. Thermal conductivity correction diagram of typical station(C11). The solid black point in the figure is the thermal conductivity value after the field pressure and temperature correction, while the blue point is the measured thermal conductivity value
本文根据最下面温度探针到刀口的距离以及外业测量经验, 选取最大可能偏移量为50 cm, 每次计算增加5 cm的偏移量, 求出每个偏移量对应的热流值和标准偏差。典型站位(C11)的不同深度热流值随偏移量的变化如图6所示, 同一站位不同深度上热流值的标准偏差随偏移量的变化如图7所示。
典型站位C11不同深度上的热流值随着设置的偏移量而变化(图6), 从上到下的3个热流值变化范围分别为51.9—55.1 mW·m–2、54.3—55.2 mW·m–2和52.2—53.7 mW·m–2, 平均热流值从54.6 mW·m–2减少到52.8 mW·m–2。C1—C12站位在设定的50 cm偏移量内热流变化平均值为4.4 mW·m–2, 其中C10站位的变化最大, 可达12.3 mW·m–2, 因此需要我们使用最小标准偏差法找到最优偏移量。

图6 典型站位(C11)热流值随偏移量变化图. 图例中的1、2、3分别表示一个站位中测量的从上到下3个热流值随偏移量变化的曲线, 1为最上方的热流值, 2为中间热流值, 3为最下方热流值, 图中虚线是最优偏移量位置
Fig.6. Diagram of heat flow variation with offset for typical station (C11). In the legend, 1, 2 and 3 respectively represent the curves of the three heat flow values measured from top to bottom in a station position changing with the offset.1 is the heat flow value at the top, 2 is the middle heat flow value, and 3 is the heat flow value at the bottom, and the dotted line in the figure is the best offset position
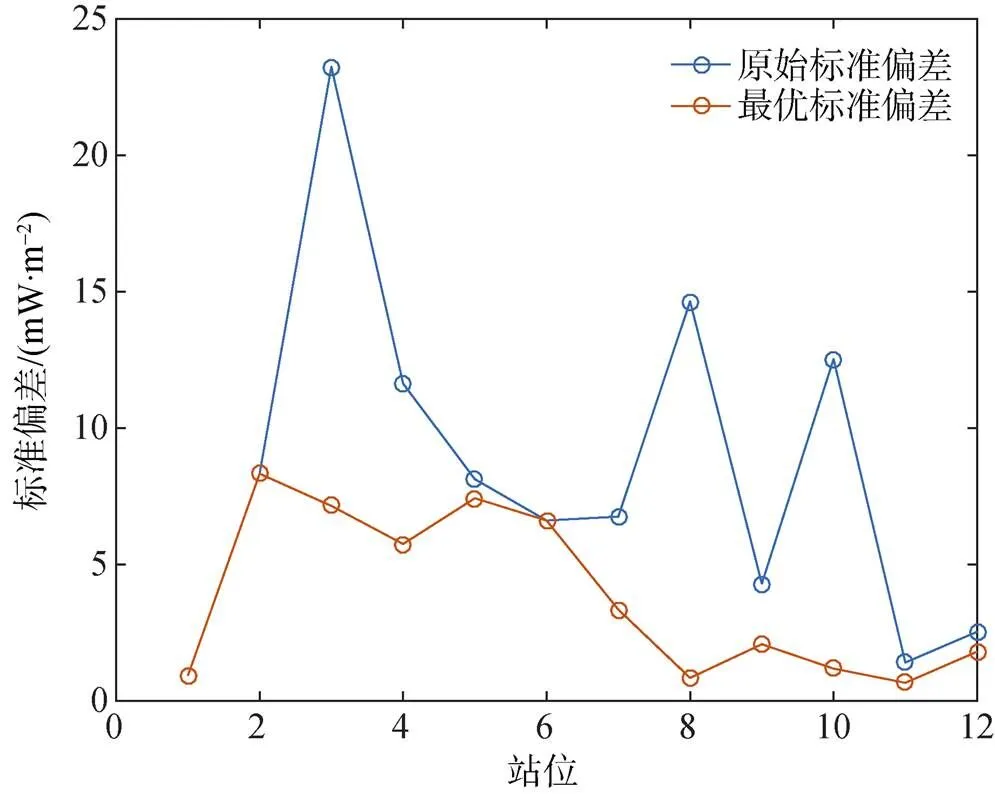
图7是12个站位热流数据的标准偏差随偏移量变化图。从图中可以看出标准偏差随着偏移量的不同而变化, 每个站位都存在一个最小标准偏差(图7虚线), 本文中认为最小偏差对应的偏移量是热导率和地温梯度匹配的最佳偏移量(表1)。各站位原始标准偏差和最优匹配标准偏差对比如图8所示。
使用“最小标准偏差法”对中国第9次北极科学考察12个站位热流数据处理后, 同一站位不同深度上热流值标准偏差最大变化范围是从23.2 mW·m–2减小到7.1 mW·m–2(C3), 热流值平均标准偏差从8.4 mW·m–2减小到3.8 mW·m–2, 其变化幅值约为平均热流值的9%, 热导率和地温梯度精确匹配后热流值精度提高3.5 mW·m–2(图8, 表1)。
热导率和地温梯度的最佳匹配偏移量ΔX和作业区海底底质情况以及桩效应有关。根据现场作业描述, 作业区海底底质基本上是一致的, 均是灰褐色黏土, 含少量粉沙, 所以本文认为偏移量ΔX只受到取样长度的影响。本文统计了取样长度和最优偏移量的关系, 如图9所示。

图7 标准偏差随偏移量变化图. 图中虚线是最小标准偏差对应偏移量的位置, 灰色阴影区是偏移量不确定度的范围
Fig.7. Standard deviation with offset variation. The dotted line in the figure is the position of the offset corresponding to the minimum standard deviation, and the gray shaded area is the range of offset uncertainty

图8 原始标准偏差和最优标准偏差对比图
Fig.8. Comparison chart of original standard deviation and optimal standard deviation
根据最小二乘拟合的趋势线可以看出最优偏移量随着取样长度的增大而增大, 当取样长度小于3 m时, 最优偏移量为0 m, 当取样长度到达4.2 m左右时, 最优偏移量增加到0.5 m(图9)。这表明插入深度越大, 所需偏移量也越大, 这也与重力柱取芯率的实际观察经验一致。
4 结论
“最小标准偏差法”可以很好地匹配热导率和地温梯度。经过偏移量校正后, 同一站位不同深度的热流值标准偏差有了明显的减少, 平均标准偏差从8.4 mW·m–2减小到3.8 mW·m–2, 其变化幅值约为平均热流值的9%。取样长度和最优偏差量有明显正相关关系, 即取样长度越长, 热导率和地温梯度的匹配偏移量越大。

表1 各站位最优偏移量和标准偏差

图9 取样长度和最优偏移量关系图. 图中红色直线是最小二乘拟合曲线, 误差棒表示偏移量不确定度的范围
Fig.9. Relationship between sampling length and optimal offset. The red line in the figure is the least squares fitting curve, and the error bar represents the range of offset uncertainty
1 李官保, 裴彦良, 刘保华. 海底热流探测技术综述[J]. 地球物理学进展, 2005, 20(3): 611-619.
2 Bullard E C, DAY A. The flow of heat through the floor of the Atlantic Ocean[J]. Proceedings of the Royal Society A: Mathematical, Physical and Engineering Sciences, 1954, 222(1150): 408-429.
3 O'Regan M, Preto P, Stranne C, et al. Surface heat flow measurements from the East Siberian continental slope and southern Lomonosov Ridge, Arctic Ocean[J]. Geochemistry Geophysics Geosystems, 2016, 17(5): 1608-1622.
4 Gerard R, Langseth M G, Ewing M. Thermal gradient measurements in the water and bottom sediment of the western Atlantic[J]. Journal of Geophysical Research, 1962, 67(2): 785-803.
5 Lister C R B. The pulse-probe method of conductivity measurement[J]. Geophysical Journal of the Royal Astronomical Society, 1979, 57(2): 451-461.
6 Sclater J G, Hasterok D, Goutorbe B, et al. Marine Heat Flow[M]//Encyclopedia of Marine Geosciences. Springer Netherlands, 2014.
7 魏泽勋. 中国第九次北极科学考察现场报告[M]. 北京: 海洋出版社, 2020: 137-144.
8 Pfender M, Villinger H. Miniaturized data loggers for deep sea sediment temperature gradient measurements[J]. Marine Geology, 2002, 186(3): 557-570.
9 徐行, 施小斌, 罗贤虎, 等. 南海北部海底地热测量的数据处理方法[J]. 现代地质, 2006, 20(3): 457-464.
10 Snelgrove S H, Forster C B. Impact of seafloor sediment permability and thickness on off-axis hydrothermal circulation: Juan de Fuca Ridge eastern flank[J]. Journal of Geophysical Research, 1996, 101(B2): 2915-2925.
Accurate matching of in-situ geothermal gradients from a Ewing-type heat flow meter with deck thermal conductivity
Xu Mingzhu1,2, Zhang Tao2, Shen Zhongyan2, Yang Chunguo2, Guan Qingsheng2,3, Gao Jinyao2
(1Shandong University of Science and Technology, Qingdao 266590, China;2Key Laboratory of Submarine Geosciences, Second Institue of Oceanography, Ministry of Natural Resources, Hangzhou 310012, China;3Nanjing University, Nanjing 210023, China)
Ewing-type heat flow meters are widely used for heat flow measurements in harsh environments because of their safety and convenience. When using a Ewing-type heat flow meter, the geothermal gradient of seafloor sediments is obtained by in situ measurements while the thermal conductivity of sediment samples is measured in the laboratory. Due to the stake effect, the insertion depth of the sampler in situ is not always consistent with the length of a recovered sample, so it can be difficult to accurately match the measurement positions for thermal conductivity and geothermal gradients, leading to errors up to 3.5 mW·m–2. Based on the principle that heat flow values of the same station at different depths are relatively consistent, a minimum standard deviation method was designed in this study to determine the optimal deviation of Ewing heat flow meter operations. According to an analysis of data collected from 12 stations during China's ninth scientific Arctic expedition, the standard deviation of heat flow values at each depth of the same station decreased from 8.4 mW·m–2to 3.8 mW·m–2after the minimum standard deviation method was applied, which is a variation amplitude of about 9% of the average heat flow value.
Arctic, heat flow, thermal conductivity, geothermal gradient, minimum standard deviation
2019年10月收到来稿, 2019年12月收到修改稿
国家自然科学基金(41576065)资助
许明珠, 男, 1995年生。硕士研究生在读, 主要从事海洋地球物理的研究。E-mail:18263828928@163.com
张涛, E-mail: tao_zhang@sio.org.cn
10. 13679/j.jdyj.20190056

