Computational engineering analysis of external geometrical modifications on MQ-1 unmanned combat aerial vehicle
Prakash BAGUL, Zeeshan A. RANA, Karl W. JENKINS, La´szlo´ KO¨ NO¨ ZSY
Centre for Computational Engineering Sciences, Cranfield University, Cranfield MK43 0AL, United Kingdom
KEYWORDS Aerodynamics;CFD;Geometrical modifications;MQ-1 predator;Turbulent flows;Unmanned combat aerial vehicle;Unsteady Reynoldsaveraged Navier-Stokes
Abstract This paper focuses on the effects of external geometrical modifications on the aerodynamic characteristics of the MQ-1 predator Unmanned Combat Aerial Vehicle(UCAV)using computational fluid dynamics.The investigations are performed for 16 flight conditions at an altitude of 7.6 km and at a constant speed of 56.32 m/s. Two models are analysed, namely the baseline model and the model with external geometrical modifications installed on it. Both the models are investigated for various angles of attack from-4°to 16°,angles of bank from 0°to 6°and angles of yaw from 0°to 4°.Due to the unavailability of any experimental(wind tunnel or flight test)data for this UCAV in the literature,a thorough verification of calculations process is presented to demonstrate confidence level in the numerical simulations.The analysis quantifies the loss of lift and increase in drag for the modified version of the MQ-1 predator UCAV along with the identification of stall conditions. Local improvement (in drag) of up to 96% has been obtained by relocating external modifications, whereas global drag force reduction of roughly 0.5% is observed. The effects of external geometrical modifications on the control surfaces indicate the blanking phenomenon and reduction in forces on the control surfaces that can reduce the aerodynamic performance of the UCAV.
1. Introduction
Unmanned Aerial Vehicles (UAVs) are largely used for surveillance, monitoring, reconnaissance, data relay and data collection or to enter the area that is not safe for humans i.e., flood affected or contaminated areas. The UAVs specifically designed for combats can be termed as Unmanned Combat Aerial Vehicles (UCAVs) such as the MQ-1 Predator manufactured by the General Atomics Aeronautical Systems.External modifications on any UAV/UCAV(such as antennas,camera etc.) can plays an important role to gather the data such as digital aerial photographs, natural calamities (Earthquake,flood),communication and/or for geographical investigations.1However, at the same time, these external modifications can affect the performance of the aircraft,structurally and aerodynamically, due to their location/positions.This effect can be of high importance when the UAVs/UCAVs are designed for extreme conditions therefore it is essential to study their aerodynamic parameters for optimal designs.Generally, wind tunnel experiments can be an expensive option to test various configurations and thus perform design optimization, however, Computational Fluid Dynamics (CFD) have emerged as an excellent alternative due to the speed and accuracy offered by the advanced CFD algorithms.
Several CFD studies have been performed to investigate the behavior of unmanned aircraft,however,there is still a dearth of literature in this domain for the CFD comparison of UAVs,which can be due to various reasons such as commercial and/or defense.Recently,Pepelea et al.2performed a CFD analysis of a UAV at constant velocity of 30 m/s and 10 different angles of attack(α)from-6° to 18°,however,this did not cover any angle of bank(β)or angle of yaw(ψ).A similar study was presented by Prisacariu3where the authors investigated a blended wing geometry UAV,however,without any supporting data or a verification/validation mechanism. Although both of these investigations were of industrial nature, academia has also shown interest in this area which is still largely unexplored.In 2006, Hardie4analyzed the Van’s RV-8A using COSMOS Design STAR software to conclude that the aircraft design works well aerodynamically. They also suggested certain minor design improvements to enhance the aerodynamic capabilities of the UAV.Later in 2010,Sweeten5analyzed three different UAVs (YAK-54, the MantaHawk and the Meridian)using multiple software and high fidelity CFD. The results were compared and analyzed to investigate the stability and control of the UAVs under various conditions. Another effort was presented by Jayabalan et al.6in 2005, where they used reverse engineering for further analysis and development of the entire model of an unmanned flying wing air vehicle.Three dimensional laser profile scanning of the reflex air foil and fuselage, material research and selection and cost effective reconstruction of the non-conventional air foil was carried out. The effect of passive vortex generators was investigated by Zhen et al.7where they analyzed the aerodynamic characteristics of the Aludra UAV. In their work, both the experimental and numerical investigations were carried out at various angles of attack using a commercial software(ANSYS-FLUENT) to conclude that higher coefficient of lift could be obtained by placing the vortex generators near the separation points.
Choi et al.8analyzed the control surfaces of a commercial UAV using ANSYS software;forces and moments were calculated on different parts of aircraft.The purpose was to develop a low cost micro drone with maximum dimension of 15 cm to be used for imaging with an endurance of almost two hours and a high degree of autonomy and for squad-level combat environment. In 2014, Krishnamurthy et al.9investigated a UAV wing design;performed modifications on the wing geometry and studied the effect of minute changes on flow characteristics of the aircraft. For this, a virtual wind tunnel model was created and CFD analysis was carried out at various angle of attacks for each wing separately. Various aerodynamics characteristics such as lift, drag, stall angle, lift-to-drag ratio of each wing were determined. CFD simulations of a tiltrotor UAV configurations (TR-E2S1) were performed to investigate its aerodynamic characteristics by Kim and Chung.10As a result of their investigations, the control surfaces such as elevator and rudder were deflected and wing incidence angle was changed. Furthermore, the aerodynamic instabilities were analyzed with the variation of pitch and yaw angles.Finally,they concluded that a 12%scale wind tunnel test model is too small for accurate data collection, therefore, a high fidelity model for quantitative data comparison should be developed. Similarly, Lazim et al.11presented the CFD analysis and wind tunnel testing of a UAV with an external storage. As a result of this analysis, the effect of the external storage was observed to be significant at the lower surface of the wing and almost negligible at the upper surface of the wing at low angle of attack. The area of influence on the wing surface by storage interference was observed to increase with the increase in the airspeed.
Mamat et al.12presented aerodynamics behavior of a baseline design of a Blended Wing Body(BWB)aircraft,developed at MARA University of Technology(UiTM).They performed steady three dimensional CFD analysis of the BWB at Mach number 0.3 and wind tunnel experiments on 1/6 scaled model of the same at Mach number 0.1;lift and drag coefficients and pitching moment coefficients are measured at different angle of attack with a view to analyze the aerodynamics performance of the UAV.Brett et al.13examined the flow over the 1303 UCAV platform,with a focus on the behavior that causes the onset of pitch break at a Reynolds number of 5.6 million and Mach number 0.25 and wind tunnel flow visualizations of the experiment were performed to validate the numerical model. Casas et al.14designed and analyzed a UAV to be used for fire surveillance in Greece and California, where fire caused billions of dollars in damages and claimed hundreds of lives.The simulation was performed using Spartan Phoenix free stream conditions of 45 m/s airspeed at 0° angle of attack,and at 20 m/s airspeed with 80° angle of attack with pressure and temperature at 1 atm and 300 K, respectively. Rabbey et al.1performed CFD analysis and experimental testing of a UAV which then participated in an international competition SAE Aero Design West-2013 with a condition that empty weight of the UAV must be less than 2 lb and must fly with payload as heavy as possible for good scoring. Here again,CFD was utilized at the design stage to improve the design and aerodynamics parameters of the UAV. All the examples above(and many more15-18)highlight one common characteristic that the external modifications can affect the aerodynamics performance of aircraft especially the small sized UAVs where the effects can be even more pronounced.As experimental investigations can be expensive,CFD provides an excellent alternative and can help to analyze the effects of external modifications in an efficient yet accurate manner.
This work presents our investigations into the aerodynamics performance of MQ-1 Predator UCAV (see Fig. 119). Due to its applications, MQ-1 can carry various external payloads at any time and mounting of these modifications on any aircraft is a challenge for aerodynamicists,where the surface area of the fully loaded MQ-1 can be almost doubled(114 m2)than its baseline (56 m2) variant. Therefore, it is imperative that such a UCAV is designed for those external modifications and the aerodynamics performance in extreme conditions.

Fig. 1 MQ-1 Predator UCAV.19
2. MQ-1 Predator UCAV and its external geometrical modifications
Due to the nature of the MQ-1 Predator UCAV,the geometry is unavailable from the designers, however, several three dimensional models are available through GrabCAD19which are created by professionals. General specifications and characteristics of MQ-1.20Using these specifications a model of MQ-1 has been selected that matches the standard specifications (see Fig. 2). The basic data used during this study can be found in the Table 1. We present thorough investigations starting from the verification of the calculations as there is no experimental data available for validation. The verified computational setup is used to extend the investigations to analyze the effect of external modifications on the aerodynamics performance of MQ-1.
Three dimensional model of the MQ-1 Predator is shown in the Fig.3 which is utilized as the baseline model for this work.The external modifications that can be mounted on to this model can be the antennas, cameras and projectiles etc., as shown in the Fig. 4. In the modified model, the antennas are located at the top center of the fuselage section on the symmetry line whereas the camera is located at bottom side of nose section, again, on the symmetry line. The four projectiles are located at the bottom side of wings. As there was excessive detail present in the model, some surfaces are simplified and locally modified to avoid discretization errors. For simplification,the rotor blades present at the rear end of MQ-1 Predator are also removed from both the baseline and modified model(see Figs. 3 and 4).

Fig. 2 Geometrical dimensions of MQ-1 predator.

Table 1 Parameters used for computational modelling.

Fig. 3 Baseline model of MQ-1 Predator UCAV.

Fig. 4 Model of MQ-1 Predator UCAV with external geometrical modifications.
3. Governing equations and numerical approach
For compressible flows, the set of governing equations are derived through a combined conventional Reynoldsaveraging and a Favre-averaging (mass-averaging) procedure,where the physical fields of the instantaneous density ρ,velocity ui,temperature T and heat flux qjare decomposed into the sum of a mean and a fluctuating component21as

where the overbar stands for the conventional Reynoldsaveraging and tilde denotes the Favre-averaging procedure.Furthermore, for the sake of clarity, it is useful to distinguish between the fluctuating physical fields associated with Reynolds-and Favre-averaging procedures.Therefore,the single prime superscript denotes the fluctuating component of the conventional Reynolds-averaging procedure and the double prime superscripts stand for the mass-averaging procedure.According to Wilcox,21the set of Favre-averaged mean governing equations of compressible turbulent flows consists of the mass, momentum, energy conservation and the turbulent kinetic energy equations which can be written21as

where the mean pressure fieldthe total energy E, the heat flux vector qjand the turbulent kinetic energy k can be expressed by

where R is the universal gas constant,γ is the ratio of the speci-
fic heat at constant pressure cpand specific heat at constant volume cV,and λ is thermal conductivity.In the set of governing Eqs. (2)-(5), the viscous stress tensoris defined by

which is relying on the Navier-Stokes hypothesis,and where μ is the dynamic viscosity of the fluid, δijis the Kronecker delta which represents the unit tensor,21and the mean rate-of-strain(deformation) tensor can be expressed with Cartesian index notation21by

The Reynolds stress tensor in the governing equations of the mean flow Eqs. (2)-(5) is defined by

which is relying on the most commonly used Boussinesq hypothesis, and where μTis the dynamic eddy viscosity. It is important to note that the turbulent kinetic energy dissipation ε has to be modelled through an appropriate closure model.In the present study, we carried out detailed investigations through Unsteady Reynolds-Averaged Navier-Stokes(URANS) simulations where the well-known two-equation kε turbulence model21has been employed. The eddy viscosity k-ε model introduces two additional transport equations to the mass and momentum conservation Eqs. (2) and (3),therefore

is the turbulent kinetic energy k transport equation,where the turbulent kinetic energy dissipation ε is modelled through a transport equation as

where the dynamic eddy viscosity μTis defined by

and the model constants21are

Further details of the terms involved in the two-equation kε turbulence model can be found in.21,22It is important to mention that during the verification of calculations process, the one equation Spalart-Allmaras (SA) turbulence model23was also evaluated due to its excellent performance in aerodynamic flows. The Spalart-Allmaras (SA) model employs a transport equation for the kinematic eddy viscosity ν~t coefficient as

tis the destruction of the turbulent viscosity, and the model constants in the transport Eq. (14) are

The reader can see more details on the modelling of the productionand the destructionterms of the turbulent viscosityin the original work of Spalart and Allmaras.23In the present work, the commercial ANSYS-FLUENT software package has been used to perform all simulations using Finite Volume Method (FVM). Within the density-based compressible approach, Riemann solvers are employed and higherorder of accuracy is obtained using a second-order accurate Monotone Upstream Scheme for Conservation Laws(MUSCL) which is a Total Variation Diminishing (TVD)scheme and widely verified in industry and academia. Since,the velocity of UCAV is relatively low (low subsonic rang,i.e.,Ma=0.14),therefore,the governing equations are solved in the low Mach number regime which are mostly considered as incompressible flows.24A coupled scheme has been employed for solving the governing equations which allows the system of equations to converge faster and use less memory. In terms of spatial discretization, the gradient is selected as least square cell-based method and all quantities such as pressure, momentum, turbulent kinetic energy and turbulent dissipation rate are second-order accurate which is mostly used in the industry for satisfactory results.24
4. Computational setup and mesh sensitivity study
The computational domain selected is based upon the Mean Aerodynamic Chord (MAC) length, i.e., 0.913 m, such that the upstream is 50 MAC length and the wake is 100 MAC length to capture the wake correctly. A cylindrical domain is created such that the radius is 25 MAC lengths and a schematic diagram of the computational domain is shown in the Fig.5.The velocity inlet boundary conditions has been applied for the inflow with a velocity magnitude of 56.32 m/s and the turbulence intensity is fixed at 5%. The outlet zone is defined as the pressure-outlet as it allows to define the turbulence intensity and viscosity ratio which is set to 5% and 10%,respectively. The gauge pressure for the outlet is defined as 0 Pa, i.e., the atmospheric pressure. The outer cylindrical boundary is defined as the symmetry boundary with zero surface roughness. It is trivial to mention that all the surfaces on the UCAV geometry are considered as no-slip boundary condition.
First of all, due to the lack of any previous experimental and/or numerical solution available on this case, a thorough Grid Convergence Index (GCI) study has been conducted aligned with the recommendations and method suggested by Roache25and NASA26to verify the numerical computations.The objective of this GCI study is to establish a suitable grid resolution and hence computational resource requirements as well as to understand the performance of turbulence models to be used for the final analysis.In order to perform GCI study three levels of grids have been created (see Table 2). Further details on the Roache’s method for GCI can be found here.25
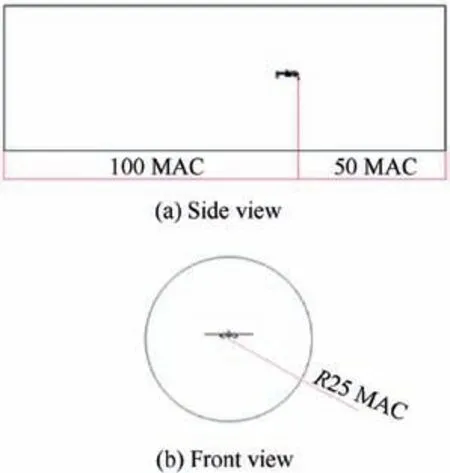
Fig. 5 Computational domain for MQ-1 Predator UCAV simulations.

Table 2 Computational meshes used for grid convergence study.
The hybrid mesh is generated with prism layer near the UCAV surface and tetrahedron cells above the prism layer where the inflation layer thickness is 0.054 m calculated based upon the parameter set for this case. The inflation layer consists of 20 grid points (for medium grid) all around the geometry to model the boundary layer where a growth rate of 1.2 is used. Fig. 6 presents various views from the coarse mesh where the skewness is kept in the range of 0.13 to 0.38 with few elements between 0.63 to 0.93 and is maintained below the recommended value of 0.95.27
The functional chosen for the GCI study is the drag coefficient (CD) for each grid level. Two turbulence models were analyzed during the GCI study, the k-ε turbulence model and the SA23model for their performance at this stage.According to Roache,25the GCI12is the GCI factor between the Fine and Medium mesh and the GCI23represent the GCI factor between the Medium and Coarse grid levels, are defined as in the Eqs. (16) and (17) below. The overall GCI for asymptotic range of convergence is calculated using Eq.(18) and the results are presented in Table 3. The GCI is defined as
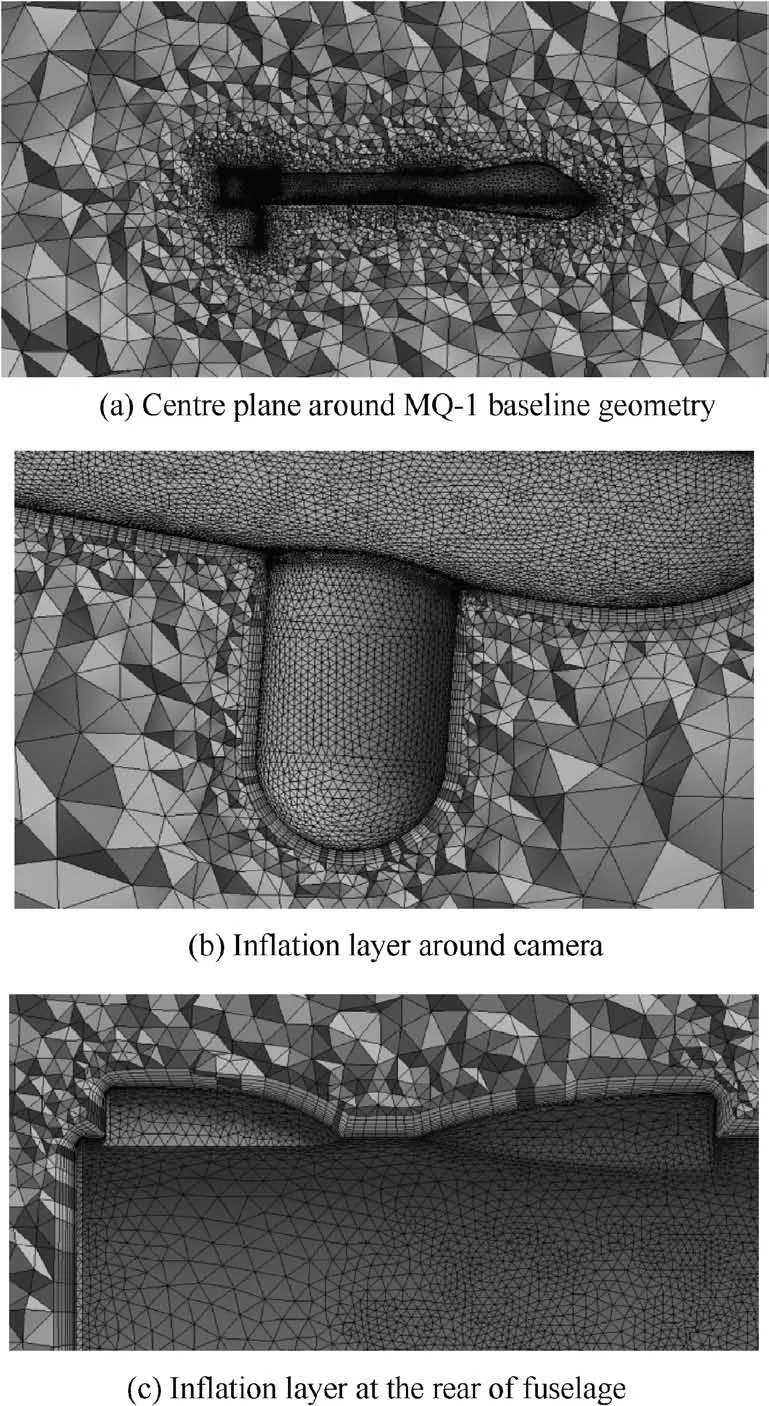
Fig. 6 Selected views from medium mesh level around MQ-1 baseline geometry.

Table 3 Results of grid convergence study for modelling of MQ-1UCAV.

where r is the grid refinement ratio and p is the order of accuracy.
The GCI for both the turbulence models provides almost the same results,however,the overall GCI for k-ε model is closer to 1(the asymptotic range of GCI)than the overall GCI for SA model,and hence this model has been selected for our analysis. We then analyzed the difference in the functional values of CDbetween the medium grid and the fine grid levels which is negligible with percentage change of 0.04%.This indicates a good grid convergence, thus, it would be plausible to use the medium grid resolution, however, we decided to use the fine grid level for our further analysis in this work. Using this numerical setup and the grid level, sixteen simulation cases are defined for different stall, rolling and yaw angles for both the baseline and modified models. The results are summarized in Table 4, where the speed and altitude remain constant as 56.32 m/s and 7620 m, respectively.
5. Results and discussion
5.1. Comparison of aerodynamic parameters
The lift is mainly generated by the wing when pressure at its lower surface is higher than the pressure at the upper surface due to some angle of attack where the lift force generated is in the upward perpendicular direction of airflow.28When flow separation starts near leading edge the flow becomes more turbulent. Higher angles of attack can result in stall; this phenomenon reduces the lift component and aircraft is unable to move forward. The stalling of the aircraft is dependent on the wing shape, turbulent air and Aspect Ratio (AR). The AR of the wing is defined28by:

As the MQ-1 UCAV has a tapered symmetric wing,Eq.(8)gives an aspect ratio of 22 and lift coefficient(CL)calculated is almost zero at an angle of attack of 0°.Investigations are performed on the baseline and modified geometry for various angles of attack(from-4°to 16°)and the comparative curves for both models are plotted.In the Fig.7,the lift coefficient is observed to be continuously increasing up to the angle of attack of 14°,however,after this,the lift coefficient drops indicating that the stall occurs at around 14°. Investigation on an additional angle of 16° confirms this finding.
The lift coefficient parameter is also investigated for the angles of bank (β) and angles of yaw (ψ) as shown in theFig. 7 (b) and (c), respectively. The effects of the angles of banking and yaw on the lift coefficient are investigated between 0° and 6° and 0°and 4°, respectively, but in isolation of the each other and the angle of attack (α). This is mainly due to the reason that we want to investigate the effects of each of these parameters individually to assess the performance and effect on the aircraft. For both the cases, it is found (as expected)that the net force(lift)decreases as the angle changes which is due to the resolution of lift into two components.However,the slope of decrease in the(CL)is steeper in the case of MQ-1 with modifications as compared to the baseline geometry. The percentage change in the lift coefficient with modifications is nearly 39% between banking angles of 0° and 6° as compared to the baseline case where percentage change is 29%between the same angles. Similarly, the percentage change in the lift coefficient with modifications is nearly 41% between the angle of 0° and 4° as compared to the baseline case where it is nearly 14% only.

Table 4 Parameters used for computational modelling of MQ-1.
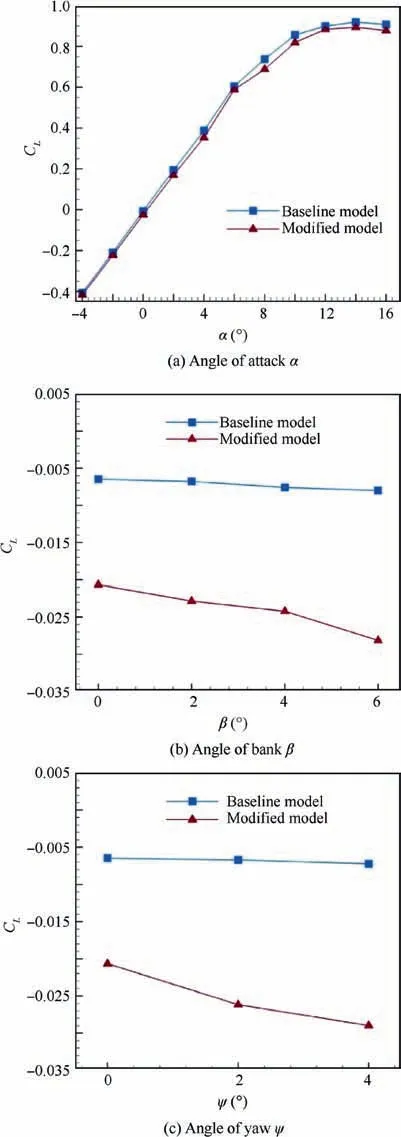
Fig. 7 Lift coefficient (CL) for MQ-1 baseline and modified geometry.
A visualization of the stalling phenomenon is presented on the UCAV wing as shown in the Fig. 8 at the stalling velocity of 27.77 m/s based on the basic data. In the Fig. 9, comparative visualization is presented for the angle of attack of 0°and 14° for the stream-wise velocity. At the angle of attack of 0°, the velocity over the wing is observed higher than the stalling velocity whereas at 14° the velocity on the wing appears to be very low and recirculation/separation region can be observed resulting in stall. Same stalling phenomenon is captured from the static pressure contours, as the pressure above the wing is observed to be dropped at the stalling angle of 14° as shown in Fig. 10.
Fig. 11 presents the stream-wise velocity contours on the symmetry plane of the UCAV at the angle of attack of 12°.The large recirculation zones behind the external modifications on the fuselage are presented here,which can increase the drag coefficient. A highly unsteady flow around the projectiles and other external modifications on the body of MQ-1 UCAV generates Turbulent Kinetic Energy(TKE)around the projectiles.Fig. 12 presents the generation of TKE in various directions and at various locations on the geometry of UCAV with external modifications. The TKE is captured in flight direction i.e.,stream-wise direction,and is observed increasing from nose to wing and reducing from wing to stabilizer as shown in Fig. 12(a). In Fig. 12(b), the TKE is captured in lateral direction of UCAV which shows that in the turbulent zone, TKE is more close to the wing and external modifications.
Drag being an opposite force to the thrust and parallel to the relative wind direction and perpendicular to the lift components.With increased angles of attack,bank or yaw,drag also increases because, firstly, it is directly proportional to the surface area and, secondly, the complex shapes of the external modifications can also contribute to this. The drag coefficient is investigated for various angles and is presented in the Fig. 13. It can be observed that the drag reduces from angles of attack between -4° and 0°, however, it then starts to increase from 0°to 16°which is due to the changes in the frontal area with the changes in the incident angle.The frontal area of modified model is,of course,larger than the baseline model,so drag coefficient is more for the modified model compared to the baseline model.As the UCAV stalls at an angle of attack of 14°, the drag coefficient is observed increased considerably around and beyond this angle.
Further the drag coefficients are investigated for the angles of bank between 0° and 6° and angles of yaw between 0° and 4°. Fig. 13(b) demonstrates that for an increasing banking angle the drag coefficient increases for both the baseline and modified models. However, drag coefficient for the modified model is much higher(almost double)than the baseline model;this could be due to the increased frontal area.Almost similar behavior is observed for the angle of yaw in Fig. 13(c). It means that the drag coefficient values are always in an increasing order if the aircraft is moving in any direction such as rolling,pitching or yawing,however,it can be noted that the slope of this change in drag coefficient is almost similar for both the baseline and modified cases. This opposite to the findings for the lift coefficient where it dropped drastically with the much steeper slopes as shown in the Fig. 7(b) and (c).
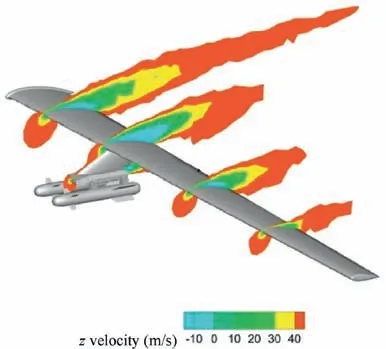
Fig. 8 Stalling phenomenon over wing of MQ-1 UCAV.

Fig. 9 Stream-wise velocity contours at projectiles on wings of MQ-1 UCAV for angle of attack of 0° and 14°.

Fig. 10 Static contours at projectiles on wings of MQ-1 UCAV for angle of attack of 0° and 14°.

Fig. 11 Stream-wise velocity contours at symmetry plane of MQ-1 UCAV showing recirculation zones behind external geometrical modifications.
Lift and drag force is generated at the center of pressure,whereas the thrust force is generated at the axis of engine and weight force is generated at the center of gravity of an aircraft. These four forces (lift, drag, thrust and weight) contribute towards the net moment of an aircraft. As the aircraft changes angle of attack, it creates moment about the lateral axis and generates pitching moment. When the aircraft changes the banking angle(about the longitudinal axis)a rolling moment is generated.Similarly for normal axis,when angle of yaw changes it generates the yawing moment. All moments act through the center of gravity.The moment coefficient(Cm)for the MQ-1 UCAV is investigated on both the baseline and modified models for various angles as shown in the Fig. 14.
Moment coefficient values are presented for various angles of attack in the Fig. 14(a). From -4° to 0°, the moment coefficient is observed to be increasing (in negative side), because the net force is acted in downward direction and observed exactly opposite for angles of attack of 0° to 16°. The rolling moment and yawing moments are also investigated for the various angles of bank and yaw and presented in the Fig. 14(b)and (c). As the net force is increased for bank and yaw angle,both the moments are also observed increasing.As net force is more for the modified model, hence all moment’s coefficients are also more compared to the baseline model. Considering the Fig. 14(b) it is observed that the moment coefficient changes drastically for the modified model such that the percentage change is roughly 300% as compared to the same for the baseline model.This is also indicated by the steep slope in the moment coefficient with respect to the banking angle.The significant changes in the rolling moment for the modified geometry can be attributed to the additional drag imposed on the geometry due to the modifications, which results in an unbalance at higher banking angles (β)and in turn may result in unstable flight.On the other hand,for the angles of yaw the slope of the moment coefficient of modified model is similar to the baseline case.
5.2. Effect of locations of external geometrical modifications
The identification of suitable locations for external modifications is one of the biggest challenges in aerodynamics; it is an optimization problem. It must be mentioned here that it is not the objective of this research to optimize the locations of the external modifications on the MQ-1 UCAV,but to analyze the effect of locations/positions on the overall aerodynamics. Optimization is a huge research area and can be investigated subsequently in line with the outcomes of this research. Here we are mainly interested in the overall effect of external modifications on the aerodynamic performance of the MQ-1 UCAV. The locations to install the external modifications should be such that it should produce less drag without effecting the aircraft performance.
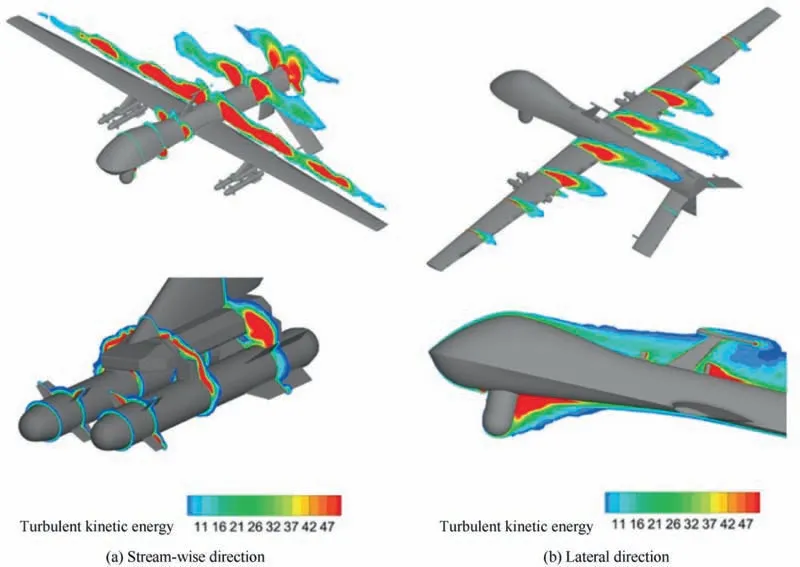
Fig. 12 Turbulent kinetic energy (TKE).
Old and new locations of antennas are shown in Fig.15.In this work,the two antennas at locations A and C are relocated to analyze the local and overall effects.The antenna at location A(we label this as the Antenna-1)is relocated to the location B to take the advantages of the larger antenna’s wake, so it is placed just behind it. The thickness of Antenna-1 is also less as compared to the larger antenna which should help. Cylindrical antenna (we call this the Antenna-2) at location C is placed just behind the camera to take advantages of camera wake. In both the cases, pressure is observed directly hitting the frontal large antenna and the camera,so it is expected that there would be less drag due to the small antennas.Simulation is performed for angle of attack 0° for both the baseline and modified models and velocity profiles clearly indicates, that because of wake region less drag is produced, as shown in Fig. 15.
Different drag values due to this arrangement along with old and new locations are summarized in Table 5. For Antenna-1, a decrease in drag of 1.64 kg is calculated which means that the drag force for the Antenna-1 at the new location C (the new location) is observed to be reduced by 18%by relocating it behind the larger antenna.On the other hand,for Antenna-2, drag is observed to be reduced considerably to 1.5 kg which is reduction of 96% in drag force for Antenna-2 at the new location D. An overall aircraft drag reduction of 48.33 kg is observed which translates to 0.5% reduction in overall drag of the MQ-1 UCAV by only relocating these two small antennas.It also indicates the possibility of installing further antennas(if required)on the MQ-1 UCAV without any effect on its performance. It must be noted that any reduction in the overall drag of the aircraft can be translated directly in to the cost effectiveness and even more importantly endurance and longer flight times for such UCAVs.
5.3. Effect of external geometrical modifications on control surfaces
So far we have analyzed the effect of relocating the external modifications on the aerodynamics of MQ-1 UCAV. Here we will analyze the effects of such modifications on the control surface on the UCAV under various flow conditions.The MQ-1 has inverted V-tail type horizontal stabilizers on left and right hand side along with the vertical stabilizer beneath the fuselage. The investigations are particularly focused on the horizontal and vertical stabilizers of MQ-1. Fig. 16 presents the overall picture of the flow around the UCAV for an angle of yaw of 4° where the streamlines are colored by the streamwise velocity.
The angle of yaw has been particularly selected as it ensures non-symmetrical flow on around the UCAV. For clarity the fuselage and wings are hidden from the view and only the stabilizers and modifications are made visible in Fig.17.Furthermore, Fig. 17(a) presents the streamlines around the UCAV without any external modifications. In the absence of any modifications, the streamlines appear very compact around the control surfaces. On the other hand, in Fig. 17(b), the streamlines are presented for UCAV with the camera and antennas installed (and visible). In this case, the streamlines appear to be spread around the control surfaces.More importantly, it can be observed that the flow velocity has reduced near the leading edge of the horizontal and vertical stabilizers.Such a condition when the flow upstream of control surfaces is grossly distributed (spread) is referred to as blanking.

Fig. 13 Drag coefficient (CD) for MQ-1 baseline and externally modified geometry.

Fig. 14 Moment coefficient (Cm) for MQ-1 baseline and externally modified geometry.
The blanking phenomenon is observed on control surfaces and reduced efficiency of control surfaces is concluded at the angle of yaw of 4°. Table 6 presents the resultant force comparison of the baseline and modified model for various control surfaces.Nearly 50%reduction in the resultant forces is experienced by the modified model on the Right Hand(RH)stabilizer, whereas due the angle of yaw the Left Hand (LH)stabilizer experienced slight increase (12%) of forces on the modified model. Net resultant force calculated for modified model is less compared to the baseline model at the control surfaces. However, for the vertical stabilizer not much difference in the forces has been observed.From these observations and calculations,it can be concluded that the addition of external modifications can have drastic effect of the aerodynamics and control of the MQ-1 UCAV. The analysis has been performed under averaged conditions for the UCAV. It can also be deduced that when operating under extreme conditions these negative effects would only be pronounced.

Fig. 15 New locations for external geometrical modifications,where antennas at locations A and C are moved to locations at B and D.

Table 5 Comparison of drag values on MQ-1 UCAV.

Fig. 16 Stream-wise velocity contours at symmetry plane of MQ-1 UCAV for new locations of the antennas.

Fig. 17 Effect of external geometrical modifications on control surfaces.

Table 6 Comparison of resultant forces on MQ-1 UCAV.
6. Conclusions
The investigation on the effects of modifications on MQ-1 Predator UCAV has been presented in this work. Emphasis was on the aerodynamic parameters, effect of locations of modifications on UCAV and the effect of external modifications on control surfaces. In this work, various angles of attack,bank and yaw are considered(in isolation to the others)to analyze the lift coefficient (CL), drag coefficient (CD) and moment coefficient (Cm) which are studied for baseline and modified UCAV geometry.It has been observed that the addition of external modifications can drastically affect the aerodynamic performance of the UCAV. The lift coefficient which has been observed to drop and the drag coefficient has been observed to be increased.The effects of relocating the external modifications at suitable locations such that they can reduce the drag can result in overall drag reduction of 0.5% globally whereas locally this can improve the drag by up to 96%. This proposed location is tentative in nature, but of course, several other important factor would play a major role in deciding these locations and need careful consideration at the design stage.It has also been identified that for the modified aircraft,the performance (efficiency) of control surfaces is effected by external modifications.As the MQ-1 UCAV is mainly for long range and endurance operations, any improvements in the aerodynamic characteristics and control strategies can help improve the overall behavior, performance and operational efficiency of the MQ-1 UCAV. All the findings in this paper indicate strong need to further analyze the MQ-1 Predator UCAV and the external geometrical modifications require careful consideration through optimization. Furthermore, the investigation of those cases when the lift coefficient is positive for positive angles of bank and yaw should also be considered as a future work.
Acknowledgements
This research was carried out on the Cranfield HPC facility(Delta). The authors would like to acknowledge support of the Dr. Michael Knaggs at the Cranfield HPC.
 CHINESE JOURNAL OF AERONAUTICS2020年4期
- CHINESE JOURNAL OF AERONAUTICS的其它文章
- Reliability and reliability sensitivity analysis of structure by combining adaptive linked importance sampling and Kriging reliability method
- Aeroelastic dynamic response of elastic aircraft with consideration of two-dimensional discrete gust excitation
- Thermal damage analysis of aircraft composite laminate suffered from lightning swept stroke and arc propagation
- An aerospace bracket designed by thermo-elastic topology optimization and manufactured by additive manufacturing
- Applications of structural efficiency assessment method on structural-mechanical characteristics integrated design in aero-engines
- An energy-based coupling degradation propagation model and its application to aviation actuationsystem
