Aeroelastic dynamic response of elastic aircraft with consideration of two-dimensional discrete gust excitation
Yang YANG, Chao YANG, Zhigang WU
School of Aeronautic Science and Engineering, Beihang University, Beijing 100083, China
KEYWORDS Aeroservoelastic;Discrete gust;Gust response;Gust response alleviation;Two-dimensional gust
Abstract Design loads generally require a one-dimensional discrete gust profile without consideration of the spanwise effect,and this profile cannot represent the true gust field exactly.For a high aspect ratio aircraft, two-dimensional gusts may cause critical load conditions,and approaches for calculating dynamic responses under two-dimensional discrete gust excitation are rarely presented.In this paper, a spanwise non-uniform vertical discrete gust field is established based on a onedimensional ‘1-cos’ gust profile in reference to a DARPA proposal, while frequency and hybrid approaches to the dynamic response analysis of flexible aircraft under this two-dimensional gust excitation are presented. Solution techniques have been applied to a high aspect ratio aircraft to assess the different response characteristics with a comparison between one-dimensional and two-dimensional discrete gust field conditions. The results show that the two-dimensional discrete gust model produces a higher bending moment than that of the one-dimensional condition.Therefore, the critical load conditions that are derived from the two-dimensional discrete gust for high aspect ratio aircraft should be seriously considered. According to the analysis, an active control scheme to alleviate the bending loads caused by the two-dimensional gust is designed, and alleviation effects in different gust conditions are compared.
1. Introduction
Aircraft will be inevitably exposed to atmospheric turbulence or gust during flight, and the extra aerodynamic forces on the structure, especially the wing, produced by the gust, could lead to some undesired dynamic responses of the aircraft.1Some intense turbulence could cause aircraft upset, passenger injury and possibly structure damage or failure.2Additionally,with the development of aerospace science and technology,high overload and low structure weight have become the main trends of flight performance, and these trends consequently cause the structure flexibility effect and greatly influence the magnitudes and distribution of wing loads.3Especially for High Altitude Long Endurance (HALE) aircraft with large aspect ratio wings,the gust influence that would cause an accident such as ‘Helios’ in 20034has become much more severe.Therefore, the dynamic response to atmospheric turbulence or gust should have an important position in the design of modern flight vehicles.5
The gust response of elastic aircraft has been studied in the past few years.However,these studies were mainly focused on rigid-elastic coupling modelling techniques6-10and aircraft geometric nonlinear problems.11,12In these studies, a onedimensional gust field was used, and this field was uniform spanwise for a vertical gust and uniform in the vertical direction for a lateral gust.13Softwares such as Nastran and ZAERO cannot calculate non-uniform gust response because the calculation approach for generalized gust forces assumes that a discrete gust is uniform in the wingspan direction.14-16However, a one-dimensional gust field is, to some extent, a specific assumption that may cause non-conservative evaluation of gust loads for large aspect ratio aircraft.
In Refs. 3,17-20, multi-dimensional continuous turbulence models were researched, and comparisons of one-dimensional and multi-dimensional continuous turbulence analyses performed on many aircraft, such as L-101,3C-5A19and B-2,20were discussed. The results in Ref. 3 showed that the effect of a three-dimensional analysis was to decrease the wing’s shear and bending moment responses.
However,the discrete gust response may be extraordinarily different from that of continuous turbulence. For a large aspect ratio wing, a significant amount of mass may be distributed along the span to minimize the root bending moment from an encounter with a spanwise uniform discrete gust. In this case, a non-uniform gust could create a greater bending moment.21Additionally, it is suggested in Ref. 21 that a non-uniform discrete gust should have a sine wave shape to incur a large root bending moment. Dussart and Lone proposed Multi-Dimensional Discrete Gust (MDDG) modelling technique based on a DARPA recommendation and an amplitude scaling method for MDDG to ensure that the maximum global gust intensity matched that of the conventional model.They also upgraded the gust model of the Cranfield Accelerated Aeroplane Loads Model (CA2LM) framework to calculate gust loads.22,23Dillsaver studied the effect of varying structural stiffness parameters on the response of a very flexible aircraft in the DARPA gust model.24Nevertheless, the problems of two-dimensional discrete gusts on flexible aircraft have not been deeply investigated except by the work of Dussart et al.22,23In addition, in Refs. 22,23, only the wing-root quantities were focused on. Other important responses, such as the distributed loads along the wing and accelerations,were also needed for further discussion. In addition, the aerodynamic model of the CA2LM was too high-order for the design of a gust alleviation system.25
In addition,with the development of control system theory,more gust alleviation control systems have been designed to ensure flight safety and improve aircraft performance. Wu et al.26projected three control schemes to alleviate wing-root moments and accelerations based on classic control theory.Karpel27presented a partial-feedback, constant-gain control law to minimize the mean square of gust response. Wang and Li28designed an adaptive feedforward controller to alleviate the gust load responses of highly flexible aircraft.Dillsaver et al.29used linear-quadratic-Gaussian control techniques to reduce an aircraft’s structural deflections. Haghighat et al.30developed a gust load alleviation system based on model predictive control that was improved by introducing an additional feedback loop. Alam et al.31applied a feedback controller to improve the robust performance of a feedforward controller in reducing wing-root moments. In Ref. 32, Zhao et al. developed an adaptive feedforward controller that used the preview information of the gust sensed by an onboard alpha probe to alleviate the gust-induced internal loads of a large transport airplane. The circular leaky least-mean-squared algorithm was applied to solve the problems of weight drift and weight bias in adaptive control. Even so, these methods were only applied to alleviate the gust responses of aircraft in the uniform gust zone, and the effect of the gust’s spanwise distribution was not considered.
The primary contributions of this study are building a twodimensional discrete gust model based on a DARPA proposal and presenting two-dimensional gust response analysis approaches(frequency and hybrid methods)and an alleviation technique. The approaches are applied to a high aspect ratio aircraft to determine whether a non-uniform spanwise gust model would produce additional design load conditions and the effect of a gust alleviation control system based on this two-dimensional gust.
2. Mathematical model
2.1. Model of two-dimensional discrete gust
A uniform gust field is assumed to exhibit a one-minus-cosine distribution, namely, a ‘1-cos’-shaped gust profile, whose orientation is normal to the path of the aircraft. The profile is given by:

where wg1is the gust velocity, Ude1is the derived equivalent gust velocity, Lgis the gust length, V is the velocity of the aircraft and t is the flight time.
A two-dimensional gust profile is based on a ‘1-cos’ gust with only vertical velocity, and spanwise amplitude variation is considered. Thus, one of the two-dimensional gust profiles is given by:21

where Ude2is the same as Ude1in Eq. (1), Lspanis the aircraft span,a is a factor that is used to represent the spanwise distribution of the gust, and y is the spanwise coordinate. Fig. 1 shows the gust model when the factor (a) is equal to 1.0.Fig. 2 represents the spanwise gust distribution with different values of a. As shown in Fig. 2, the two-dimensional gust approaches the one-dimensional gust with increasing a and degenerates into the one-dimensional gust when a is close to infinity.
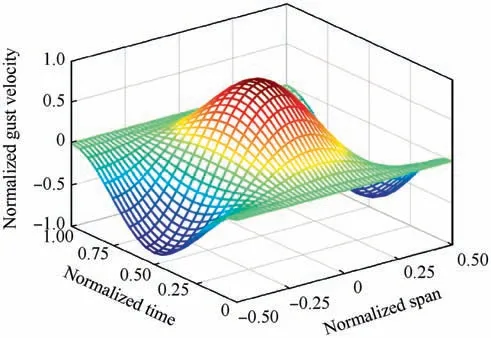
Fig. 1 Two-dimensional gust model (Normalized span: y/Lspan,Normalized time: Vt/Lg, Normalized gust velocity: wg2/USA).
2.2. Aeroelastic equation of motion
The aeroelastic equation of motion under a gust in generalized coordinates can be expressed as:16

where ξ is the rigid and elastic generalized coordinates, Mξξis the generalized mass matrix, Mξδis the generalized control coupling matrix, δ is the deflections of the control surfaces,Cξξis the generalized damping matrix, Kξξis the generalized stiffness matrix, Fξis the generalized aerodynamic force due to the rigid and elastic modes and the surface kinematic modes,and Fξgis the additional generalized aerodynamic force due to the gust.
2.3. Calculation of aerodynamics
The aerodynamic force obtained is calculated by the surface panel method theory. The pressure distribution matrix can be written as follows:

where Δp is the pressure distribution matrix,ρ is the density of air,DAis the aerodynamic influence coefficient matrix and w-is the downwash velocity matrix.
2.3.1. Aerodynamics caused by structural motion
For a thin wing surface,the downwash velocity on the collocation points is related to the modes of flight as follows:

where q is the vector of generalized coordinates,φ is the modal matrix on the collocation points, φ′=, x is the chordwise location of the collocation point, b is the reference length,and k is the reduced frequency, where k=bω/V and ω is the circular frequency.
According to the definition, the generalized aerodynamic force is as follows:

where φPis the modal matrix at the centres of pressure,S=diag[ΔS1,ΔS2,···,ΔSn] is the area-weighted matrix and ΔSiis the area of the ith aerodynamic box.
Therefore, the generalized aerodynamic force is as follows:

The downwash velocities caused by the rigid and elastic modes and the control surface modes are as follows:

where φξis the rigid and elastic modal matrix, ξ is the vector of modal coordinates,φδis the modal matrix of the deflection of the control surfaces and δ is the vector of modal coordinates of the control surfaces’ deflection.
The generalized aerodynamic force is as follows:

This function can be written as follows:

The aerodynamic force in Eq.(3)in frequency domain is as follows:


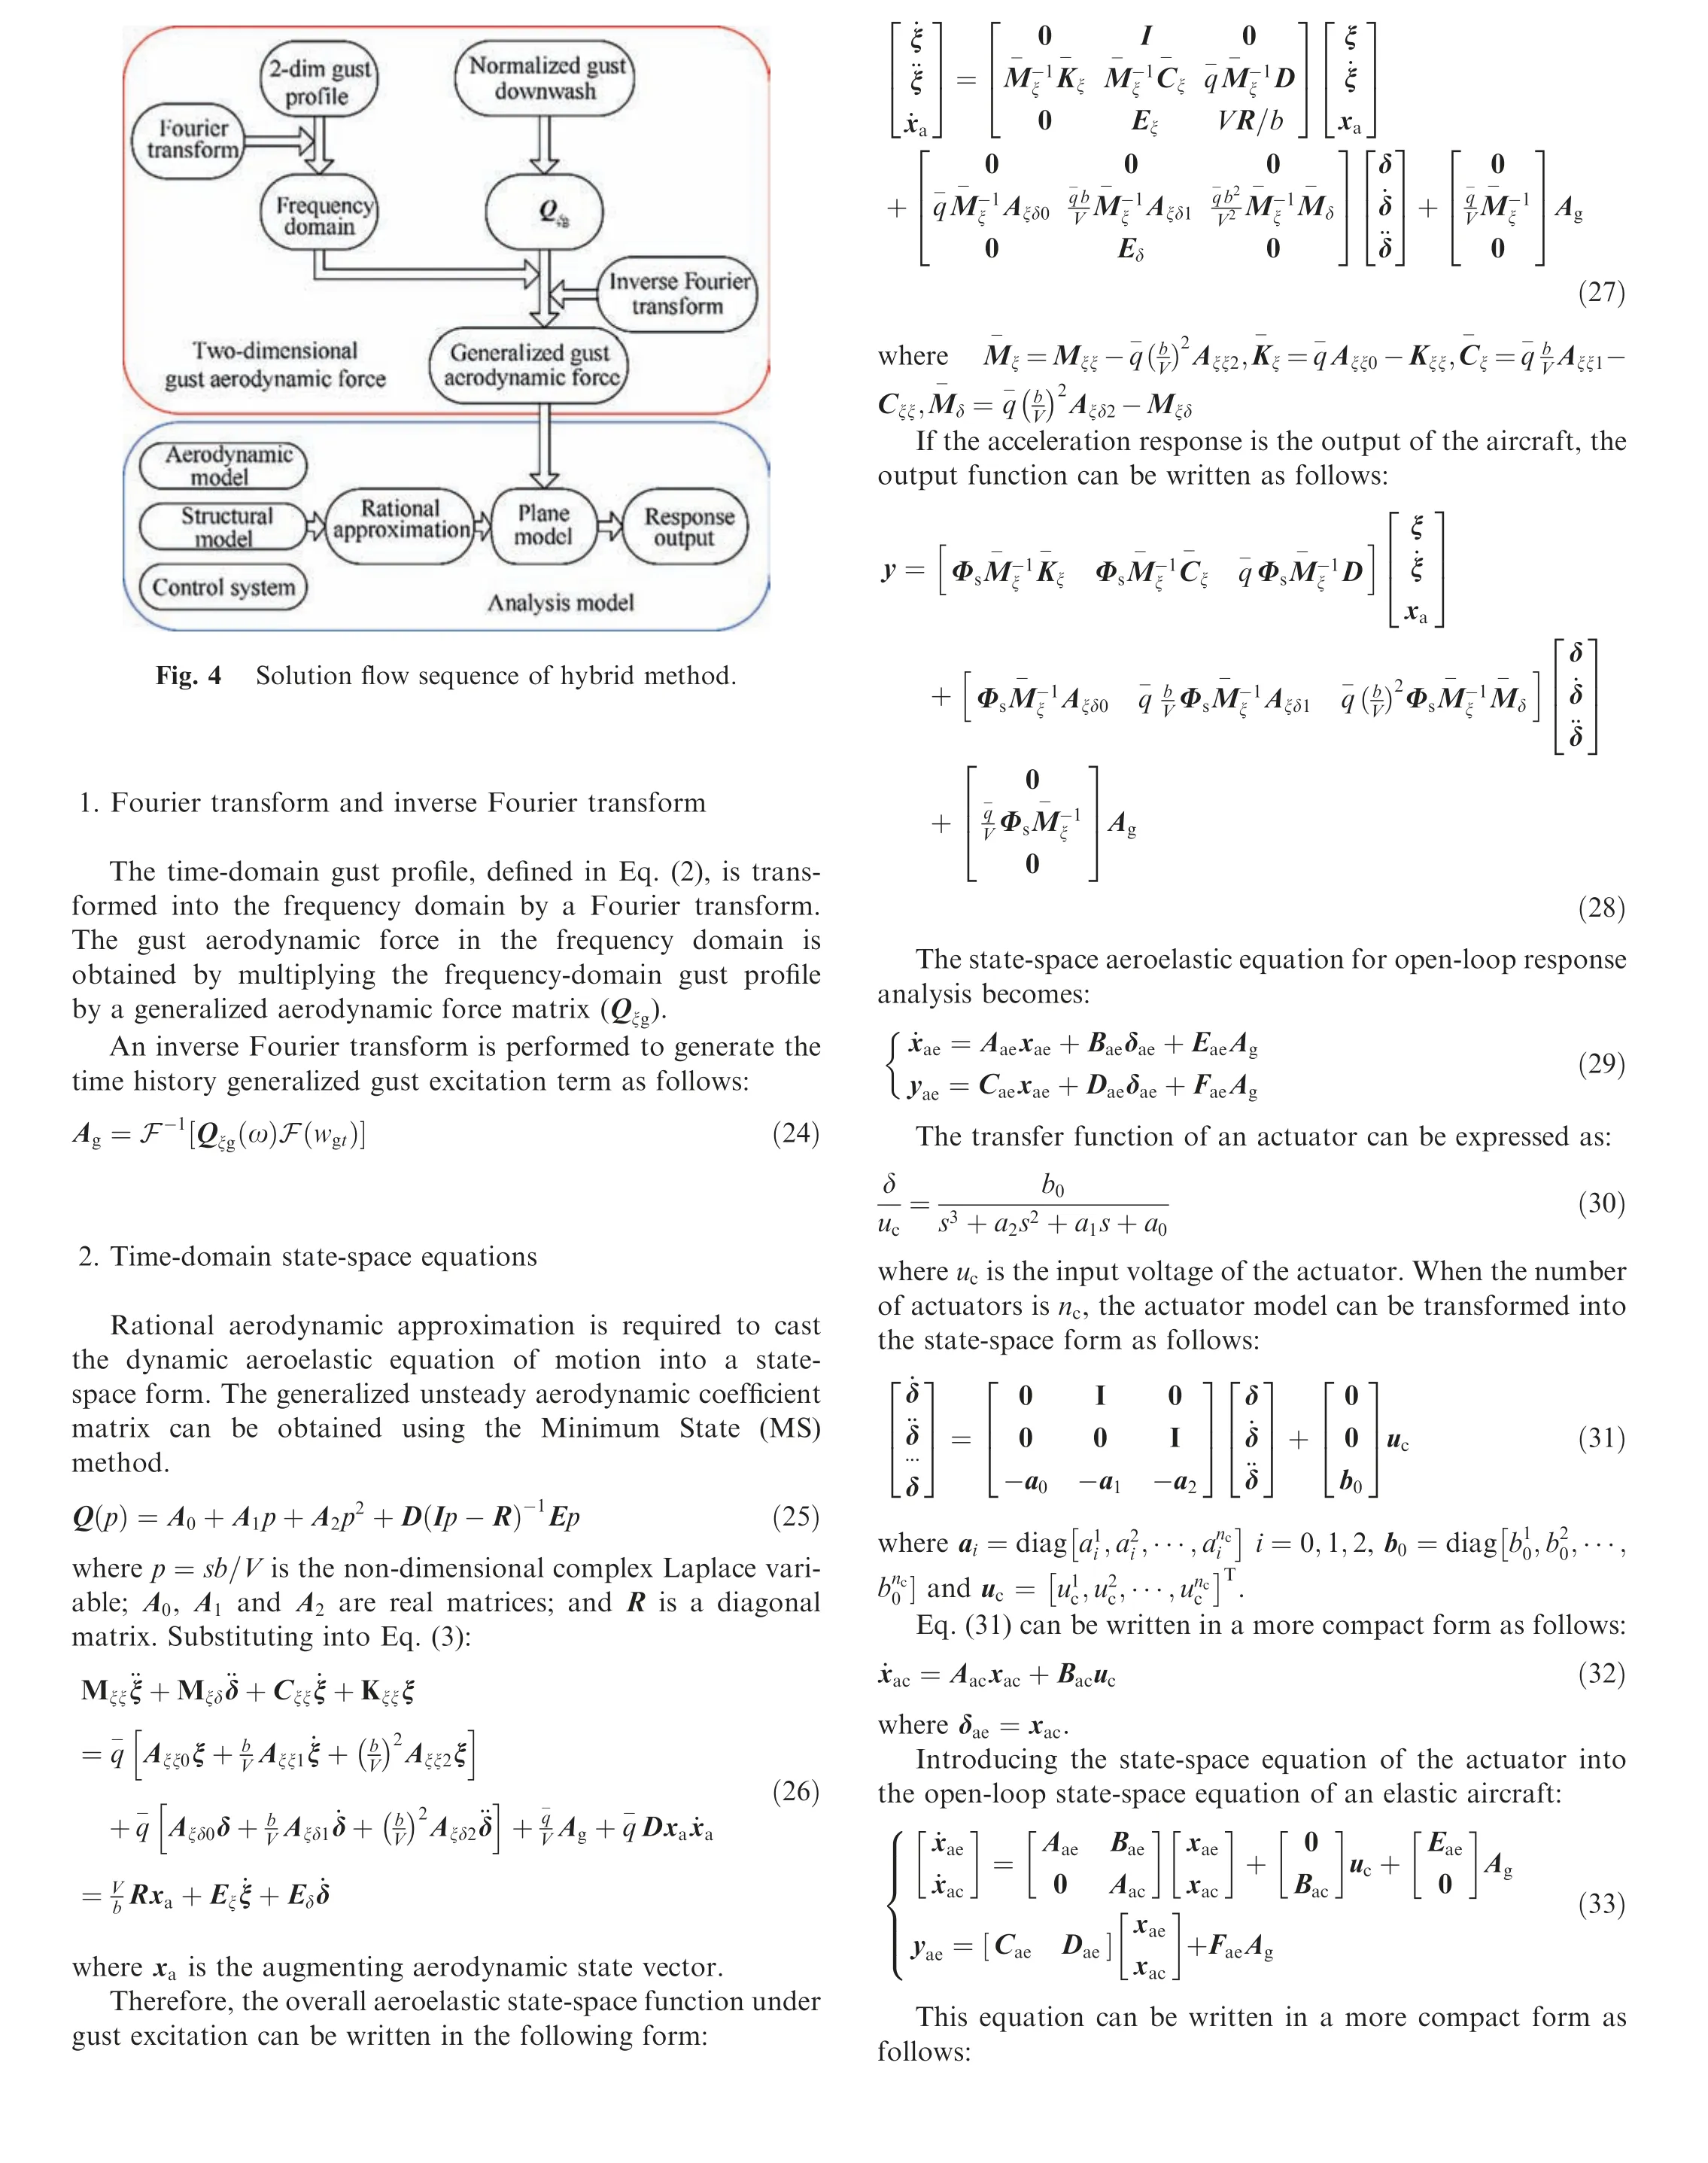

The state-space equation of the control system of gust alleviation is:

where the inputs of the control system are gust response parameters such as the acceleration and the rate of pitch angle.The output of the control system is the voltage of the actuator.
The closed-loop aeroelastic equation, including the actuators and control system, can be written as:

3. Numerical model
The baseline high aspect ratio aircraft model used in this study is shown in Fig. 5. The aircraft adopts a normal-type layout and has a straight wing with a chord of 1.6 m and a span of 50.0 m. The control system is based on the application of two pairs of ailerons symmetrically and one elevator. Additionally, the aircraft weighs approximately 430.0 kg.
Fig. 6 shows the finite element model of this aircraft. The structure dynamics characteristics of the aircraft are analysed by MSC/NASTRAN software. The analysis results are listed in Table 1. Ten symmetric and anti-symmetric modes (prime bending and torsion), including two rigid body modes (heave and pitch), are used in the gust response analysis. The elastic modal shapes of the first six orders for this aircraft are shown in Fig. 7.
A panel aerodynamic model is used in this study, and the aerodynamic model is shown in Fig.8.The free stream velocity is fixed to 20 m/s at 6 km altitude(ρair=0.66 kg/m3).The reference plane is located at x0=0.0 m. Twenty-four aerodynamic force coefficient matrices at reduced frequency values between 0.0 and 3.0 are calculated at Mach 0.06.
A discrete gust zone with a length of 40 m is constructed.After 0.5 s,the aircraft begins to enter the gust zone with ignorance of the fuselage.Then,the horizontal tail enters this zone 0.5 s later.The flight of the aircraft in the gust zone is shown in Fig. 9. In the two-dimensional gust, Ude2is set to 1.0 m/s and Lg=40 m.

Fig. 5 Model of airplane.

Fig. 6 Structural finite element model of aircraft.

Table 1 Structural dynamic analysis.
4. Calculation of two-dimensional gust response
4.1. Validation of numerical algorithm
According to Eq. (1) and Eq. (2), when the spanwise distribution factor (a) approaches infinity, the two-dimensional gust degenerates to a one-dimensional gust. If USAis equal to Ude1/2 in this case, the two-dimensional gust responses calculated by the above methods should be identical to those of the one-dimensional gust obtained by the commercial software ZAERO.
Therefore, the aircraft model described in Chapter 3 is used. The factor (a) is set to a very large value(a=1.0×10¹⁰) in the two-dimensional gust response calculation.In the other method,the value of 2USAis assigned to Ude1.The two gust models are shown in Fig. 10.
The responses, including the centroid acceleration, the wingtip acceleration, the wing-root bending moment and the wing-root shear, are calculated by these three methods. As shown in Fig. 11, the responses obtained by ZAERO and the presented two methods are consistent. Thus, the proposed approaches are accurate. The state-space function from the hybrid approach can be used to design the gust alleviation control system, so the following results are calculated by the hybrid approach.
4.2. Results comparison between one-dimensional and twodimensional gusts

Fig. 7 Elastic modal shapes of the first six orders.

Fig. 8 Aerodynamic model of aircraft.

Fig. 9 Flight through gust zone.
The two-dimensional gust model is shown in Fig.12,where the factor (a) is set to 1.0. In the spanwise range of -0.25-0.25Lspan(Lspanis the span of the aircraft), the gust velocity is vertically upward, while the gust velocity is opposite on the other part of the wing.
The responses of the aircraft in the two-dimensional gust zone shown in Fig. 12 and the one-dimensional gust zone(USAis equal to Ude1/2) are calculated. The results are shown in Fig. 13.
Comparing the two-dimensional and one-dimensional gust responses, the trends of centroid acceleration are consistent.The additional gust aerodynamic forces in these two conditions are the same near the centroid. However, the negative two-dimensional gust response is less than that of the onedimensional gust because of the influence of downward aerodynamic force along the span.
However, the wingtip accelerations of these two conditions are different. The direction of the aerodynamic force in the two-dimensional gust at the wingtip is contrary to that in the one-dimensional condition. In addition, the elastic deformation of the wing in the two-dimensional gust is larger than that in the one-dimensional gust due to a change in the direction of the aerodynamic force along the wing. When the additional gust aerodynamic force gradually decreases,the wingtip acceleration caused by the elastic force would be larger than that in the one-dimensional gust. Therefore, the absolute value of the wingtip acceleration in the two-dimensional gust at 2 s is larger than that in the one-dimensional condition.
The bending moment and shear at the wing root are negative in the two-dimensional gust condition because of the additional downward aerodynamic force along 0.25-0.5Lspan. The wing-root bending moment and shear caused by the aerodynamic and inertia forces along 0.25-0.5Lspanare negatively illustrated by the red lines in Fig. 14. The blue lines in Fig. 14 illustrate the bending moment and shear caused by the forces along 0.0-0.25Lspan, and these responses are positive.However,the positive responses are smaller than the negative responses.
4.3. Results comparison with different spanwise distribution factors (a)
The spanwise distribution factor (a) is set to 0.5, 1.0, 2.0, 5.0 and 10.0, and the responses of the aircraft are calculated as shown in Fig. 15.
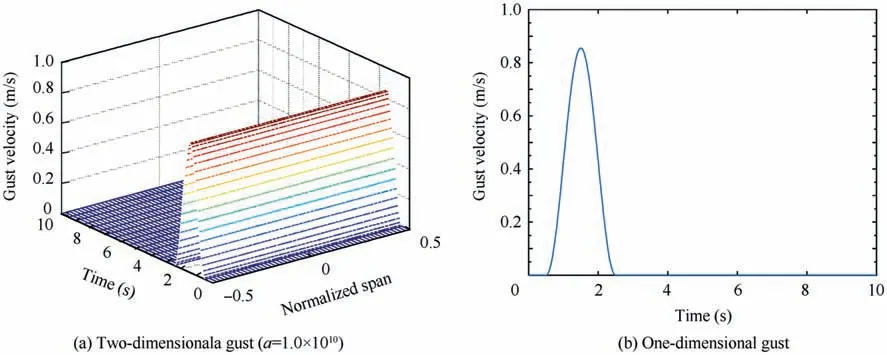
Fig. 10 Gust models.

Fig. 11 Comparison between ZAERO and the proposed calculation algorithms.
As illustrated in Fig. 15, the two-dimensional gust responses approach those of the one-dimensional gust with an increase in the factor(a).When the factor(a)is larger than 2.0, the trends of the two-dimensional gust responses indicate good consistency with those of the one-dimensional gust responses.
When the factor (a) is equal to 2.0, the trends of the responses except wingtip acceleration are the same as those of the one-dimensional gust condition. Because of the zero gust velocity at the wingtip, the acceleration is close to zero at the beginning. After 1.5 s, the acceleration is gradually increasing because of the elastic force, and the trend is the same as that of the condition of a=1.0.
When the factor (a) is equal to 0.5, the trends of the bending moment and shear are the same as those when the factor(a)is equal to 1.0 because of the downward aerodynamic force.The upward additional aerodynamic force is small near the centroid and the wingtip, so small positive acceleration appears at the beginning.However,after 1.0 s,as the horizontal tail goes into the gust, these accelerations change in the opposite direction. Because of the elasticity of the wing, the wingtip acceleration vibrates in the gust zone.
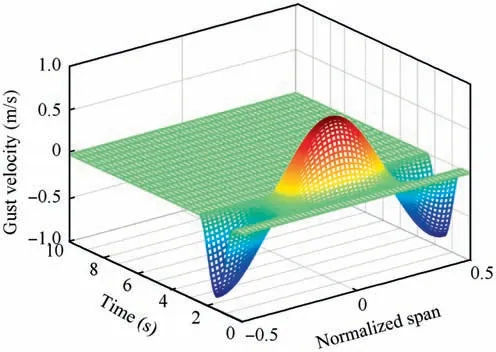
Fig. 12 Two-dimensional gust model (a=1.0).
4.4. Spanwise load distributions with different a
Fig. 16 shows the maximum absolute value of the bending moment distribution along the wingspan with different spanwise distribution factors (a). When the factor (a) is equal to 0.5, the maximum bending moment occurs at ±0.125Lspanand ±0.375Lspan. For the condition of a=1.0, the maximum bending moment occurs at±0.25Lspan.Fig.17 shows the gust aerodynamic distribution along the wingspan. As shown in Fig. 17, for a=0.5, ±0.125Lspanand±0.375Lspanare the positions where the direction of the additional aerodynamic force changes, and for a=1.0, this position occurs at±0.25Lspan. The direction change in the aerodynamic force causes part of the moment to be offset.
When the factor(a)is equal to 2.0,the maximum occurs at±0.175Lspan. The maximum absolute value of the bending moment at 0.175Lspanis 2080.0 N·m, and the sign is negative.Calculating the bending moments caused by the forces along 0.0-0.175Lspan, the maximum absolute value is 46.0 N·m, and the sign is positive. Therefore, the absolute bending moment at the wing root is equal to 2034.0 N·m, slightly less than that at 0.175Lspan.
When the factor is larger than 2.0, the maximum bending moment occurs at the wing root, similar to the onedimensional gust condition. The spanwise distribution of the two-dimensional gust is basically consistent for these conditions.
5. Gust alleviation control system
5.1. Design of gust alleviation control scheme

Fig. 13 Responses of aircraft in two-dimensional and one-dimensional gusts.

Fig. 14 Wing-root load responses generated by different parts of wing span in the two-dimensional gust.

Fig. 15 Responses of aircraft in the two-dimensional gusts with different a.
According to the analysis for the two-dimensional gust, the gust responses of aircraft are most serious when the factor(a) is equal to 1.0. Therefore, a gust alleviation control scheme is designed in this situation to restrain the critical responses. Fig. 18 shows the whole designed gust alleviation control scheme. When the airplane is affected by a gust,response signals, including pitch angle, centroid acceleration and wingtip acceleration, are collected by sensors. These signals are processed by the control system and then output to actuators to drive the control surfaces. The actuator is modelled as follows:


Fig. 16 Spanwise distributions of the maximum bending moment for different a.
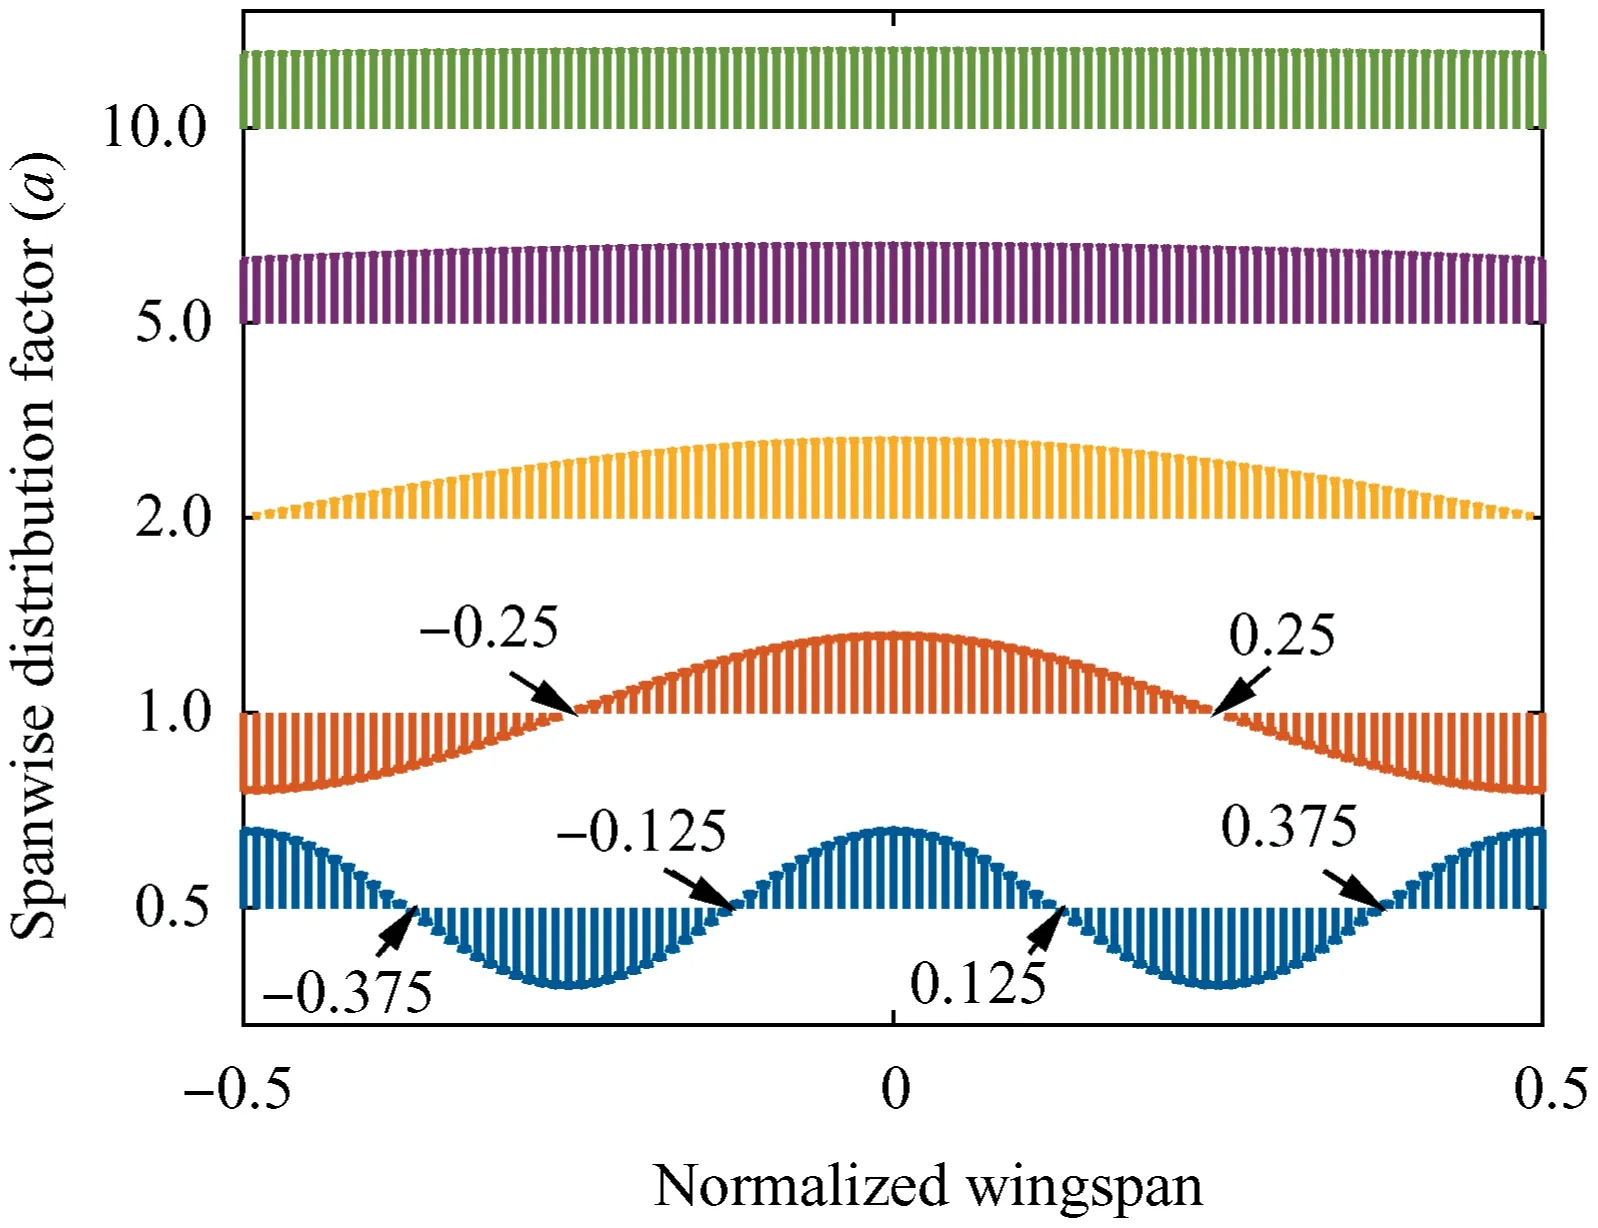
Fig. 17 Spanwise distributions of gust aerodynamics for different a.
The specific control scheme is shown in Fig. 19. The openloop model and closed-loop model of this airplane are constructed in Simulink to analyse the alleviation effect of the designed control scheme.To alleviate the centroid acceleration and wing-root bending moment, pitch angle and centroid acceleration signals are input to the four different PID control systems,and three signals are output to five actuators to drive two pairs of ailerons symmetrically and one elevator. These five control surfaces are deflected to alleviate the influence of the gust. According to the simulation, the parameters of these three control configurations are shown in Fig. 20.
5.2. Effect of gust alleviation
The time-domain responses to the two-dimensional discrete gust when the factor(a)is equal to 1.0 with the control system are illustrated in Fig. 21. The alleviation effect is listed in Table 2. It can be seen that the peak values of these responses are alleviated effectively by using this control scheme.
Fig. 22 shows the gust alleviation effect of this control system with different spanwise distribution factors(a).This figure shows that the designed control system can alleviate the centroid acceleration and wing-root bending moment in any gust conditions. However, the alleviation effects are different.
6. Conclusions
In this paper, a spanwise non-uniform vertical gust field is established based on a one-dimensional ‘1-cos’ gust profile in reference to a DARPA recommendation. A frequency approach and hybrid approach are presented to analyse the dynamic response of an aircraft under a two-dimensional gust excitation. According to different values of the factor (a), the gust spanwise distribution changes.
When the spanwise distribution factor(a)is equal to a very large value (1.0×10¹⁰), the two-dimensional gust degrades to a one-dimensional condition.To verify the accuracy of the frequency domain method and hybrid method, the responses in this two-dimensional gust are calculated to compare the results in the one-dimensional gust by using the commercial software ZAERO. The consistency of the results indicates the accuracy of these methods. Because the results calculated by the two presented methods are consistent, the hybrid method is used for the design of the gust alleviation control system.

Fig. 19 Gust alleviation system simulation.

Fig. 20 PID controllers of gust alleviation system.
Solution techniques have been applied to a high aspect ratio aircraft to assess the two-dimensional gust response characteristics in comparison to those for the one-dimensional condition. The responses, including centroid acceleration, wingtip acceleration, wing-root bending moment and wing-root shear,are larger than those calculated in the one-dimensional gust condition because of the spanwise distribution of the gust.

Fig. 21 Responses of aircraft with gust alleviation system.

Table 2 Evaluation of control scheme for gust alleviation(a=1.0).
By changing the values of the factor(a),the same responses are calculated.As this factor increases,the responses approach those in the one-dimensional gust condition. However, when the factor is lower than 2.0, the responses are very different.Therefore, the spanwise distribution of gusts would affect the gust response of the aircraft.
When the factor is equal to 1.0,namely,the aircraft body is located at the crest of the sine wave while the wing tip lies at the trough, the responses are the most intense. Therefore, the critical conditions of the response, derived from this twodimensional gust for high aspect ratio aircraft, should be paid much more attention.

Fig. 22 Alleviation effect with different a.
The responses are more intense under the two-dimensional discrete gust when the factor(a)is equal to 1.0,so some proper gust alleviation schemes should be designed to restrain this critical condition. The gust alleviation control framework is designed for the suppression of aircraft structural vibrations and critical loads induced by two-dimensional discrete gust perturbations in the presence of aeroelastic/aeroservoelastic interactions.The results show that the peak responses are alleviated effectively by using the PID control system. When the alleviation effects for different values of the factor(a)are compared, the peak values of centroid acceleration and wing-root bending moment are alleviated, but the effects are different.
 CHINESE JOURNAL OF AERONAUTICS2020年4期
- CHINESE JOURNAL OF AERONAUTICS的其它文章
- Reliability and reliability sensitivity analysis of structure by combining adaptive linked importance sampling and Kriging reliability method
- Thermal damage analysis of aircraft composite laminate suffered from lightning swept stroke and arc propagation
- An aerospace bracket designed by thermo-elastic topology optimization and manufactured by additive manufacturing
- Applications of structural efficiency assessment method on structural-mechanical characteristics integrated design in aero-engines
- An energy-based coupling degradation propagation model and its application to aviation actuationsystem
- Model-driven degradation modeling approaches:Investigation and review
