
A case study on Landscape Component Niche based on Landscape Pattern Indices:Yanchi,Ningxia Province,China
2020-06-02 02:54XiaoNingZhangXueLuLiuGhanneyPhilipXiaoDanLiQuanXiWangYaNanXuTingTingHui
XiaoNing Zhang ,XueLu Liu *,Ghanney Philip ,XiaoDan Li ,QuanXi Wang ,YaNan Xu ,TingTing Hui
1.College of Resources and Environmental Sciences,Gansu Agricultural University,Lanzhou,Gansu 730070,China
2.College of Management,Gansu Agricultural University,Lanzhou,Gansu 730070,China
ABSTRACT Yanchi County is located in the agro-pastoral ecotone and belongs to the ecologically fragile area of Northwest China.It is important to study the evolution of landscape pattern to curb its environmental degradation.In order to intuitively show how the landscape pattern of the study area changes over time,Landsat Thematic Mappers(TM)and Landsat Operational Land Imager(OLI)data of 1991,2000,2010 and 2017 were used.This paper attempts to apply niche theories and meth‐ods into landscape ecology,and constructs a niche model of landscape components by using"n-dimentional hypervolume niche theory"and landscape pattern indices.By evaluating the spatial and temporal evolution of niche from the perspec‐tive of two-dimensional space to reflect the changes of landscape pattern in the study area over the past 26 years,new the‐ories and methods were introduced for the characterization of landscape pattern.The results indicate that:1)The larger the attribute and dominance value of landscape components,the higher the ecological niche and the stronger the control effect on the overall landscape.2)The ecological niche of each landscape component was significantly different,just as its con‐trol effect on the overall landscape.3)The dynamic change of the ecological niche of each landscape component was dif‐ferent,with grassland,unused land and arable land always in a high dominant position,although the ecological niche of construction land and water area was always low.In general,the introduction of niche theory into the landscape ecology provided a new method to study the changes in regional landscape pattern.
Keywords:landscape pattern;landscape component niche;landscape stability;landscape dominance
1 Introduction
Niche theory is one of the important basic theories of ecology with long processes of development.Grin‐nell(1917),Elton(1927)and Hutchinson(1957)put forward the concepts and connotations of "spatial niche","functional niche"and"n-dimentional hyper‐volume niche"respectively,and other related research‐es have also explained and applied the concepts and connotations on the basis of other niche theories(Wanget al.,1984;Zhang and Xie,1997;Zhu,1997).
The application of niche theory focuses mainly on both biology and urban areas.Research objects often referred to in the field of biology includes animals(Mazelet al.,2017;Qiuet al.,2018),plants(Marceli‐no and Verbruggen,2015;Liuet al.,2019)and micro‐organisms(Jayet al.,2012;Zhonget al.,2019).The study of urban niche included sustainability of the population(Isbellet al.,2014)and the disadvantages associated with urban construction (Downeyet al.,2016).Prior to the development of interdisciplinary dis‐ciplines,niche theory and its related concepts and mod‐els have been applied in many aspects.Most research‐ers combined previous studies with their own research direction and engaged them in ecological agriculture(Chen,1995),forest resource assessment(Luet al.,2016),enterprise development(Rong,2014),competi‐tive development of tourist cities(Penget al.,2015),territorial spatial function zoning(Nianet al.,2014)and other research fields.There are precedents for ap‐plying the theories and methods of niche in the analy‐sis of regional landscape pattern in landscape ecology(Ren and Wang,2007;Wuet al.,2014;Yuet al.,2015).Ren and Wang(2007)used spatial and function‐al niche to evaluate landscape spatial pattern and eco‐logical function comprehensively without studying the ecological position of each landscape component.
Landscape pattern index is the basis for analyzing landscape structure,function and process.It is a sim‐ple quantitative index reflecting the characteristics of landscape structure and spatial configuration,and can provide a quantitative basis for scientific measure‐ment of landscape structural characteristics.Because landscape stability is the embodiment of landscape structure(Penet al.,2013),and whether landscape structure can reasonable determines the pros and cons of landscape function,it is measured by common domi‐nance(Yanget al.,2014),where the combination of stability and dominance can reflect the position and role of landscape components in the landscape.Accord‐ing to the theory of"n-dimentional hypervolume niche"(Nianet al.,2014;Liuet al.,2018;Zhuet al.,2018),the niche model of landscape components can be con‐structed.The combination of stability and dominance can reflect the position and role of landscape compo‐nents in the landscape;hence the niche model of land‐scape components can be constructed using the theory of"n-dimentional hypervolume niche".In this paper,Yanchi County,located in the arid fragile region of Northwest China,was selected as the research area.The niche model of landscape components were con‐structed from the dimension of landscape stability and landscape dominance,which provided a new theory,method and research perspective for analyzing the over‐all change characteristics of landscape pattern and pro‐vided a scientific basis for the optimization of land‐scape pattern in the study area.In addition,this study is not only of great significance to the ecological environ‐ment construction and landscape planning in the re‐gion,but also provides decision support for the sustain‐able use of landscape resources.
2 Materials and methods
2.1 Study area
Yanchi County is located in the eastern part of Ningxia Hui Autonomous Region of China. The county is about 110 km long and 66 km wide,situat‐ed on the border regions of Shanxi,Gansu,Ningxia and Mongolia province.Yanchi County is also the border region between farming and nomadic popula‐tions found throughout Chinese history. Yanchi County similarly shares borders with Mu Us Desert in the north and the Loess Plateau in the south,which is a typical transitional zone.The climate is typical continental monsoon(heat in summer,cold in winter),with more sunny days,less rainfall,abun‐dant luminous energy,sufficient sunshine and large range of temperature.The climate is widely different in winter and summer and the mean temperature dif‐ference is about 28°C.The difference in temperature between day and night can reach 20°C in the end of autumn and the advent of winter(Figure 1).
2.2 Data and processing
Landsat TM data of 1991,2000,2010 and Land‐sat OLI data of 2017 were processed using the Geo‐spatial Data Cloud(http://www.gscloud.cn/),and spa‐tial resolution of 30 m.Image acquisition time was from June to August at a cloud cover of less than 1%.Firstly,the pre-processing of band synthesis,im‐age enhancement and geometric correction was per‐formed using ERDAS IMAGINE 9.2 software.The research range was measured with administrative vec‐tor boundary diagram.Secondly,the four landscape classification maps were obtained under visual inter‐pretation using unsupervised classification method,ENVI 5.1 software,and Google Earth in reference to the national land use classification system.In order to verify the classification accuracy,sample points were randomly selected and investigated at each spot.Also,the classification accuracy evaluation results show a Kappa index of more than 85%,which met the re‐quirements of the study.Finally,the landscape type maps were obtained using ArcMap 10.2 software,whereas Fragstats 4.2 of landscape pattern analysis software was used for the data processing and land‐scape pattern indices calculation.Figure 2 indicates the landscape map types.
2.3 Methods
2.3.1 Selection of landscape indicators
In view of the numerous existing quantitative indi‐cators available for studying ecological significance and landscape pattern,indicators relating to area/den‐sity/edge,shape,dispersion and connectivity were se‐lected for analyzing the landscape pattern and spatial niche in the study.The selection and connotation of the landscape pattern indices are presented in Table 1(Wanget al.,2018;Xuet al.,2018).
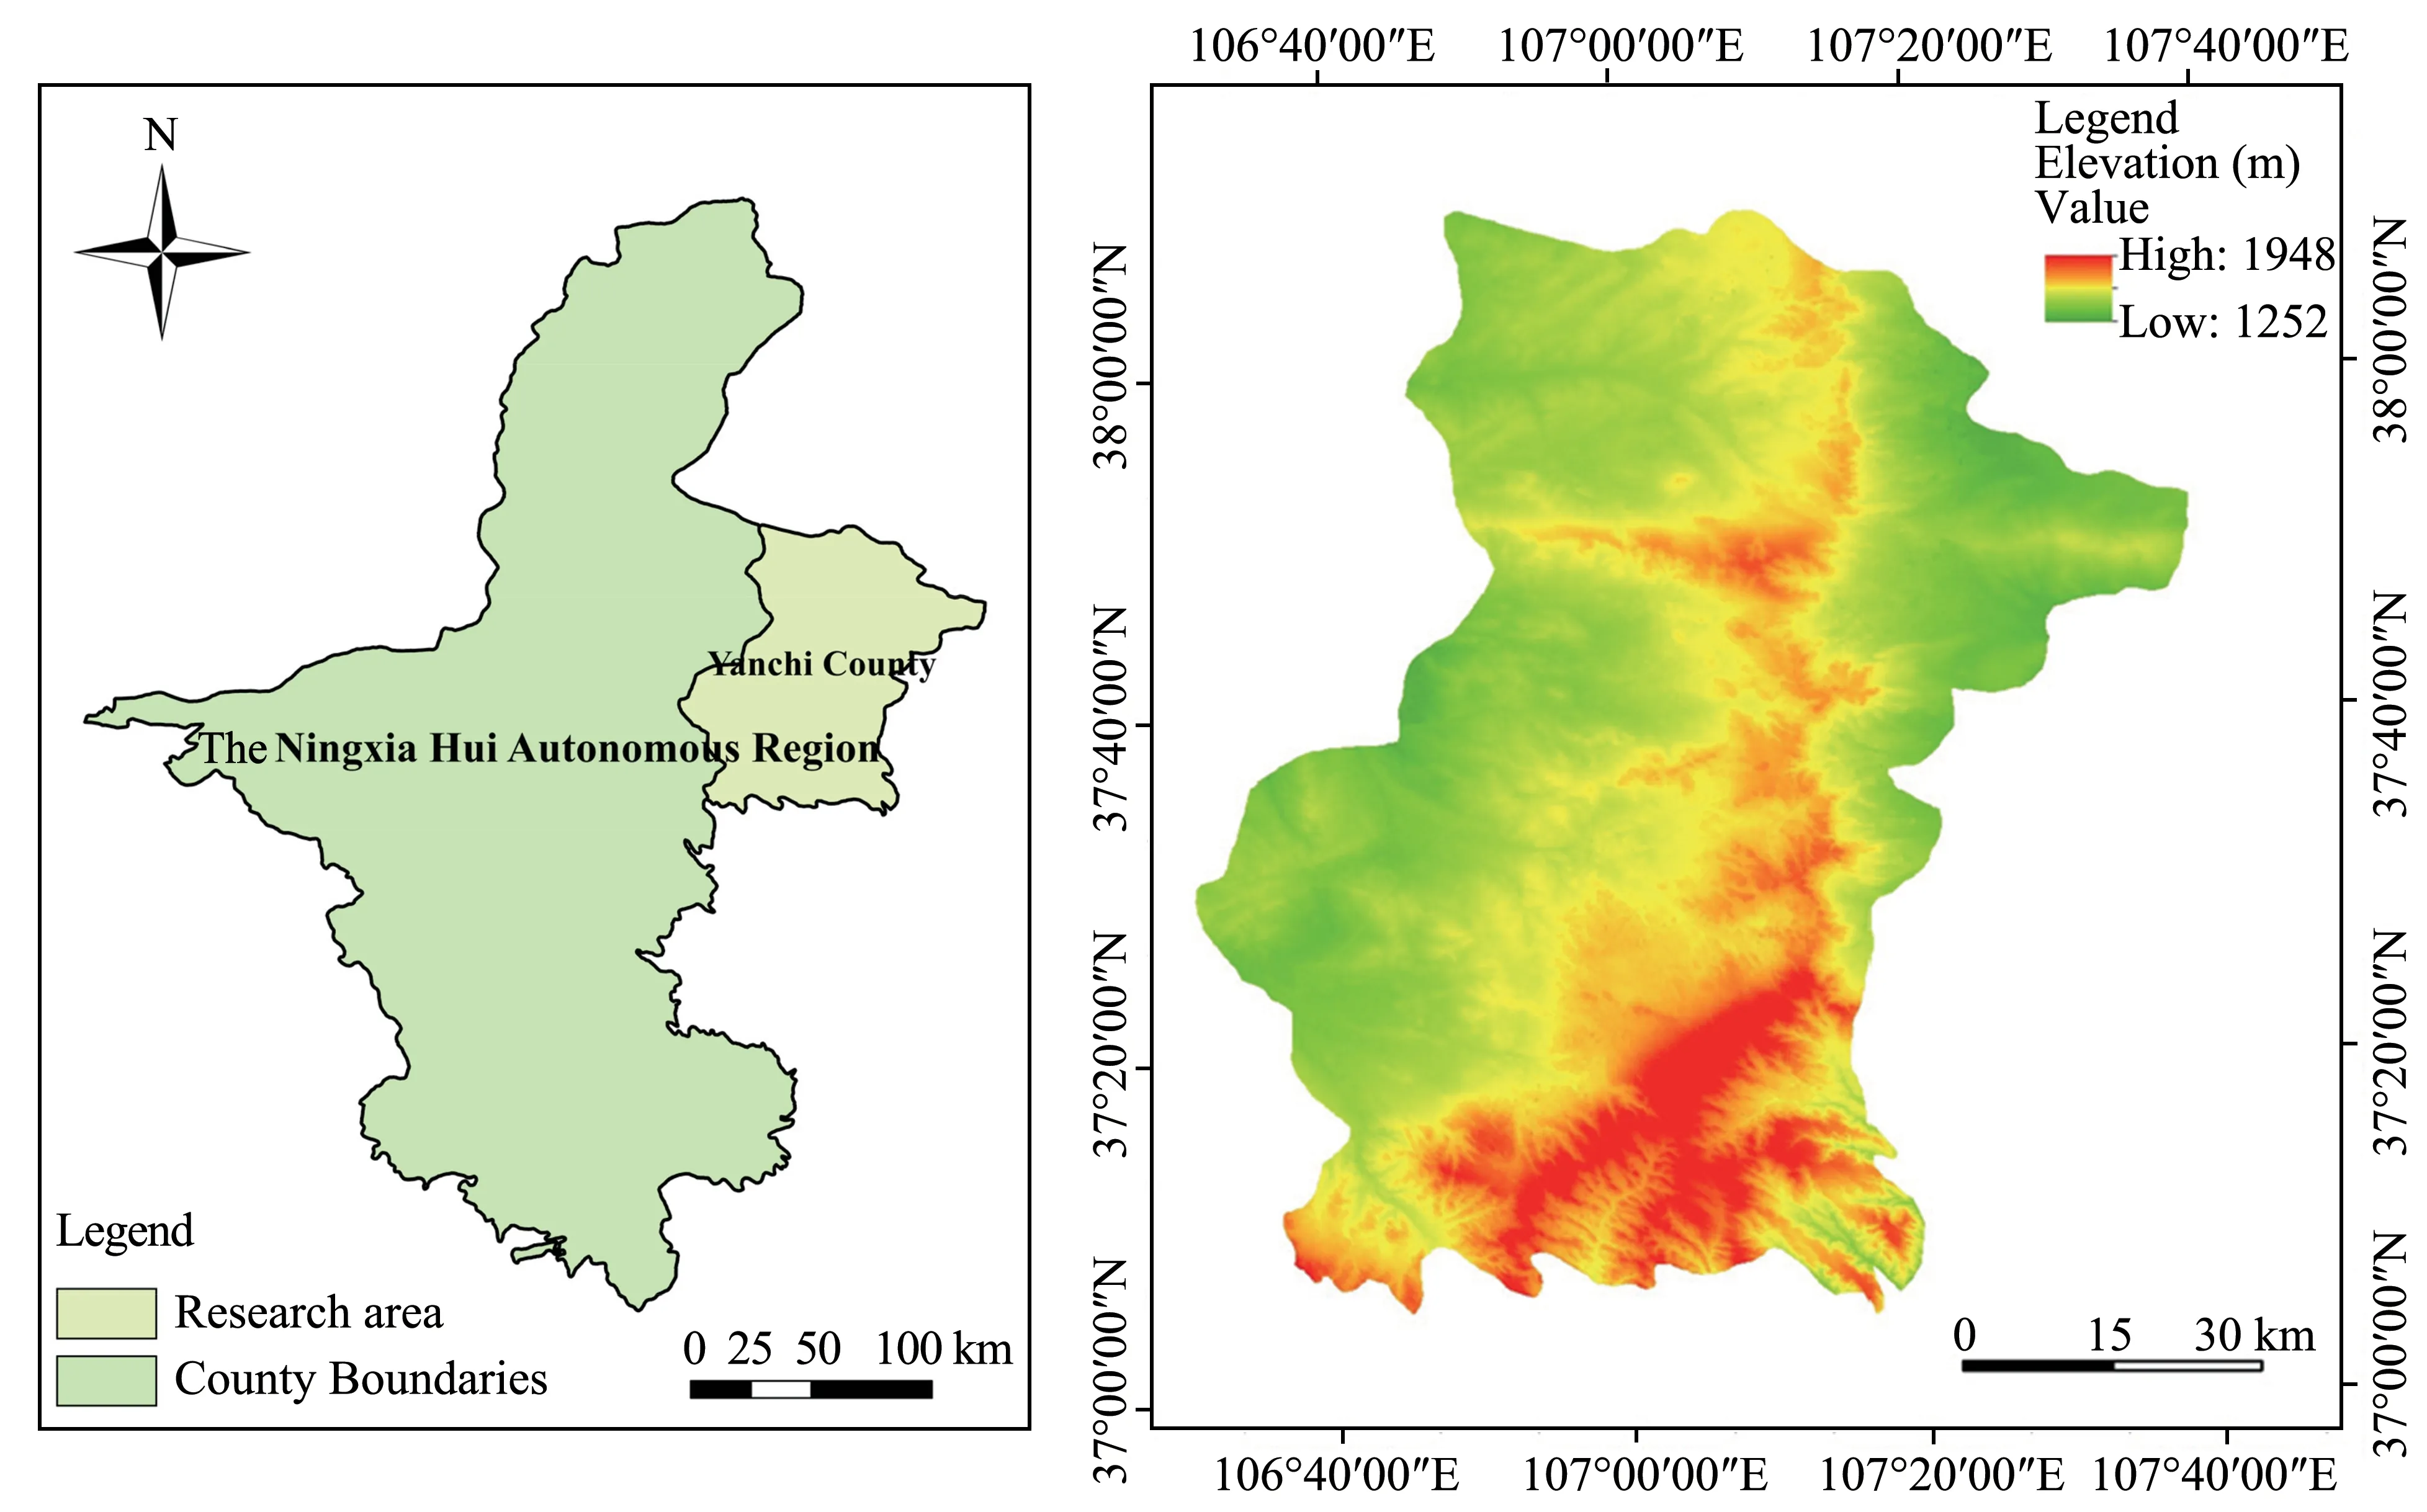
Figure 1 The location of Yanchi County,Northeast China

Figure 2 The landscape type maps of Yanchi County from 1991 to 2017
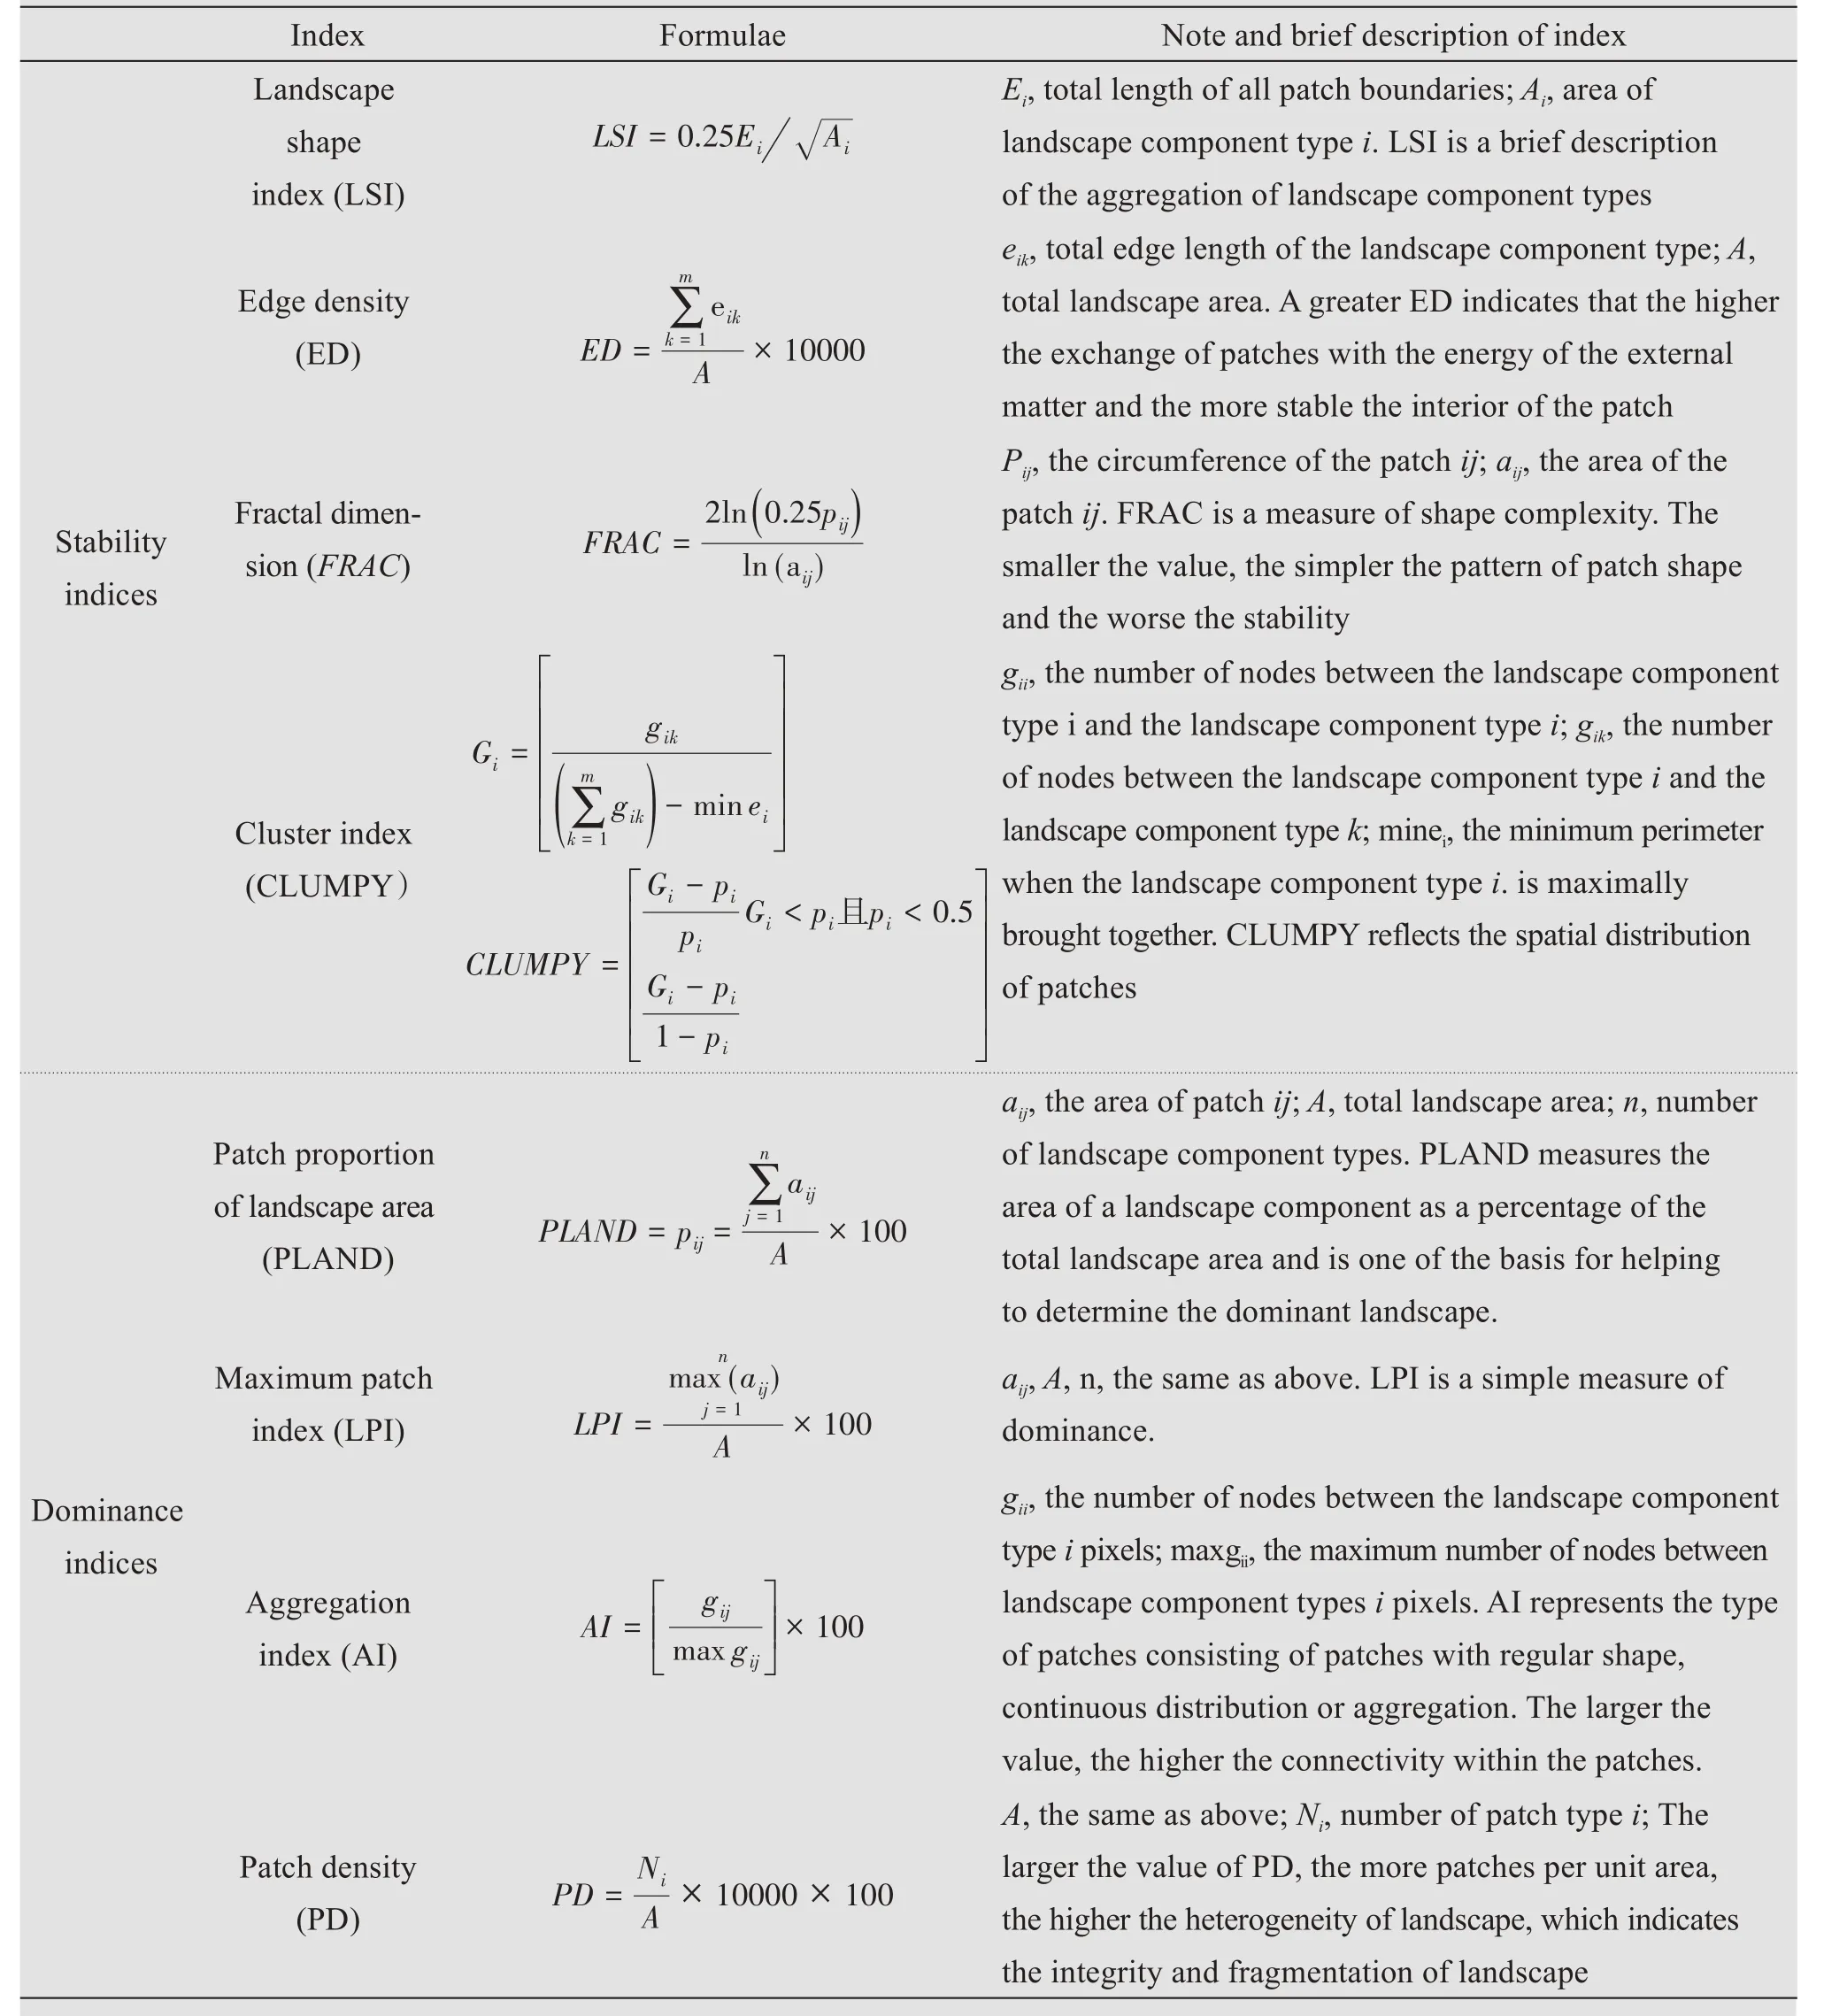
Table 1 Landscape pattern indices and its significance
2.3.2 Landscape component niche model
The landscape component niche can be regarded as a two-dimensional space containing a stable niche factor and a dominance niche factor,each of which is a dimension in the two-dimensional space.By quanti‐fying the niche factors of each landscape component and expressing them in the corresponding dimensions,a point can be obtained in the two-dimensional space.This point can be called landscape component niche,that is,landscape component niche can be expressed asNCi(As,Ad),in whichNCiis the niche of each land‐scape componenti,Asis the stable niche of landscape components,andAdis the dominant niche of land‐scape components.

Figure 3 Geometric indication of the ecological niche of landscape components
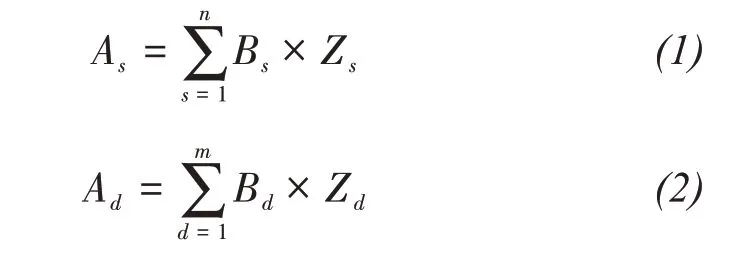
In Formula(1),Asis the stable niche of landscape components;Bsis the weight of stability index of each landscape component(The sum of the weights of each index is equal to 1);Zsis the index value of the stability of each landscape component.
In Formula(2),Adis the dominant niche of land‐scape components;Bdis the weight of dominance in‐dex of each landscape component(The sum of the weights of each index is equal to 1);Zdis the index value of the dominance of each landscape component.
Due to different dimensions of the landscape pat‐tern indices in the indicator system,it is not appropri‐ate to directly compare the degree of difference.The variation coefficient of each index should be used to measure the degree of difference of each index in or‐der to eliminate the influence of different dimensions of each landscape pattern index.Therefore,the weight of each index is determined by the coefficient of varia‐tion method,and the formula is:
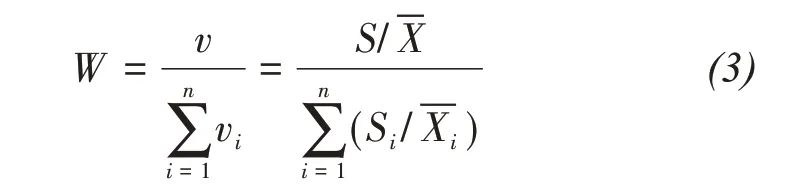
In Formula(3),Wrepresents the weight of evalua‐tion factors;vrepresents coefficient of variation;Srepresents standard deviation;represents average value;irepresents component number.
3 Results
The index values and weights of stability and dominance factors of each landscape component niche(from 1991 to 2017)are presented in Table 2.
3.1 Dimensional analysis of the stability of the niche of each landscape component
Table 3 can be obtained by calculating the index values of the stability factor of each landscape compo‐nent and the weight of each index in Table 2.It can be seen from Table 3 that the landscape components with higher stability from 1991 to 2017 were grassland and unused land, whereas landscape components with poor stability were construction land and water.From the stability value of each landscape component type:1)the stability of arable land,water area and unused land increased as a whole,but there were fluctuations of first decline and then rise during the period;2)the stability value of construction land was generally on the rise,rising from 6.33 in 1991 to 12.77 in 2017,in‐dicating that the patch mosaic structure of the con‐struction land in the study area was more stable;3)stability values of woodland and grassland changed greatly and show an upward trend on the whole,which was due to the effect of ecological restoration measures such as returning farmland to forest and grassland implemented in recent years.
3.2 Dimensional analysis of the dominance of the niche of each landscape component
Table 4 can be obtained by calculating the index values of dominance factor of each landscape compo‐nent and the weights of each index in Table 2.It can be seen from Table 4 that in 1991 and 2000,the domi‐nance degree of each landscape component type fol‐lowed the trend:grassland >arable land >unused land >woodland >water area >construction land.In 2010 and 2017,the dominance degree of each land‐scape component type was grassland >woodland >ar‐able land >unused land >construction land >water area.From the annual change of different landscape component types:1)dominant values of grassland de‐creased,indicating that the dominance of grassland decreased in the overall landscape.2)dominant val‐ues of the construction land increased,indicating that the ability of the landscape group matching the entire landscape was enhanced.3)dominant values of arable land first increased and then decreased with its domi‐nance being highest in 2000 and lowest in 2017.4)dominant values of unused land,woodland and water area generally increased,but there were incidence of fluctuation during the period,indicating that the domi‐nant positions of these landscape components were getting higher and higher as the control effect of the overall landscape enhanced.

Table 2 Index value of the niche of each landscape component
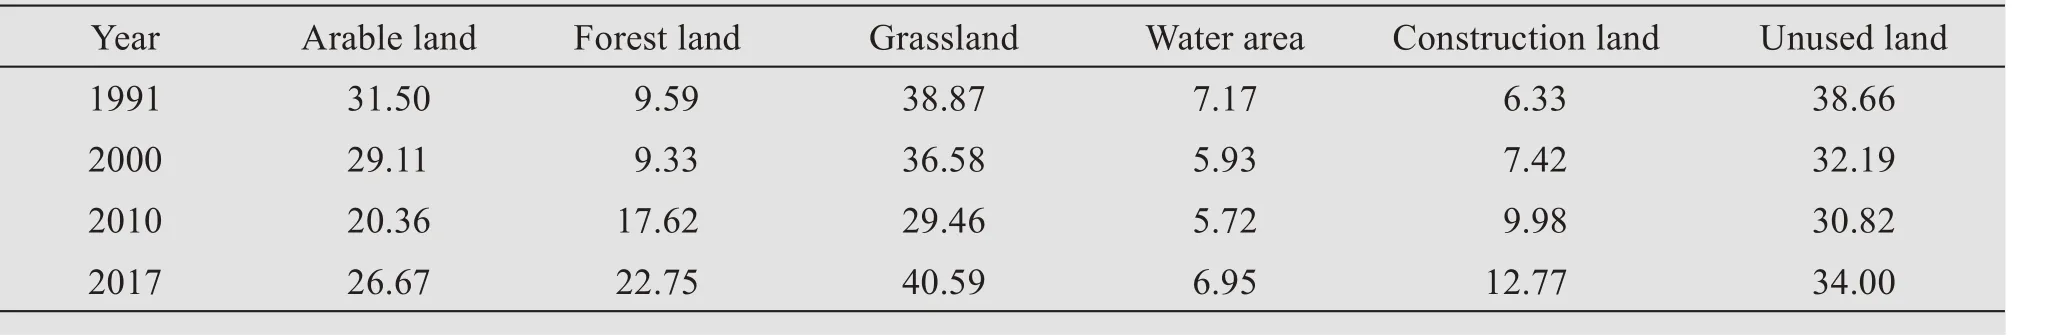
Table 3 The attribute value of the stability of each landscape component from 1991 to 2017
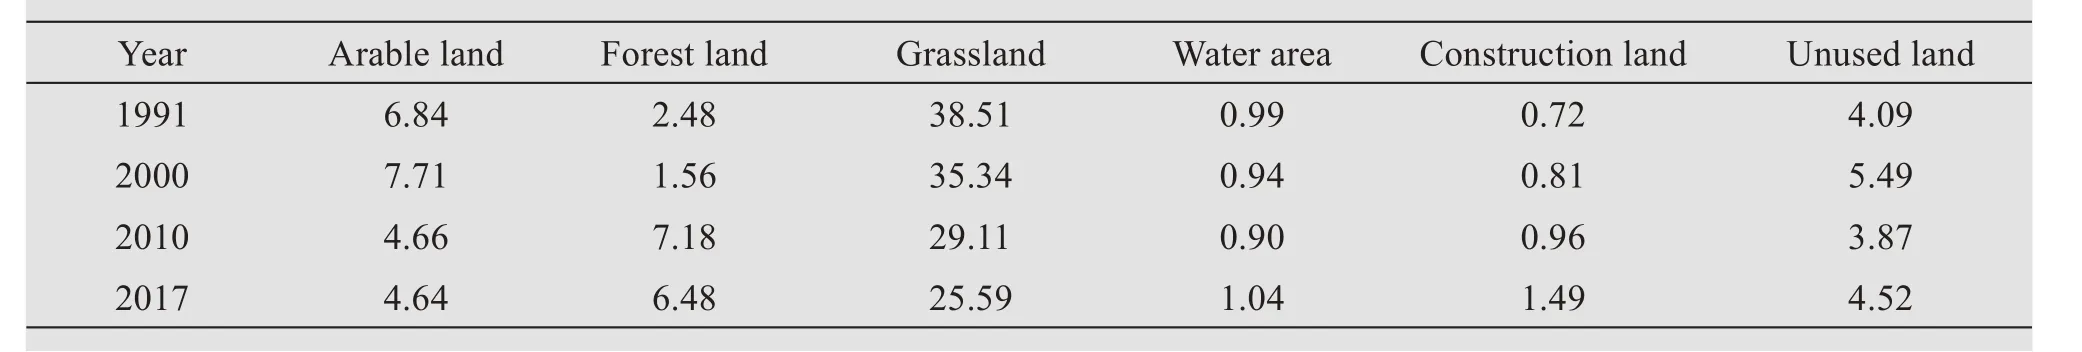
Table 4 The attribute value of dominance of each landscape component from 1991 to 2017
3.3 Analysis of the niche of landscape components
3.3.1 Decentralized layout of landscape component niche
Figure 4 can be obtained from Tables 3 and 4 and the connotation of landscape niche.As can be seen from Figure 4,1)the ecological niche of arable land in 1991 and 2000 were the highest,whilst the stability and dominance values in 2010 were the lowest,indi‐cating that the ecological niche of arable land was the smallest in 2010;2)the values of stability and domi‐nance of forest land in 2010 and 2017 were higher than those in 1991 and 2000,indicating that the niche of forest land in 2010 and 2017 was higher than that in 1991 and 2000;3)the dominance value of grass‐land was highest in 1991 with stability value remain‐ing least in 2017,indicating that the grassland ecologi‐cal niche was higher in 1991 and 2017;4)the values of stability and dominance of water area were least and highest in 2010 and 2017 respectively,indicating that the niche of water area in 2010 was lower whilst that of water area in 2017 was highest;5)the values of stability and dominance of the construction land in 1991-2017 show a gradual upward trend,indicating a higher dominant position of construction land;6)the stability value of unused land in 1991 was the largest,the dominance value in 2000 was the largest,and the values of stability and dominance in 2010 were the smallest,indicating that the niche of unused land in 1991 and 2000 was the highest,while the ecological niche of unused land in 2010 was the least.
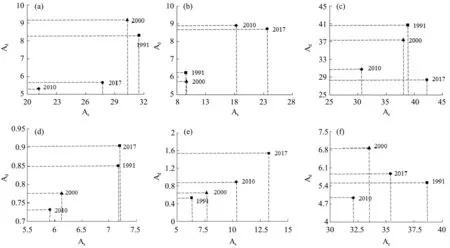
Figure 4 Scattered distribution of landscape niche of each landscape component for Yanchi County from 1991 to 2017.(a,Arable land;b,Forest land;c,Grassland;d,Water area;e,Construction land;f,Unused land;,Landscape component niche in 1991;▲,Landscape component niche in 2000;♦,Landscape component niche in 2010;,Landscape component niche in 2017)
3.3.2 Landscape niche of different years
With reference to Table 3,Table 4 and landscape niche model,Figure 5 was obtained.As can be seen from Figure 5,1)the niche value of arable land in 1991 was the largest,followed by unused land,for‐est land and water area;2)the niche value of arable land was largest in 2000 whilst the water area was the smallest due to the differences that existed be‐tween arable land and unused land;3)the gap be‐tween niche values of landscape components in 2010 and 2017 was smaller than that in 1991 and 2000,and the ecological niche of each landscape compo‐nent were as follows:grassland >unused land >ara‐ble land >forest land >construction land >water area.

Figure 5 Ecological niche change map of each landscape component in different years
3.3.3 Dynamic change analysis of landscape component niche
With reference to Table 3,Table 4 and landscape niche model,Figure 6 was obtained.As can be seen from Figure 6,1)the niche of arable land decreased from 1991 to 2010 and increased from 2010 to 2017.Especially in 2000 to 2010,the niche of arable land decreased significantly due to the policy of returning farmlands to the forestry and grassland agencies in Yanchi County whose severity occurred in 2001;2) the niche of forest land decreased slightly in 1991-2000 and then increased gradually after 2000,indicating that the dominant position of forest land in the landscape gradually increased whilst the control effect on the landscape gradually became stronger;3)among the six landscape components,the value of grassland niche was the largest in terms of dynamic change,showing a decreasing trend at the beginning with a gradual increase,indicating that grassland had the highest dominant position in the landscape of the study area,which was related to the natural environ‐ment of the ecotone between crop production and an‐imal husbandry;4)although the niche of water area decreased at first and then increased,there was no obvious change in general,and the overall value was smaller than that of other landscape components.This was because the study area was located in the southern margin of the Mu Us Desert where there was drought,more wind and sand,belonging to arid and fragile areas;5)the niche of the construction land show a rising trend,which was inseparable from the development of urbanization;6)the niche of un‐used land reached the lowest level in 2010 and rose again after 2010,but with a downward trend.In addi‐tion,the unused land in Yanchi County was mainly grassland, saline-alkali land, sandy land and bare land,which indicated that the control effect of the un‐used land on the landscape of the study area was weak.
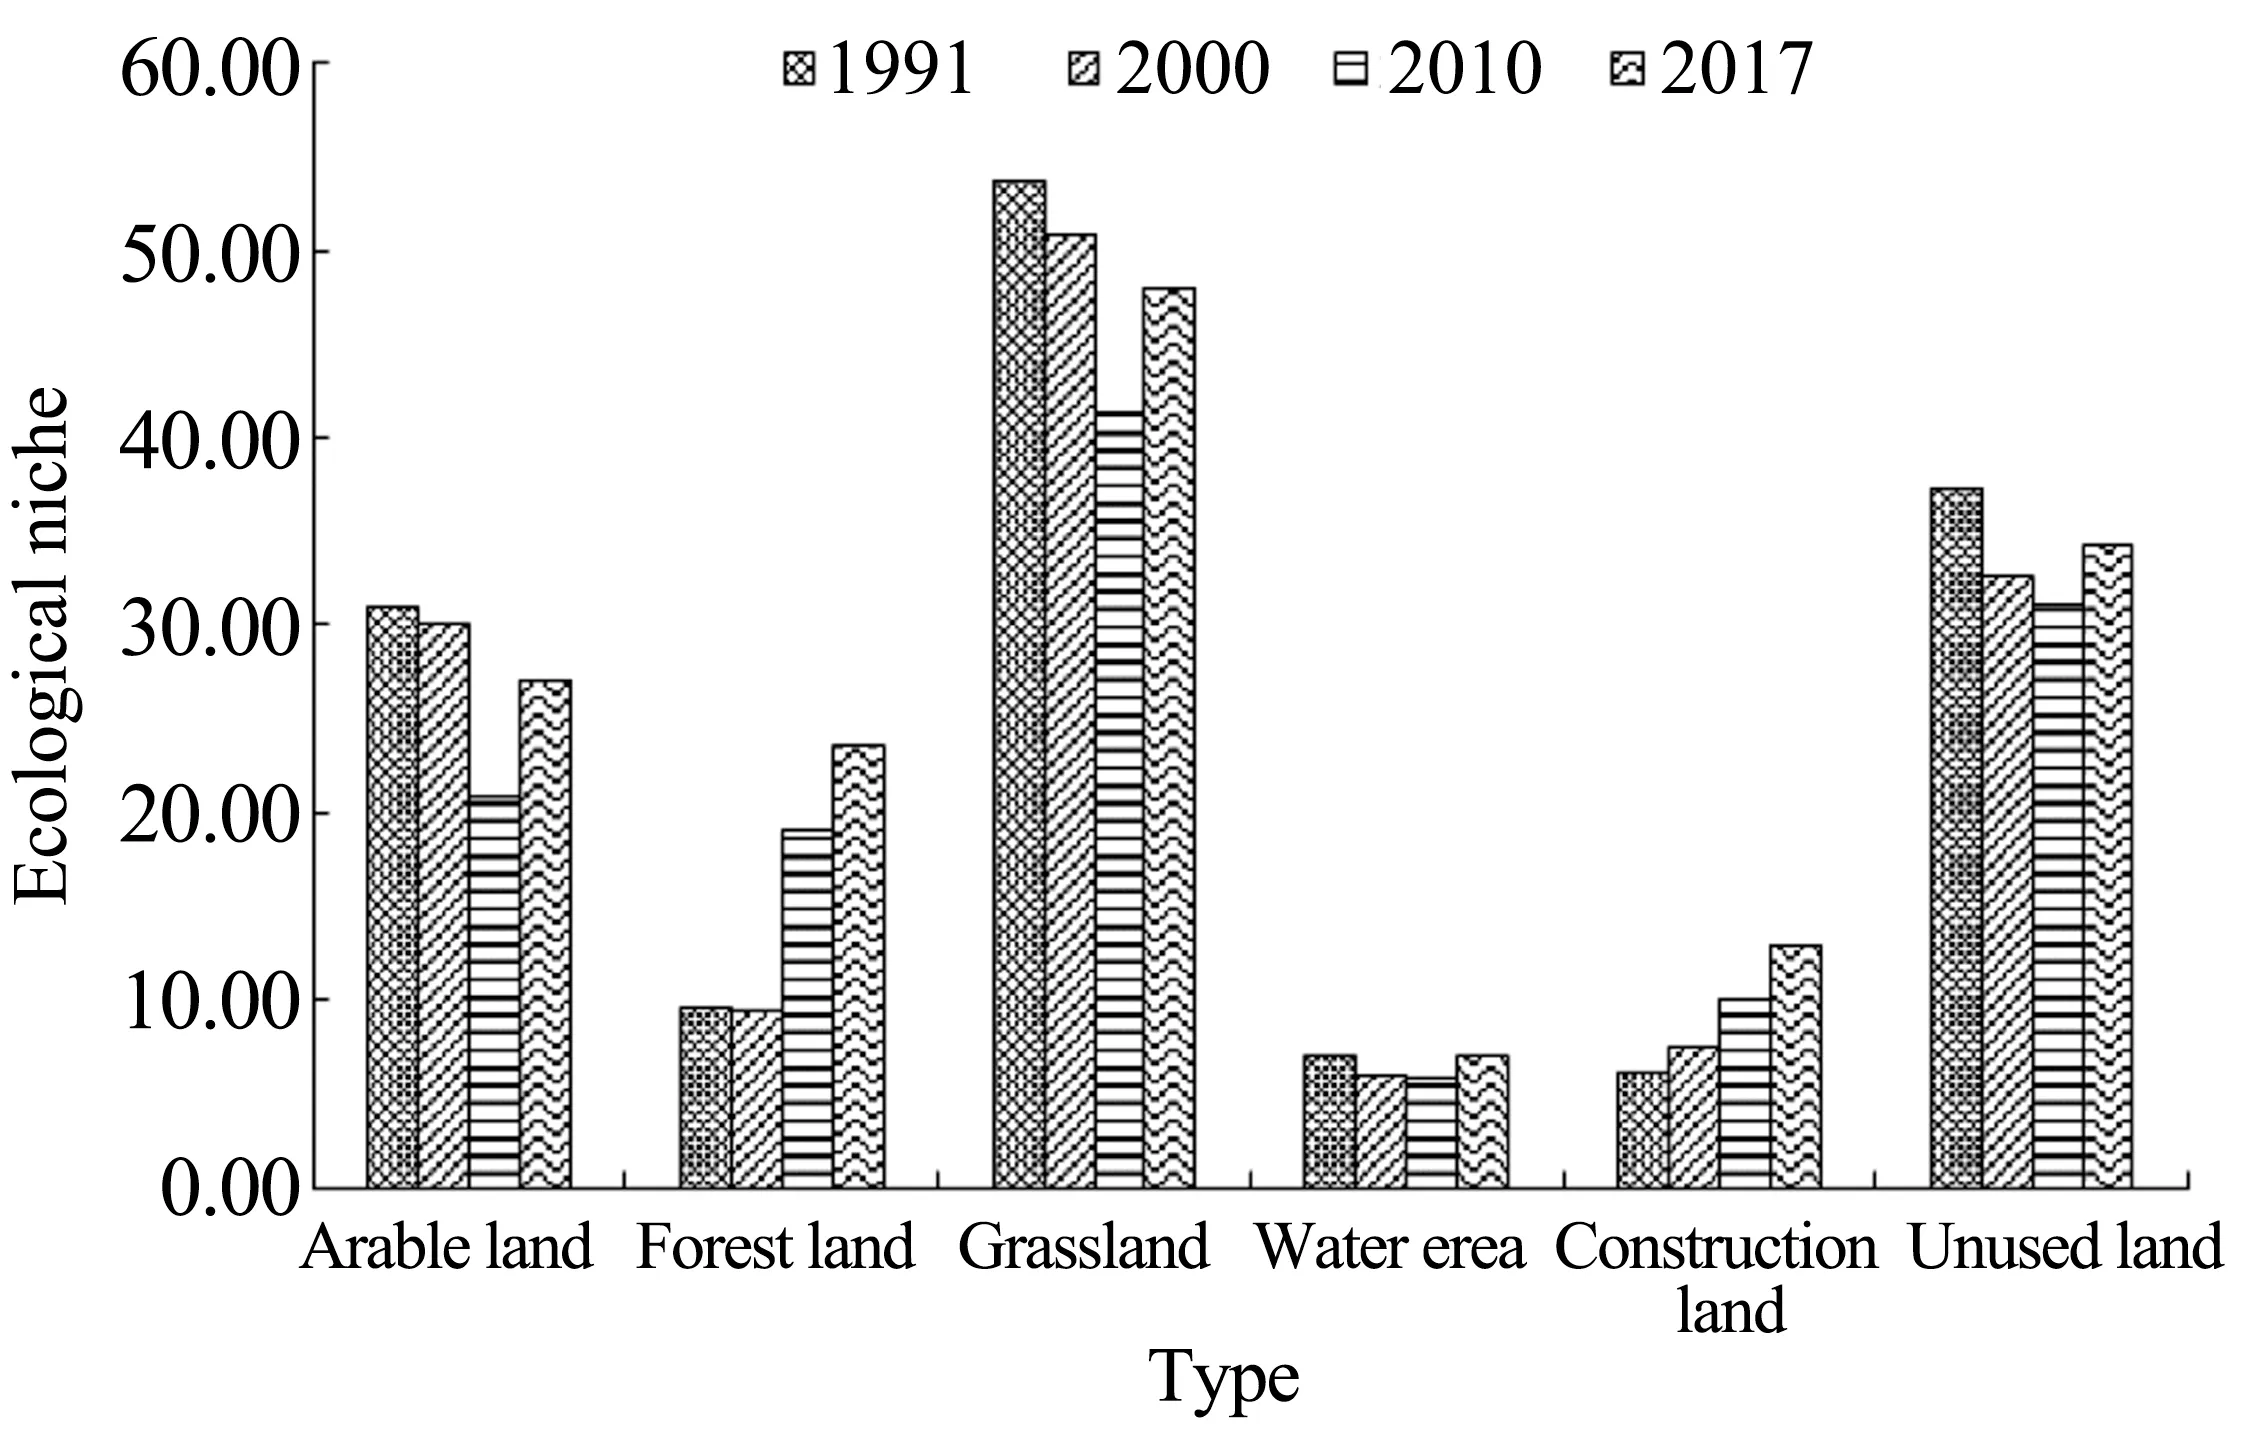
Figure 6 Ecological niche of each landscape component
4 Discussion
Landscape pattern index is a widely used quantita‐tive research method in landscape ecology,which cen‐ters mostly on landscape pattern and landscape dy‐namic information and thus provides a well under‐standing of the composition,spatial allocation and dy‐namic change process of a landscape pattern(Chen and Fu,1996;Zhanget al.,2003;Gonget al.,2009;Luet al.,2012).In order to comprehensively reflect the characteristics of landscape pattern and construct the niche model of landscape components,an evalua‐tion system based on quantitative analysis was estab‐lished by using landscape index analysis.
At present,only Ren and Wang(2007)have stud‐ied the landscape niche.By comparing the results of Ren and Wang(2007)to that of this study,we can see that similarities between them are that they both study the regional niche from the perspective of two-dimen‐sional space,which is more visualized and concrete.The difference is that the former integrated landscape pattern indices and ecosystem service values to study Yan'an region's landscape niche according to the ad‐ministrative region,while this study focused on the niche of landscape components in patch class metrics of landscape pattern indices.Another difference is that Ren and Wang(2007)ignore important informa‐tion that although the spatial morphological and struc‐tural variations of landscape ecosystems under vari‐ous dynamics and disturbances can also transform several spatial elements into each other,the stability and variation of spatial scale and system are the keys to the conceptual change of spatial elements(Wanget al.,1999).That is,the stability and variability of land‐scape components change the landscape stability and its spatial structure, so that the landscape pattern changes(Yang,2015;Zhouet al.,2007).In addition,since the change of landscape pattern reflects the change of regional ecological function and process,landscape pattern indices can quantitatively describe and monitor the change of landscape structure charac‐teristics with time.This change can also reflect the spatial differentiation of the change of landscape com‐ponents in this period to some extent(Shiet al.,2010),in which the landscape dominance indices can reflect the position of certain landscape component types in the landscape structure and its impact on the formation and change of landscape pattern(Fuet al.,2001).Therefore,this paper selected indices of land‐scape stability and landscape dominance to study the niche of landscape components.The results of our study shows that the dominant position of construc‐tion land is becoming more and more obvious,the niche of water area changes slightly and the niche of arable land,grassland and unused land is always high‐er than that of other landscape components.The afore‐mentioned results are basically consistent with the ac‐tual situation,indicating that the method is more suit‐able in the region and can reflect the change of the landscape pattern in the study area over the past 26 years.It can be seen that although this paper only chooses indices of landscape stability and landscape dominance to study the niche of landscape compo‐nents,it can more intuitively reflect the evolution characteristics of the landscape pattern on the basis of quantification.Therefore,this method can be widely applied to the study of landscape pattern characteriza‐tion in different regions,and has good universality.
In addition,some studies have shown that the land economic niche could well explain landscape pattern characteristics when combined with the landscape pat‐tern index,which is an important factor affecting the change of landscape pattern.Research have estab‐lished the land use niche model based on niche theory to study the change of land use structure(Zhanget al.,2002;Chenet al.,2010;Bajoccoet al.,2016).These results indicate that when the theory of land niche focuses on using the ecological benefits of land use types to reflect the contribution degree of differ‐ent land use types,the change of land niche changes the landscape heterogeneity,thus affecting the change of landscape pattern.Therefore,this study has a basis that the change of landscape pattern can be reflected by the evolution of landscape niche according to the results of these studies.Also,the change of landscape component niche is an important factor to change the landscape pattern.The rationality and suitability of landscape spatial structure can be deeply explored through the change of landscape component niche.The larger the niche of landscape components,the higher the position of landscape components the more obvious the role in the whole landscape.In summary,the niche model of landscape components based on landscape pattern index can reflect the changes of landscape pattern and can characterize the landscape pattern of Yanchi County.
This paper is a new attempt to apply the theory of niche to landscape ecology and the dynamic study of landscape component niche is carried out from the long time series,but there still exist some areas that can be used for future studies.This paper focuses on the county landscape as the research object,and uses only"n-dimentional hypervolume niche theory".The niche models of the landscape components were con‐structed based on the dimension of stability niche and the dimension of niche dominance to study the niche of the landscape components.However,a wide range of research areas,more niche dimensions and also in‐troduce the niche ecostate-ecorole theory,expansionreduction theory,suitability degree theory and overlap theory could be used in future research to make the study of regional landscape more specific and indepth.In addition,because Yanchi County is located in the ecotone between agriculture and animal hus‐bandry and belongs to the ecologically fragile area,it is necessary to study the landscape pattern in this ar‐ea.This study shows that Yanchi County should con‐tinue to implement the project of returning arable land to forestry and grassland,and take artificial restora‐tion measures to keep the overall landscape stable in future development processes.
5 Conclusions
By constructing the niche model of the landscape components,the authors studied the dynamic changes of landscape components niche in the direction of time and landscape components type.The main con‐clusions are as follows:
(1)There were differences in the values of domi‐nance and stability of each landscape component.Landscape components with high stability in 1991-2017 were grassland and unused land,and landscape components with poor stability were construction land and water area.From the change trend of time scale,stability values of arable land,water area and unused land show a downward trend on the whole,while woodland,grassland and construction land show an up‐ward trend on the whole.This trend was due to the fact that human activities affected the structure of each landscape component with the development of society,so the values of the stability of each landscape compo‐nent were different.Besides,from 1991 to 2000,the dominance degree of each landscape component was grassland >arable land >unused land >forest land >water area >construction land.From 2010 to 2017,the dominance degree of each landscape component was grassland >woodland >arable land >unused land >construction land >water area.From the change trend of time scale,the dominance value of arable land and grassland show a downward trend,while that of forest land,water area,construction land and unused land generally show an upward trend.This shows that the degree of exploitation of unused land and construc‐tion land was getting stronger and stronger,and the enhancement of dominance of forest land and water area was mainly related to the implementation of the policy of returning arable land to forest land and grassland in the research area.
(2)The niche of the same landscape component significantly differed at different time nodes.From the scattered layout map of the landscape components of Yanchi County in 1991-2017,the niche of arable land was highest in 1991 and 2000,and lowest in 2010,which was closely related to the policy of returning farmland to forest and grassland;The ecological niche of forest land in 2010 and 2017 was greater than that in 1991 and 2000,and the dominant position was higher;The niche of grassland in 1991 and 2017 was the high‐est,with the least niche recorded in 2010;The niche of water area in 2010 was the least but the highest in 2017,which shows that the ecological environment of the research area was getting better and better and the water conservation capacity of the soil was getting stronger and stronger;The niche of construction land in 1991-2017 was larger and larger,and the dominant position was more and more obvious;The niche of un‐used land in 1991 and 2000 was the highest and the least in 2010,mainly due to the increasing exploitation and utilization of unused land by humans.
(3)The niche of each landscape component in the same year was significantly different,and the control effect on the overall landscape also differed.In 1991,the niche of landscape components was grassland >unused land >arable land >forest land >water area >construction land,of which the niche of grassland was the largest and the niche of construction land was the smallest,which indicated that in 1991 grass‐land has the strongest dominant ability to the whole landscape and construction land has the weakest con‐trolling ability to the landscape.In 2000,the ecologi‐cal niche of landscape components shows that the niche of grassland was the largest and the value of water area was the smallest.This was because the gradual enhancement of human activities made the control of construction land to enhance the landscape with the development of time.The niche of forest land in 2010 and 2017 was greater than that in 1991 and 2000,with grassland being the least.This was mainly due to the control effect of grassland on land‐scape was weakened under the influence of human factors such as grazing,while the increasing domi‐nance of forest land was due to the reduction of defor‐estation by humans.
(4)The ecostate-ecorole change of the landscape component niche was different.From 1991 to 2017,the overall change characteristics of the niche of each landscape component were as follows:the niche of construction land was rising and the niche of forest land was on the rise,which indicated that the degree of construction land and forest land dominating land‐scape was becoming stronger.In addition,the niche of the water area was small and had no significant changes,which was related to environmental factors in the arid and vulnerable areas of the study area.Al‐so,the niche of arable land,grassland and unused land show a trend of decreasing first and then increas‐ing,but the niche of these landscape components was always higher than that of other landscape compo‐nents.This shows that grassland,unused land and cul‐tivated land had always been in a higher dominant po‐sition and had a strong ability to dominate the land‐scape.This shows that grassland,unused land and cul‐tivated land were always in a higher position and had a strong ability to dominate the landscape.
Acknowledgments:
This study is supported by the Fundamental Research Funds of Gansu Provincial Natural Science Fund of"Research on Land Use and Ecological Security in Ecologically Vulnerable Areas"(Project No.GSANZL-2015-045).The authors would like to thank all the teachers and master students of the Land Use Research Institute of Gansu Agricultural University for their ef‐forts in data collection,processing and verification.
 Sciences in Cold and Arid Regions2020年1期
- Sciences in Cold and Arid Regions的其它文章
- Characteristics of permafrost degradation in Northeast China and its ecological effects:A review
- Aeolian processes on sandy desertification of an alpine meadow:A wind tunnel experiment
- Soil-moisture dynamics and tree-water status in a Picea crassifolia forest,Qilian Mountains,China
- Culturable bacterial diversity in hypolithic and peripheral soils in the west of the Hexi Corridor desert and its influencing factors