2014—2019年北京和南京地区PM2.5和臭氧质量浓度相关性研究
2020-05-30 10:48:04孙金金黄琳龚康佳王雪颖李婧祎秦墨梅于兴娜胡建林
南京信息工程大学学报 2020年6期
孙金金 黄琳 龚康佳 王雪颖 李婧祎 秦墨梅 于兴娜 胡建林


摘要
自2014年以来,中国细颗粒物(PM2.5)浓度大幅度下降,但臭氧(O3)浓度逐年缓慢上升,厘清PM2.5和O3(P-O)相关性尤为关键.在本研究中,2014—2019年北京和南京PM2.5年均质量浓度下降幅度分别为-6.86和-6.15 μg·m-3·a-1;而日最大8小时平均O3质量浓度(MDA8 O3)年均增长幅度为1.50和1.75 μg·m-3·a-1.研究期间,北京地区MDA8 O3质量浓度小于100 μg·m-3,P-O呈负相关;而当质量浓度大于100 μg·m-3时,P-O为正相关.通过Pearson相关系数研究P-O两者相关性.在两个城市每月相关性分析中,在每日时间尺度5—9月为强的正相关;而小时时间尺度11月至次年2月趋于负相关.在北京,P-O每月和季节相关性变化大于南京.在日变化中,夏季在16时为强的正相关,春秋两季在13—17时为弱的正相关,而在春、秋和冬季8时,却为强的负相关.关键词
PM2.5;臭氧;相关性分析;北京;南京
中图分类号 X511
文献标志码 A
0 引言
细颗粒物(空气动力学直径≤2.5 μm,PM2.5)污染对呼吸系统、心血管系统等方面会造成严重的健康伤害[1-3].地表臭氧(O3)是一种危害人体健康、植被作物和陆地生态系统的有害气态污染物[4-6].当前,PM2.5和O3(P-O)是影响我国环境空气质量的主要污染物,大量研究表明有效实施P-O协同控制是解决我国复合大气污染问题的关键所在,也是我国下一阶段空气清洁行动的最大挑战[7-12].
自2013年,我国开始实施《大气污染防治行动计划》,采取了一系列严格的大气污染控制措施,使我国的大气污染形势发生了重大的改变.2013—2017年,中国PM2.5质量浓度下降30%~40%,细颗粒物浓度已经得到有效控制[13-17].与此同时,我国地表O3污染有所恶化.2013—2017年间,华北地区每日最大8小时平均O3(MDA8 O3)有明显增长趋势,质量浓度增长幅度有1.37 μg·m-3·a-1 [18].同一时期,我国东部地区的主要城市O3体积分数以(1~3)×10-9 a-1的速度增加[19].2014—2018年间,我国城市地区MDA8 O3在以平均每年4.6%的速度增长[20].
我国地表O3污染逐渐恶化的原因主要有,一者是近年来注重颗粒物的治理,PM2.5浓度下降,大气中的HO2自由基损失量减少,同时到达地面的太阳辐射增加,两者都有利于O3的形成,O3浓度随之逐年上升[18,21-22].同时,地面O3浓度的上升改变大气的氧化性[23],利于PM2.5二次组分(硝酸盐和二次有机气溶胶)的生成,硝酸盐和二次有机气溶胶的占比和重要性都有所上升[24-28].另一个原因是我国对O3的前体物(氮氧化物(NOx)和挥发性有机物(VOCS))的减排比例不协调,O3与NOx和VOCS存在复杂的非线性关系[29].据估算,近些年以来,我国NOx排放量下降幅度超过20%,但氨(NH3)和VOCs人为排放量却有增无减[14,19-20,30].若处于VOC控制区的情景下,这会对O3浓度生成产生相反的效果,导致O3浓度上升[19,30-31].
硝酸盐和二次有机气溶胶是由复杂的化学反应生成,其前体物也是NOx和VOCS[26,32].尽管P-O形成机制不同,但P-O有共同的前体物(NOx和VOCS),使得两者存在一定的相关性,并为两者的协同控制提供了基础.目前对P-O相关性已经做了一些研究[10,33-37],但这些研究在研究范围、时间尺度、研究方法等方面都有着不小的差异,同时P-O还受到不同时刻、地形、气象条件、污染物排放量等因素的影响,故他们得出的结论不尽相同.主要结果有,在中国研究发现P-O在夏季呈强正相关,在冬季呈负相关[35,37-39].
在本研究中,我们选择北京和南京作为主要研究城市,收集了2014—2019年P-O的小时浓度数据,同时考虑了两个时间尺度,即每日时间尺度和每小时时间尺度,试图从较长的研究年份、不同研究城市和两种时间尺度下,全面探讨P-O相关性的日变化、月均变化和年均变化,以确定P-O相关性在我国近些年来的变化,寻找P-O共同控制的可能,为以后空气污染控制策略提供参考,以进一步改善我国的空气质量.
1 数据收集和研究方法
1.1 研究城市和数据收集
华北地区和长三角地区是我国人口最集中和经济最发达的两个主要地区,这两个地区都有大量的城市群.在本研究中,为了对比两个地区P-O相关性的不同和相似之处,在两个区域各选择一个代表性的研究城市,北京和南京分别是两个地区的特大城市,之前也有许多研究选择北京和南京作为两个地区的代表城市[25,40-42],进行空气污染的研究.
我们分析了两个研究城市P-O小时空气质量监测数据,数据来自于中国国家环境监测中心(CNEMC)公布网站(http://113.108.142.147:20035/emcpublish/).P-O小时浓度数据的时间跨度为 2014年1月1日到2019年12月31日.P-O小时浓度数据集的测量方法在先前的一些研究和其中的参考文献中有详细的介绍[39,43-44],本文不再赘述.在本研究中,北京和南京国控观测站点的小时平均浓度代表各自城市站点的每小时浓度.
1.2 相关性分析方法
P-O之间的相关关系,我们考虑了小时和每日两种时间尺度.表1列出了用于计算P-O两个时间尺度下相关系数的计算数据标准.这里使用的小时时间尺度的指标是同一时刻的每小时P-O浓度,而每日时间尺度的指标是MDA8 O3和24小时日平均质量浓度.选择这些指标是基于我国当前的国家空气质量标准.
本研究采用Pearson相关系数(Pearson Correlation Coefficient (COR),其量值記为PCOR)计算P-O之间的相关性值,量化P-O之间的相关性.Person相关系数适用于两个变量的观测值是成对出现的,每对观测值之间相互独立,该系数在研究不同污染物之间的关系中被广泛使用[10,34,37],故也适用于P-O观测浓度的计算.
计算公式如下:
PCOR=∑ni=1(Xi-)(Yi-)∑ni=1(Xi-)2∑ni=1(Yi-)2,(1)
式中变量X和变量Y分别代表PM2.5和O3质量浓度,和分别为P-O质量浓度的平均值,i代表时间指标,n代表样本数.相关系数绝对值小于0.3为弱相关,大于0.5为强相关.
所有的相关性分析均使用MATLAB(R2016b)软件进行.2014—2019年小时和每日时间尺度下,计算每小时、每月、四季和多年的P-O相关系数.
2 结果与讨论
2.1 浓度变化趋势
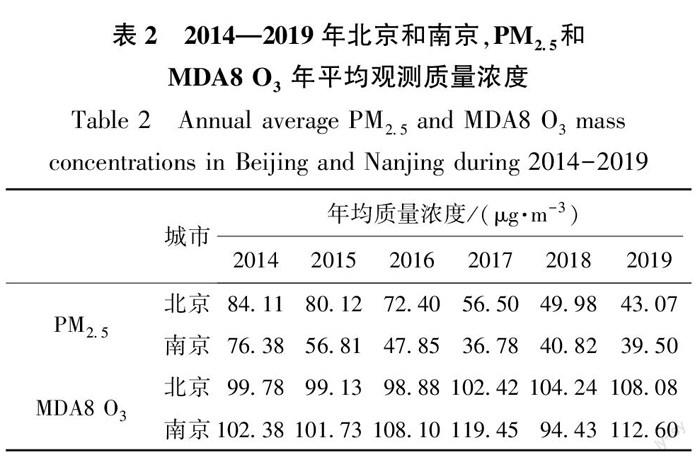
表2和图1显示了2014—2019年北京和南京的PM2.5和MDA8 O3每年和每月的平均觀测浓度.如表2所示:从2014—2019年,两个城市PM2.5年均质量浓度分别下降49%和48%,平均的变化幅度分别为-6.86和-6.15 μg·m-3·a-1,与之前研究结果一致[45-48].从图1a,1c可以看出秋冬季的月均质量浓度下降尤为剧烈,例如北京的10月至次年2月,原因是国家在冬季采取的严格的管控措施[49].然而,北京和南京的MDA8 O3年均质量浓度呈逐年缓慢上升趋势,研究期间,分别上升9%和10%,平均变化幅度分别为1.50和1.75 μg·m-3·a-1,与之前的研究结果相一致[50-51],尤其明显的是在夏季的月份,如图1b,1d所示:5—8月,北京和南京的月平均MDA8 O3质量浓度超过空气质量标准规定的160 μg·m-3.
综上所述,近6年来北京和南京由于实施了有效的污染控制措施使得PM2.5质量浓度持续下降,但同时O3污染却没有得到控制,O3污染情况加剧,尤其是夏季O3污染.
图2显示了在小时和每日时间尺度上,随着O3质量浓度的上升PM2.5质量浓度对应的变化情况.在北京的两个时间尺度,当O3质量浓度小于100 μg·m-3时,O3平均质量浓度的上升对应着PM2.5平均质量浓度下降,两者相关性为负,原因是PM2.5的气溶胶辐射效应和表面非均相化学反应减弱,使大气光化学反应增强和自由基含量增加,导致O3升高[8,21-22].当O3质量浓度大于100 μg·m-3时,O3平均质量浓度上升的同时PM2.5平均质量浓度也随着上升,两者相关性由负变为正,原因是大气氧化能力增强和加速二次转化[23].在南京,当O3质量浓度在150 μg·m-3左右时,也出现上述的现象.P-O之间确实存在着某种相关性,下一节中会进一步讨论在研究期间,P-O在每个月、四季和每小时相关性的变化情况.
2.2 P-O相关性
图3描述的是在2014至2019年间,两个时间尺度下,两个研究城市不同月份的P-O相关系数.在北京近6年相关性分析中,如图3a所示,每日尺度下,不同月份的P-O COR有显著的变化,在5—9月COR值大于0.5,是强的正相关关系;而在冬季11月至次年2月中COR值小于-0.5,这4个月平均COR值为-0.6,是显著的负相关关系,其他月份的COR是在正负之间过渡.图3c北京小时尺度下,在11月至次年2月的相关性类似,唯一不同的是在5—9月COR值在0至0.3之间,为弱的正相关.在图3b南京的每日尺度中,6—9月COR值大于0.5,P-O两者是强的正相关,与北京结果相同,而其余月份的COR值在0至0.5之间,是弱的正相关关系.图3d南京小时尺度中,5—9月情况与北京的相同,但其他月的COR值在-0.5至0之间,相关性是弱的负相关.由此可见,在小时和每日时间尺度上,两个城市在5—9月P-O都为正相关关系,每日的正相关更为显著,为强的正相关;北京在11月至次年2月的负相关关系比南京的更为显著,是强的负相关,并且小时尺度比每日尺度的负相关更为显著.北京的逐月相关性的变化幅度较大,南京相对平缓一些,这可能是城市所在纬度不同而导致的[36].
图4显示了两个城市在两个时间尺度上的P-O相关系数在不同季节的变化情况.结果表明,在两种时间尺度上,P-O在夏季更趋于正相关,而在冬季更趋于负相关.与之前的研究结果相一致[35,37-39].在夏季,每日的正相关性更为显著,为强的正相关,小时时间尺度是弱的正相关,南京的COR值多数年份大于北京的;在冬季,北京的负相关关系比南京的更为显著,是强的负相关,且小时比每日时间尺度计算出的负相关更为显著.此外,北京P-O相关性的季节变化幅度比南京的大,与图3的结果一致.P-O夏季趋于正相关,可能是夏季PM2.5浓度较低,光照强烈,由于两者有共同的前体物,并且P-O通过光化学反应同时产生,故相关性为正.P-O冬季趋于强负相关,可能是冬季PM2.5浓度较高,光照较弱和自由基相对少,影响O3的生成,故相关性为负.
2.3 P-O相关性的日变化
由于不同时刻的气象条件、污染物排放量等因素的不同,导致P-O都有明显的日变化.研究发现,2013—2016年北京和上海的爆发性增长过程中,PM2.5小时浓度具有双峰现象,在早晚出行高峰有高值,8—9时和18—19时,低值在16时左右[28].本研究中发现北京和南京的季节性平均PM2.5小时浓度呈单峰分布,高峰在8—9时,最低值在16时左右,而O3浓度的日变化趋势却相反,峰值在14—16时,最低值在7—9时.故长时间跨度P-O小时浓度的峰值和低值是相对的.此外还发现,在夏季南京大气光氧化反应剧烈的过程中,在8时O3质量浓度基本在60 μg·m-3以下,而到12时,可骤增长到180 μg·m-3以上,增长速率达30 μg·m-3·h-1.
图5显示2014—2019年间,四季和全年P-O COR值的日变化.如图5所示,在北京和南京全年和四季中,P-O COR值的变化趋势和臭氧日变化相似,0—8时都有下降趋势,在8时左右达到最低值,随后COR值上升,在14—16时达到最大,随后下降,这可能是大气氧化性的变化而导致的.在夏季,只有在8时左右COR值为负或者接近于0,其他时刻COR值都大于0,在16时左右COR值大于0.4,为强的正相关.而在冬季,北京的所有时刻的P-O COR值都为负,0—24时P-O都为强的负相关,而南京会在14—15时P-O COR值大于0,呈微弱的正相关.夏季和冬季P-O COR值的不同变化,可能是由于气象的差异造成的,例如气象要素温度、相对湿度和风速的不同,需要以后进一步的分析证明.两城市在春秋季都有部分时刻(13—17时)COR值大于0,其余时刻COR值小于0,在8时左右为强烈负相关.
Chu等[34]指出由于不利气象条件或污染物区域输送的影响,各种大气污染物浓度同步增长,导致PM2.5和气态污染物(NOx和SO2)普遍存在强正相关.而本研究发现,P-O相关性不同,随着季节和时刻而变化,夏季8时左右时为负相关,其他都为正相关;春秋季,只在13—16时相关性为正,而冬季P-O为强的负相关.
在未来的研究中,将会考虑气象条件和前体物排放量对P-O相关性的影响,进一步明确不同季节里P-O相关性的主要影响因素,从而为两者的协同控制提供科学依据.
3 结论
利用2014年1月至2019年12月北京和南京的PM2.5和O3的小时质量浓度,分析P-O质量浓度的变化情况,同时用Pearson相关系数研究P-O相关性的变化.
探讨北京和南京在两种时间尺度下,P-O相关性的日变化、月均变化和年均变化.主要结论有:
1)2014—2019年,北京和南京的PM2.5年均质量浓度总体下降,分别下降49%和48%,平均下降幅度分别为-6.86和-6.15 μg·m-3·a-1;而MDA8 O3年均质量浓度缓慢上升,分别上升9%和10%,平均增长幅度分别为1.50和1.75 μg·m-3·a-1.尤其是在夏季,O3污染愈加严重.
2)研究期内,北京在两个时间尺度分析上,O3质量浓度小于100 μg·m-3时,O3质量浓度的上升对应着PM2.5质量浓度下降,P-O为负相关,当O3质量浓度大于100 μg·m-3时,O3质量浓度上升,PM2.5质量浓度也有所上升,P-O为正相关.南京也有上述现象,但O3质量浓度值是150 μg·m-3.
3)在两个时间尺度上,北京和南京在5—9月P-O都为正相关,每日时间尺度的正相关更为显著;北京在11—次年2月为强的负相关,小时时间尺度的负相关更为显著.北京较南京,6年中12个月的相关性变化幅度较大.
4)在两个时间尺度上,北京和南京的P-O在夏季为强的正相关,COR值>0.5;而在冬季更趋于负相关,北京是强的负相关,COR值<-0.5,南京是弱的负相关;夏季,每日时间尺度的正相关性更为显著,冬季小时时间尺度的负相关更为显著.
5)在小时时间尺度上,北京和南京的P-O COR值的变化趋势与O3浓度日变化相似,8时左右达到最低值,14—16时达到最高.夏季在16时左右COR值>0.4,为强的正相关;冬季在8时左右COR值<-0.5,为强的负相关;春秋季都在13—17时COR值>0,为弱的正相关,8时左右为强烈负相关.
参考文献
References
[1]Wang H,Li J W,Gao M,et al.Spatiotemporal variability in long-term population exposure to PM2.5 and lung cancer mortality attributable to PM2.5 across the Yangtze River Delta (YRD) region over 2010-2016:a multistage approach[J].Chemosphere,2020,257:127153
[2] Wang N,Mengersen K,Tong S L,et al.County-level variation in the long-term association between PM2.5 and lung cancer mortality in China[J].Science of the Total Environment,2020,738:140195
[3] Xie Y,Dai H C,Zhang Y X,et al.Comparison of health and economic impacts of PM2.5 and ozone pollution in China[J].Environment International,2019,130:104881
[4] Feng Z Z,de Marco A,Anav A,et al.Economic losses due to ozone impacts on human health,forest productivity and crop yield across China[J].Environment International,2019,131:104966
[5] Lu X,Zhang L,Wang X L,et al.Rapid increases in warm-season surface ozone and resulting health impact in China since 2013[J].Environmental Science & Technology Letters,2020,7(4):240-247
[6] Feng Z Z,Hu T J,Tai A P K,et al.Yield and economic losses in maize caused by ambient ozone in the North China Plain (2014-2017)[J].Science of the Total Environment,2020,722:137958
[7] 李紅,彭良,毕方,等.我国PM2.5与臭氧污染协同控制策略研究[J].环境科学研究,2019,32(10):1763-1778
LI Hong,PENG Liang,BI Fang,et al.Strategy of coordinated control of PM2.5 and ozone in China[J].Research of Environmental Sciences,2019,32(10):1763-1778
[8] Li K,Jacob D J,Liao H,et al.A two-pollutant strategy for improving ozone and particulate air quality in China[J].Nature Geoscience,2019,12(11):906-910
[9] Xiang S L,Liu J F,Tao W,et al.Control of both PM2.5 and O3 in Beijing-Tianjin-Hebei and the surrounding areas[J].Atmospheric Environment,2020,224:117259
[10] Zhu J,Chen L,Liao H,et al.Correlations between PM2.5 and ozone over China and associated underlying reasons[J].Atmosphere,2019,10(7):352
[11] 杜禎宇,殷惠民,张烃.细颗粒物与臭氧协同控制的方法和必要性[J].世界环境,2018(1):19-20
DU Zhenyu,YIN Huimin,ZHANG Ting.The methods and necessity of coordinated control of fine particulate matter and ozone [J].World Environment,2018(1):19-20
[12] 张华,陈琪,谢冰,等.中国的PM2.5和对流层臭氧及污染物排放控制对策的综合分析[J].气候变化研究进展,2014,10(4):289-296
ZHANG Hua,CHEN Qi,XIE Bing,et al.PM2.5 and tropospheric ozone in China and pollutant emission controlling integrated analyses[J].Progressus Inquisitiones DE Mutatione Climatis,2014,10(4):289-296
[13] 王跃思,李文杰,高文康,等.2013—2017年中国重点区域颗粒物质量浓度和化学成分变化趋势[J].中国科学:地球科学,2020,50(4):453-468
WANG Yuesi,LI Wenjie,GAO Wenkang,et al.Trends in particulate matter and its chemical compositions in China from 2013-2017[J].Science China Earth Sciences,2020,50(4):453-468
[14] Zheng B,Tong D,Li M,et al.Trends in Chinas anthropogenic emissions since 2010 as the consequence of clean air actions[J].Atmospheric Chemistry and Physics,2018,18(19):14095-14111
[15] Wang Y H,Gao W K,Wang S,et al.Contrasting trends of PM2.5 and surface-ozone concentrations in China from 2013 to 2017[J].National Science Review,2020,7(8):1331-1339
[16] Feng Y Y,Ning M,Lei Y,et al.Defending blue sky in China:effectiveness of the “Air Pollution Prevention and Control Action Plan” on air quality improvements from 2013 to 2017[J].Journal of Environmental Management,2019,252:109603
[17] Cheng J,Su J P,Cui T,et al.Dominant role of emission reduction in PM2.5 air quality improvement in Beijing during 2013-2017:a model-based decomposition analysis[J].Atmospheric Chemistry and Physics,2019,19(9):6125-6146
[18] Fan Y F,Ding X T,Hang J,et al.Characteristics of urban air pollution in different regions of China between 2015 and 2019[J].Building and Environment,2020,180:107048
[19] Li K,Jacob D J,Liao H,et al.Anthropogenic drivers of 2013-2017 trends in summer surface ozone in China[J].Proceedings of the National Academy of Sciences of the United States of America,2019,116(2):422-427
[20] Fan H,Zhao C F,Yang Y K.A comprehensive analysis of the spatio-temporal variation of urban air pollution in China during 2014-2018[J].Atmospheric Environment,2020,220:117066
[21] Xing J,Wang J D,Mathur R,et al.Impacts of aerosol direct effects on tropospheric ozone through changes in atmospheric dynamics and photolysis rates[J].Atmospheric Chemistry and Physics,2017,17(16):9869-9883
[22] Li J,Wang Z,Wang X,et al.Impacts of aerosols on summertime tropospheric photolysis frequencies and photochemistry over central eastern China[J].Atmospheric Environment,2011,45(10):1817-1829
[23] Lu K D,Guo S,Tan Z F,et al.Exploring atmospheric free-radical chemistry in China:the self-cleansing capacity and the formation of secondary air pollution[J].National Science Review,2019,6(3):579-594
[24] Huang R J,Zhang Y L,Bozzetti C,et al.High secondary aerosol contribution to particulate pollution during haze events in China[J].Nature,2014,514(7521):218-222
[25] Sun P,Nie W,Wang T Y,et al.Impact of air transport and secondary formation on haze pollution in the Yangtze River Delta:in situ online observations in Shanghai and Nanjing[J].Atmospheric Environment,2020,225:117350
[26] Fu X,Wang T,Gao J,et al.Persistent heavy winter nitrate pollution driven by increased photochemical oxidants in northern China[J].Environmental Science & Technology,2020,54(7):3881-3889
[27] Xu Q C,Wang S X,Jiang J K,et al.Nitrate dominates the chemical composition of PM2.5 during haze event in Beijing,China[J].Science of the Total Environment,2019,689:1293-1303
[28] Sun J J,Liang M J,Shi Z H,et al.Investigating the PM2.5 mass concentration growth processes during 2013-2016 in Beijing and Shanghai[J].Chemosphere,2019,221:452-463
[29] Atkinson R.Atmospheric chemistry of VOCs and NOx[J].Atmospheric Environment,2000,34(12/13/14):2063-2101
[30] Wang N,Lyu X P,Deng X J,et al.Aggravating O3 pollution due to NOx emission control in eastern China[J].Science of the Total Environment,2019,677:732-744
[31] 漏嗣佳,朱彬,廖宏.中國地区臭氧前体物对地面臭氧的影响[J].大气科学学报,2010,33(4):451-459
LOU Sijia,ZHU Bin,LIAO Hong.Impacts of O3 precursor on surface O3 concentration over China[J].Transactions of Atmospheric Sciences,2010,33(4):451-459
[32] Guo S,Hu M,Zamora M L,et al.Elucidating severe urban haze formation in China[J].Proceedings of the National Academy of Sciences,2014,111(49):17373-17378
[33] 邵平,辛金元,安俊琳,等.长三角工业区夏季近地层臭氧和颗粒物污染相互关系研究[J].大气科学,2017,41(3):618-628
SHAO Ping,XIN Jinyuan,AN Junlin,et al.An analysis on the relationship between ground-level ozone and particulate matter in an industrial area in the Yangtze River Delta during summer time[J].Chinese Journal of Atmospheric Sciences,2017,41(3):618-628
[34] Chu B W,Ma Q X,Liu J,et al.Air pollutant correlations in China:secondary air pollutant responses to NOx and SO2 control[J].Environmental Science & Technology Letters,2020.DOI:10.1021/acs.estlett.0c00403
[35] Jia M W,Zhao T L,Cheng X H,et al.Inverse relations of PM2.5 and O3 in air compound pollution between cold and hot seasons over an urban area of East China[J].Atmosphere,2017,8(12):59
[36] Chen J J,Shen H F,Li T W,et al.Temporal and spatial features of the correlation between PM2.5 and O3 concentrations in China[J].International Journal of Environmental Research and Public Health,2019,16(23):4824
[37] Zhao H,Zheng Y F,Li C.Spatiotemporal distribution of PM2.5 and O3 and their interaction during the summer and winter seasons in Beijing,China[J].Sustainability,2018,10(12):4519
[38] Chen K,Zhou L,Chen X D,et al.Acute effect of ozone exposure on daily mortality in seven cities of Jiangsu province,China:no clear evidence for threshold[J].Environmental Research,2017,155:235-241
[39] Wang Y G,Ying Q,Hu J L,et al.Spatial and temporal variations of six criteria air pollutants in 31 provincial capital cities in China during 2013-2014[J].Environment International,2014,73:413-422
[40] Shu L,Wang T J,Xie M,et al.Episode study of fine particle and ozone during the CAPUM-YRD over Yangtze River Delta of China:characteristics and source attribution[J].Atmospheric Environment,2019,203:87-101
[41] Yang Y R,Liu X G,Qu Y,et al.Characteristics and formation mechanism of continuous hazes in China:a case study during the autumn of 2014 in the North China Plain[J].Atmospheric Chemistry and Physics,2015,15(14):8165-8178
[42] Li J Y,Liu Z R,Cao L M,et al.Highly time-resolved chemical characterization and implications of regional transport for submicron aerosols in the North China Plain[J].Science of the Total Environment,2020,705:135803
[43] Hu J L,Wang Y G,Ying Q,et al.Spatial and temporal variability of PM2.5 and PM10 over the North China Plain and the Yangtze River Delta,China[J].Atmospheric Environment,2014,95:598-609
[44] Hu J L,Ying Q,Wang Y G,et al.Characterizing multi-pollutant air pollution in China:comparison of three air quality indices[J].Environment International,2015,84:17-25
[45] Zhai S X,Jacob D J,Wang X,et al.Fine particulate matter (PM2.5) trends in China,2013-2018:separating contributions from anthropogenic emissions and meteorology[J].Atmospheric Chemistry and Physics,2019,19(16):11031-11041
[46] Xiao Q Y,Geng G N,Liang F C,et al.Changes in spatial patterns of PM2.5 pollution in China 2000-2018:impact of clean air policies[J].Environment International,2020,141:105776
[47] Xue T,Zheng Y X,Tong D,et al.Spatiotemporal continuous estimates of PM2.5 concentrations in China,2000-2016:a machine learning method with inputs from satellites,chemical transport model,and ground observations[J].Environment International,2019,123:345-357
[48] Zhang Y M,Vu T V,Sun J Y,et al.Significant changes in chemistry of fine particles in wintertime Beijing from 2007 to 2017:impact of clean air actions[J].Environmental Science & Technology,2020,54(3):1344-1352
[49] Qiu J.Fight against smog ramps up:Chinese government to provide incentives for heavy polluters to go green,but analysts question whether its wider air-quality strategy goes far enough[J].Nature,2014,506(7488):273-275
[50] Liu R Y,Ma Z W,Liu Y,et al.Spatiotemporal distributions of surface ozone levels in China from 2005 to 2017:a machine learning approach[J].Environment International,2020,142:105823
[51] Chen L,Guo B,Huang J S,et al.Assessing air-quality in Beijing-Tianjin-Hebei region:the method and mixed tales of PM2.5 and O3[J].Atmospheric Environment,2018,193:290-301
Correlation between surface PM2.5 and ozone during
2014-2019 in Beijing and Nanjing
SUN Jinjin1 HUANG Lin1 GONG Kangjia1 WANG Xueying1
LI Jingyi1 QIN Momei1 YU Xingna2 HU Jianlin1
1 Jiangsu Key Laboratory of Atmospheric Environment Monitoring and Pollution Control/Collaborative Innovation Center of
Atmospheric Environment and Equipment Technology,Nanjing University of Information Science and Technology,Nanjing 210044
2 Key Laboratory of Meteorological Disaster,Ministry of Education/Joint International Research Laboratory of Climate and
Environment Change/Collaborative Innovation Center on Forecast and Evaluation of Meteorological Disasters/
Key Laboratory for Aerosol-Cloud-Precipitation of China Meteorological Administration,
Nanjing University of Information Science and Technology,Nanjing 210044
Abstract It is particularly important to clarify the correlation between fine particulate matter (PM2.5) and O3 (P-O) in account of the seemingly increasing surface ozone and decreasing PM2.5 trends in China since 2014.Therefore,observations of hourly PM2.5 and O3 data for Beijing and Nanjing during 2014 to 2019 were summarized to reveal their P-O correlations.The observations showed a decreasing trend of annual average PM2.5 mass concentration,which was -6.86 and -6.15 μg·m-3·a-1 for Beijing and Nanjing,respectively.While the annual maximum daily 8-hour average O3 (MDA8 O3) increased by 1.50 and 1.75 μg·m-3·a-1 for Beijing and Nanjing,respectively.O3 pollution became more serious in summer for both cities.For Beijing,when O3 mass concentration was below/above 100 μg·m-3,the increase of O3 concentration would correspond to the decrease/increase of PM2.5 concentration,indicating a negative/positive P-O correlation.The same varying P-O correlation existed for Nanjing,except for the different critical value of O3 mass concentration of 150 μg·m-3.Significantly positive P-O correlation,indicated by Pearson correlation coefficient (COR) being larger than 0.5 on daily time scale,was found in both Beijing and Nanjing during May to September.While significantly negative P-O correlation,indicated by COR value being smaller than -0.5 on hourly time scale,was found for both Beijing and Nanjing during November to February.Compared with Nanjing,monthly and seasonal P-O correlation varied more greatly for Beijing.As for the diurnal variation,there was a significantly positive P-O correlation at 16:00 in summer and a weakly positive correlation during 13:00-17:00 in spring and autumn,and a significantly negative correlation at 08:00 in spring,autumn and winter.
Key words PM2.5;O3;correlation analysis;Beijing;Nanjing
收稿日期
2020-10-09
資助项目 国家重点研发计划(2018YFC0213800);国家自然科学基金(41675125,42007187)作者简介
孙金金,男,硕士生,研究方向为大气污染控制和空气质量数值模拟.jinjinsun@nuist.edu.cn
黄琳(通信作者),女,博士,教授,研究方向为空气污染气象学、大气污染控制和健康效应等.huang-nuist@163.com
猜你喜欢
商丘师范学院学报(2023年9期)2023-09-06 06:03:42
天津医科大学学报(2021年1期)2021-12-05 11:11:05
煤气与热力(2021年10期)2021-12-02 05:11:46
力学学报(2021年10期)2021-12-02 02:32:04
能源工程(2021年1期)2021-04-13 02:06:12
中学生数理化·八年级物理人教版(2017年12期)2017-04-18 12:59:46
中国医学影像技术(2017年11期)2017-01-16 12:54:05
中国蔬菜(2016年8期)2017-01-15 14:23:43
水利技术监督(2016年6期)2017-01-15 14:01:30
考试周刊(2016年63期)2016-08-15 14:33:26