
Anisotropic surface roughness and shear behaviors of rough-walled plaster joints under constant normal load and constant normal stiffness conditions
2020-04-17 13:48RichengLiuShaLouXiaojingLiGuanshengHanYujingJiang
Richeng Liu ,Sha Lou ,Xiaojing Li ,Guansheng Han ,Yujing Jiang
a State Key Laboratory for Geomechanics and Deep Underground Engineering,China University of Mining and Technology,Xuzhou,221116,China
b School of Engineering,Nagasaki University,Nagasaki,852-8521,Japan
c Department of Hydraulic Engineering,Tongji University,Shanghai,200092,China
d School of Civil Engineering,Shandong Jianzhu University,Jinan,116024,China
e State Key Laboratory of Mining Disaster Prevention and Control,Shandong University of Science and Technology,Qingdao,266590,China
Keywords:Joint Constant normal load(CNL)Constant normal stiffness(CNS)Shear anisotropy Surface roughness
A B S T R A C T In this context,we experimentally studied the anisotropic mechanical behaviors of rough-walled plaster joints using a servo-controlled direct shear apparatus under both constant normal load(CNL)and constant normal stiffness(CNS)conditions.The shear-induced variations in the normal displacement,shear stress,normal stress and sheared-off asperity mass are analyzed and correlated with the inclination angle of the critical waviness of joint surfaces.The results show that CNS condition gives rise to a smaller normal displacement due to the larger normal stress during shearing,compared with CNL condition.Under CNL conditions,there is one peak shear stress during shearing,whereas there are no peak shear stress for some cases and two peaks for other cases under CNS conditions depending on the geometry of joint surfaces.The inclination angle of the critical waviness has been verified to be capable of describing the joint surface roughness and anisotropy.The joint surface is more significantly damaged under CNS conditions than that under CNL conditions.With increment of the inclination angle of the critical waviness,both the normal displacement and sheared-off asperity mass increase,following power law functions;yet the coefficient of determination under CNL conditions is larger than that under CNS conditions.This is because the CNS condition significantly decreases the inclination angle of the critical waviness during shearing due to the larger degree of asperity degradation.
1. Introduction
The mechanical behaviors of rock masses are commonly anisotropic,from a single joint scale to a complex joint network scale(Barton and Quadros,2015).The joint existing in the rocks plays an important role due to its weaker mechanical properties,compared with that of the intact rocks(Jing,2003).Therefore,understanding the anisotropic properties such as surface roughness and dilation during shearing of a single joint is the mechanistic underpinning,with respect to complex rock masses that contain a large number of joints.
The rock masses slip along the joint when earthquake occurs or underground projects such as tunnels are excavated(Rice,2006;Liu et al.,2018).The joint deformation can influence the mechanical behavior of rock masses and safety of underground structures.Therefore,many studies focused on the mechanical behaviors of rock joints during shearing by considering the effects of joint surface roughness(Indraratna et al.,2015),normal stress/displacement(Xiong et al.,2011),shear stress/displacement(Yeo et al.,1998;Esaki et al.,1999),and stiffness of surrounding rock masses(Jiang et al., 2006). It is acknowledged that the joint surface roughness plays a key role during shearing,because the joint dilates by climbing the asperities of the rough surface(Olsson and Barton, 2001). Some analytical and/or semi-analytical models have taken into account the joint surface roughness(Indraratna et al.,2015;Li et al.,2019).The joint roughness coefficient(JRC)proposed by Barton and Choubey(1977)has been used to a large extent to characterize the roughness of profiles of joint surfaces(Li and Huang,2015),and has been implemented into the JRC-JCS model(Barton,1982;Du et al.,2011;Liu et al.,2014),where JCS represents the joint wall compressive strength.Determination of the JRC is subjective and significantly depends on personal experiences(Beer et al.,2002).Since the JRC is a two-dimensional parameter, ISRM (1981) suggested that during shearing, the average value of JRC of a series of profiles that cut the joint surface along the shearing direction can be used to estimate the roughness of a three-dimensional(3D)joint surface(Wang et al.,2016;Huang et al.,2018).The averaged JRC value discounts the effect of the asperity that has the largest up slope angle,which has been confirmed to dominate the shear-induced dilation(Hong et al.,2008).Li et al.(2018)investigated two-order asperity degradation of rock joints,in which the geometric properties of joint surface are characterized by critical waviness and critical unevenness.The critical waviness represents the critical large-scale undulations,which induce dilation during shearing and are difficult to be completely sheared off.The critical unevenness represents the small-scale roughness that would be sheared off during shearing(ISRM,1978).Then,an analytical model considering asperity geometries that have the largest up slope angle is proposed to predict the mechanical behaviors of rock joints during shearing,and the results agree well with the experimental results.Compared with the geometries of the critical unevenness,the geometries of critical waviness such as inclination angle and wavelength play a more significant role.Besides,the geometries of critical waviness for the profiles obtained by cutting the joint surface along different directions are different,which have the potential to characterize the anisotropic joint surface roughness.
The constant normal load (CNL) condition is commonly employed to investigate the shearing of a joint that is free to dilate in direction perpendicular to the joint plane,which is applicable for free rock blocks sliding upon slopes(Patton,1966;Barton and Choubey,1977;Jing et al.,1993;Reitsma and Kueper,1994;Oh et al.,2015).Another reason that the CNL condition is acceptable is that it can be easily carried out in the laboratory experiment(Ladanyi and Archambault,1969;Schneider,1976;Grasselli and Egger,2003).Li et al.(2017)proposed a fractal model to predict the shear behavior of a large-scale rock joint during shearing under CNL conditions.Oh et al.(2017)numerically studied the dilation of a saw-toothed rock joint during shearing under CNL conditions.They reported that the relative normal stress is the most sensitive parameter to the shear-induced dilation.However,for the deepseated joints,the surrounding rock masses are applied on the joints,constraining the shear-induced dilation.Hence,the CNL condition is not applicable and the constant normal stiffness(CNS)condition should be applied(Johnston et al.,1987;Indraratna et al.,1999;Jiang et al.,2004;Huang et al.,2019).The CNS condition maintains a constant stiffness and gives rise to the increase in the normal stress with the increment of the dilation.The increased normal stress decreases the normal displacement of joints,while the dilation increases the normal displacement during shearing.Therefore,the normal displacement of a joint during shearing under CNS conditions is generally smaller than that under CNL conditions(Lee et al.,2014;Shrivastava and Rao,2015).
However,in nature,the joint surfaces and the shear behaviors of joints are anisotropic and the direct shear tests under CNS conditions to characterize these anisotropies have rarely been reported.In the present study,first,a total of 32 plaster joint samples were prepared with different surface roughness and were used for shear tests under both CNL and CNS conditions using a servo-controlled shear testing apparatus.Then the physico-mechanical behaviors including normal displacement,shear stress,and normal stress during shearing were analyzed.Finally,the inclination angle of the critical waviness of joint surfaces was used to estimate variations in the normal displacement and sheared-off asperity mass.
2. Experimental setup
2.1. Sample preparation and surface measurement
Four granite rocks were cut and polished to cubic blocks that have a side length of 100 mm.Then,Brazilian test was carried out to manufacture tensile joints along the middle of the blocks in the height direction.The loading speed of the tensile stress is fixed at 0.01 MPa/s.The four joints were generated with different asperity distributions and different surface roughness.One half was used as the mold and put into a cubic steel box that has an internal length of 100 mm.A mixture of plaster,water and retardant at a ratio of 1:0.2:0.005 by weight was injected into the box immediately after they were fully mixed,which was in a liquid state.When the total height of the mold and the mixture reached 100 mm,the injection was stopped.After 24 h,the mixture was fully solidified and separated from the one half of the granite,forming the upper block sample.Consequently,the prepared upper block sample was used to pour the lower block sample.After 28 d of curing at a room temperature of 20°C,a pair of artificial plaster joints that have the same surface morphology with those of granite joints are prepared.Using the same way,the other three granite joints were reproduced.The four artificial joints were labeled from X1 to X4,as shown in Fig.1a-d.The reason that the artificial joints rather than the natural joints are utilized is that the artificial joints can be repeated,which can help to carry out shear tests for the same joint along different directions.For each granite joint,eight pairs of artificial samples were prepared;four pairs were used for shear tests under CNL conditions and other four pairs were used for shear tests under CNS conditions.The density of the artificial samples is 2.066 g/cm3and the compressive strength is 47.4 MPa.The Poisson’s ratio,the tensile strength,the cohesion and the internal friction angle are 0.23,2.5 MPa,5.3 MPa and 26.7°,respectively.
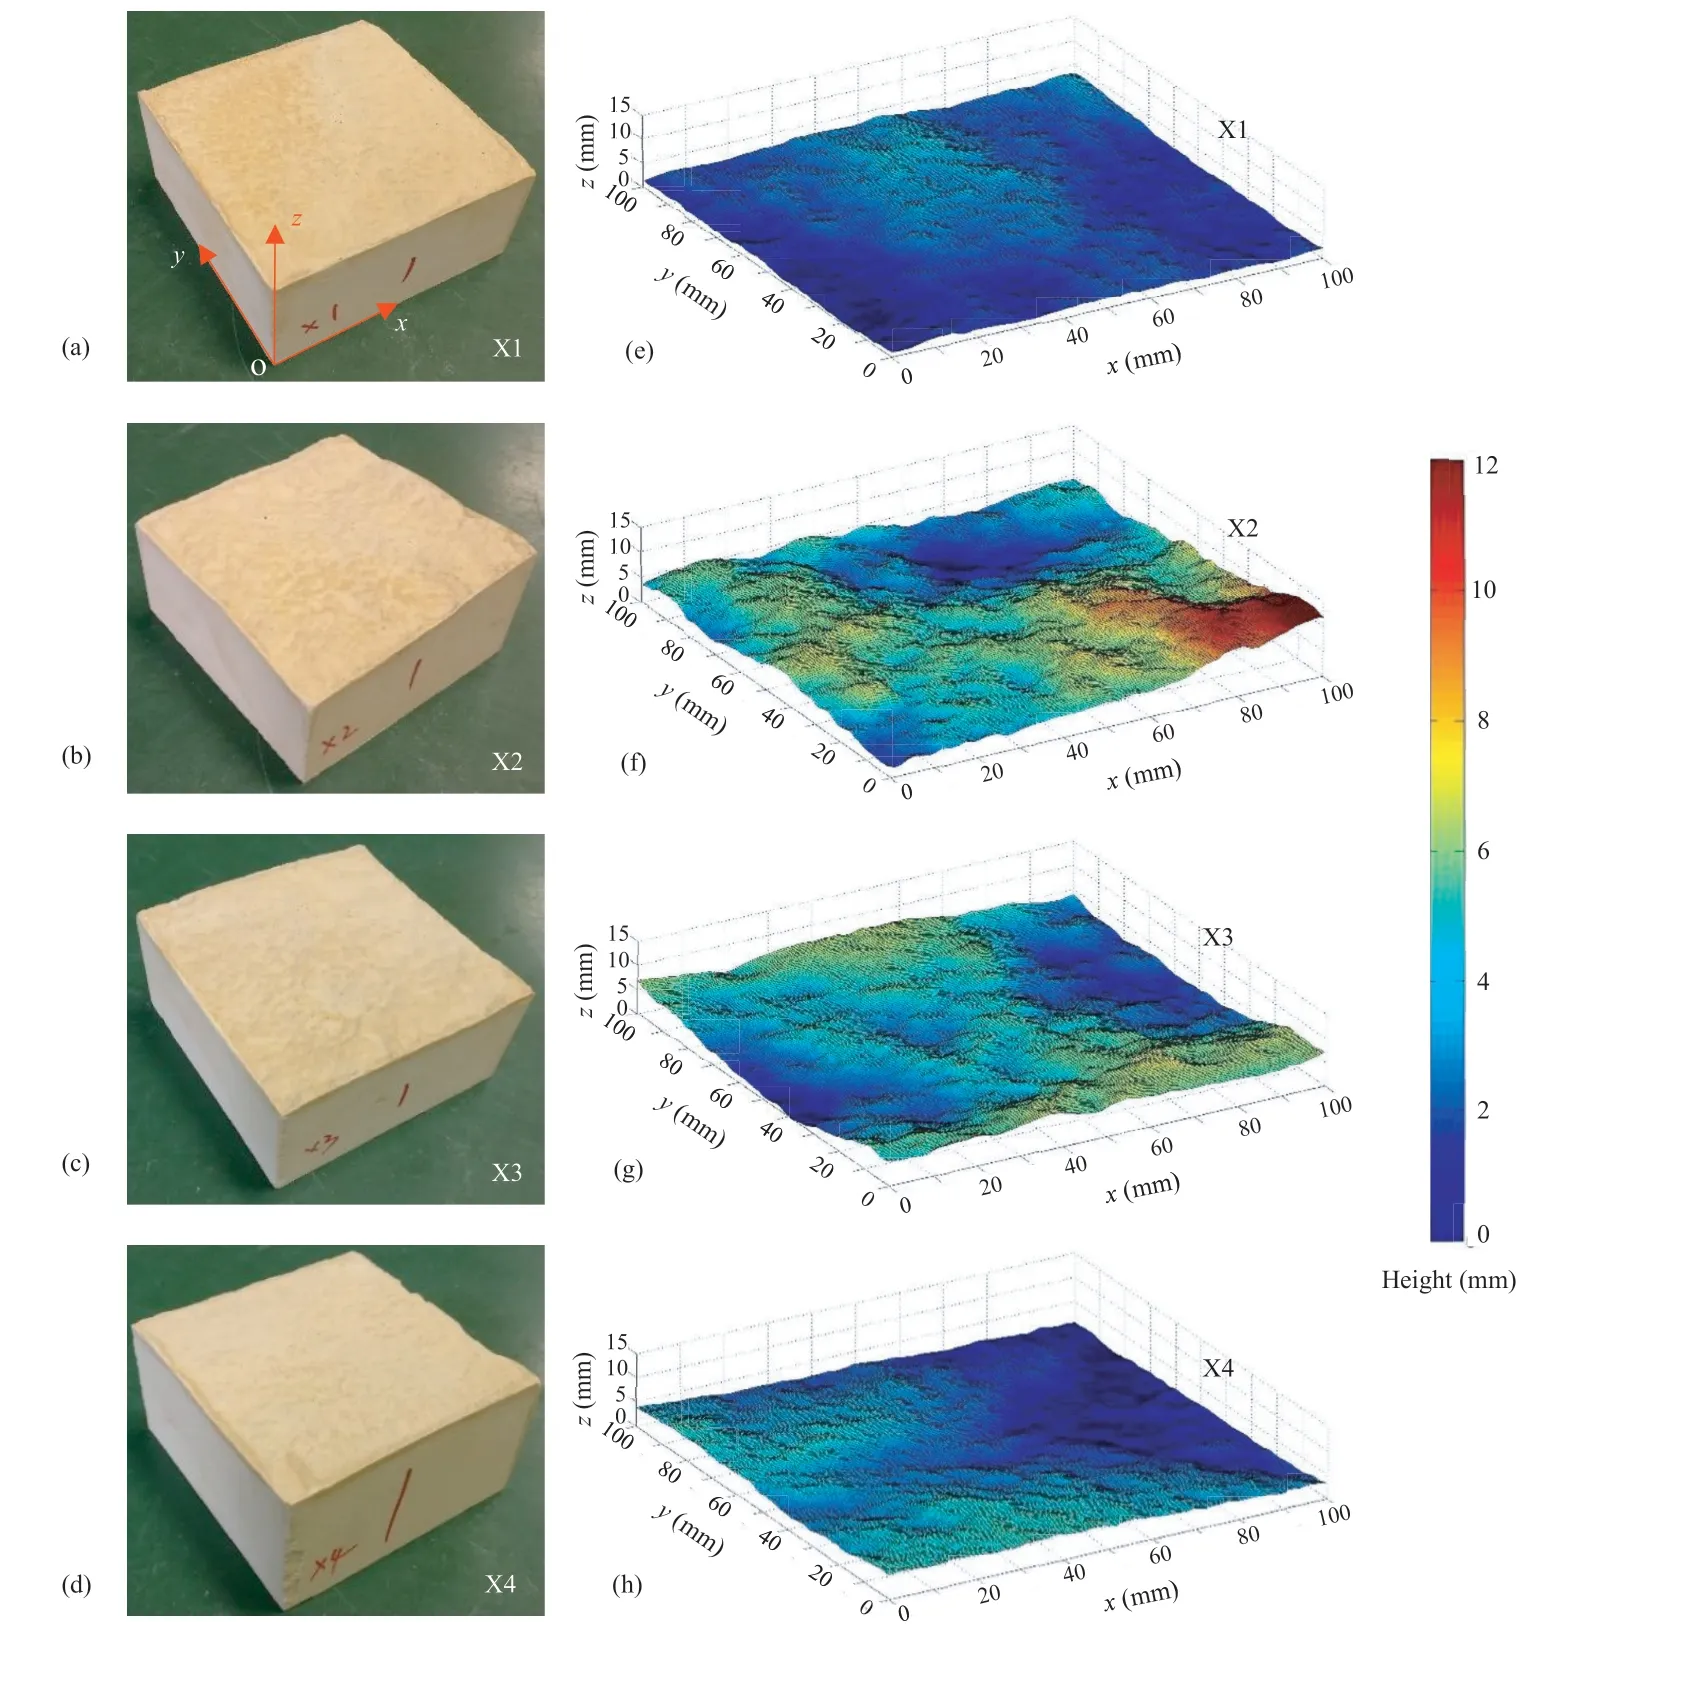
Fig.1.Rough joint surfaces of the four samples:(a)-(d)Experimental samples,and(e)-(h)Scanning graphs.
In the present study,we used the inclination angle(i)of the critical waviness of surface profiles proposed by Li et al.(2018)to describe the surface anisotropy.The inclination angle of the critical unevenness is not used because it plays a less significant role,compared with that of the critical waviness.The details are as follows.First,the profiles are obtained by cutting the joint surface at an interval of 10 mm,resulting in a total of 11 profiles along each shear direction.The shear directions 1,2,3 and 4 denote the shearing along the-y,+x,+y and-x directions,respectively.During shearing,the upper joint is fixed and the lower joint is moved.The inclination angle of the critical waviness of each profile is calculated,and the largest one is selected for describing joint surface roughness.Figs.3-6 exhibit the profiles that have the largest inclination angle of critical waviness along different shear directions.The wavelength is determined as the horizontal distance of the slope surface that has the largest inclination angle(Li et al.,2018).Note that,taking X1-2 as an example,X1-2 means that the sample X1 is sheared along the direction 2(+x direction).The profile of X1-2,which contains the largest inclination angle of the critical waviness for sample X1 as shown in Fig.3b,is the cutting line running from the+y to the-y direction.Thus,for the same sample,e.g.sample X1,the inclination angles of critical waviness along different directions are varied,as shown in Fig.7a.For different plaster joints,the degree of fluctuation of the inclination angle of the critical waviness is different.The inclination angle variance of critical waviness of sample X2 varies most significantly,followed by X3,X4 and X1,which are consistent with the variations in the mean asperity height of the four samples. Here, the inclination angle variance is defined as the difference between the maximum and minimum inclination angles of the critical waviness along different shearing directions.Fig.7b illustrates the relationships between the mean asperity height and the inclination angle variance of the critical waviness.The results show that with the increment of inclination angle variance of the critical waviness,the mean asperity height increases,yet the increasing rate decreases,following an exponential function.Therefore,the inclination angle of the critical waviness can be used to assess surface anisotropy,and its variance can be used to estimate joint surface roughness.
2.2. A servo-controlled shear testing apparatus
The shear tests under CNL and CNS conditions were carried out using a servo-controlled direct shear apparatus,MIS-233-1-55-03,as shown in Fig.8.Two jacks are used to provide a maximum force of 200 kN in both horizontal and vertical directions.Since the surface area of the samples X1-X4 is 0.01 m2,the maximum shear and normal stresses are both 20 MPa.One linear variable differential transformer(LVDT)is installed on the lower shear box to measure the shear displacement.Four LVDTs are put on the four corners of the upper shear box to measure the vertical displacement.The accuracy of LVDT is 0.001 mm,and the range is 0-10 mm.During shearing,the upper box is fixed in shearing(horizontal)direction,yet can move along dilation(vertical)direction.The horizontal jack pushes the lower shear box to move.The maximum normal stress can be up to 20 MPa,which corresponds to a depth of about 800 m.It is easy to apply a CNL condition by applying a constant normal stress using the vertical jack.The CNS condition is applied by updating the changed normal stress in time,which can be calculated by

Fig.2.Histograms of surface asperity height for the rough joints:(a)X1,(b)X2,(c)X3,and(d)X4.

where σnis the applied normal stress,Δσnis the increment of normal stress induced by the increment of normal displacement Δuvduring shearing,and knis the normal stiffness of the surrounding rock masses.
The key issue is that the shear-induced normal stress increase should be in time reacted to the vertical jack to change the applied normal stress.We employed a 16-bit multifunctional A/D,D/A and DIO board,which allows the system to provide 16 input channels and 32 output channels,to execute an accurate feedback.Here,A/D,D/A and DIO denote analog-to-digital,digital-to-analog and digital input/output, respectively. The feedback, as well as the data acquisition and storage,is controlled by a personal computer using the graphical programming language LabVIEW(Jiang et al.,2004).Thus,the CNS condition can be easily applied through a personal computer and/or a customized LabVIEW interface with a high accuracy.
2.3. Testing procedure
First,the prepared two halves of plaster samples are put into the shear box at a well-matched state.The shear box is fixed using the bolts and the five LVDTs are installed at the pre-designed positions.Then,the CNL/CNS condition is selected in the personal computer and/or the customized LabVIEW interface,after which the value of normal stiffness is set as 5 GPa/m(Jiang et al.,2004).The initial normal stress is 4 MPa.Finally,the shear displacement is applied to the lower shear box at a rate of 1 mm/min,and the normal displacement,shear stress and normal stress are recorded in real time until the shear displacement reaches 20 mm,which is 20% of the length of the samples.For each rough surface,eight pairs of samples are used for shear tests along the four directions under both CNL and CNS conditions.After the shear tests are completed,the samples are taken out from the shear box and the images are used to observe the asperity-damaged surfaces.The sheared-off asperities are carefully collected and weighed using an electronic balance that has an accuracy of 0.01 g.
3. Results and analysis
3.1. Variations in normal displacement during shearing

Fig.3.Profiles that have the largest inclination angle of the critical waviness for the models:(a)X1-1,(b)X1-2,(c)X1-3,and(d)X1-4.
Fig.9a-d and e-h exhibits the variations in the normal displacement with the shear displacement varying from 0 to 20 mm for the four samples under CNL and CNS conditions,respectively.The normal displacement decreases to negative values at a limited small shear displacement due to compactions of rocks depending on the rock type and the applied shear/normal stress,and then increases significantly by climbing the asperities.Then the increasing rate decreases by abrading the small rough asperities on the surface of large asperities.With continuous increasing shear displacement,some asperities are sheared off and crushed,and the changes in normal displacement are very different.If the asperity that has the largest inclination angle of the critical waviness is entirely sheared off and crushed into small particles,the normal displacement decreases,as shown in cases X1-1,X2-3,X2-4,X3-2and X4-2under CNLconditions and X2-1,X2-2,X2-3,X2-4,X3-4 and X4-3 under CNS conditions.If the asperity that has the largest inclination angle of the critical waviness is partially sheared,the upper block can still dilate,thus the normal displacement continues to increase.Under CNL conditions,sample X2 varies in a largest extent at a large shear displacement(i.e.20 mm),compared with the other three samples,because the surface of sample X2 is the roughest.The case X2-1 presents the most significant dilation among all the cases,because the inclination angle of the critical waviness of X2-1 is the largest,as shown in Figs.3-6.This illustrates that the joint surface roughness using inclination angle of critical waviness described in Section 2.1 can well interpret the changes in shear-induced dilations.Note that for the case of X2-3,the normal displacement is negative when shear displacement is 20 mm,because some asperities and the edges of the samples are sheared off,indicating a larger normal stress to give rise to a more significant closure of the joints due to the decrease in contact area.Under CNS conditions,the values of normal displacement during shearing are smaller than those under CNL conditions.Thisisreasonablebecausetheshear-induceddilationgives rise to the increase in the normal stress(see Eqs.(1)and(2)),which decreases the normal displacement.Compared with those under CNL conditions,the asperities during shearing under CNS conditions are sheared off/crushed at a smaller shear displacement,or easier to be sheared off/crushed.Taking the case X3-4 as an example,the normal displacement continuously increases as the shear displacement increases up to 20 mm under CNL conditions,as shown in Fig.9c;however,the normal displacement decreases abruptly at a shear displacement of 11.18 mm under CNS conditions,as shown in Fig.9g.With advancing shear displacement,the normal displacement gradually decreases as the sheared-off asperities are damaged into small ones,resulting in closure of the joints.

Fig.4.Profiles that have the largest inclination angle of the critical waviness for the models:(a)X2-1,(b)X2-2,(c)X2-3,and(d)X2-4.
3.2. Variations in shear and normal stresses during shearing
A constant shear velocity of 1 mm/min is applied,and the shear stress varies during shearing.At the start of shearing,the joint climbs along the slope of the asperities in an elastic stage.The asperity is not damaged and the shear stress increases approximately in a linear fashion with shear displacement.Under CNL conditions,this elastic stage remains until the peak shear stress is reached.After the peak shear stress,the asperities that constrain the movement of the joints are damaged and it needs a smaller shear stress to increase the shear displacement in a constant velocity.Thus,the shear stress continuously decreases until the tests are completed.Note that in the residual stage,taking the case X2-4 in Fig.10 as an example,the shear stress may increase due to the presence of an asperity that has the secondary largest slope angle.When this asperity is damaged,the shear is in the second residual stage and the shear stress decreases.The shear stress displays different variations under CNS conditions after elastic stage,compared with those under CNL conditions.For some cases(i.e.X1-1 and X2-3),the peak shear stress still exists and in the residual stage,the shear stress gradually decreases,although the decreasing rate under CNS conditions is smaller at first and then larger than that under CNL conditions.For some cases(i.e.X2-1,X2-2 and X2-4),there are two peak shear stresses.The peak shear stress corresponds to the damage of the asperity that has the largest inclination angle.However,the CNS condition yields a much larger normal stress than the CNL condition,which results in damaged asperity being constrained by the normal stress.The damaged asperity cannot move with increment of shear displacement.As a result,the damaged asperity is crushed into smaller ones and the shear stress continues to increase before the second peak shear stress,yet at a smaller increasing rate,compared with the increasing rate of shear stress before the first peak shear stress.After exceeding the second peak shear stress,the asperity or part of the asperity is sheared off and/or sheared into small enough particles,and the shear stress decreases.For the case X2-4,the residual shear stress increases repeatedly and then decreases,which indicates that there are multiple asperities that are sheared off and crushed one by one.After these asperities are all sheared off and/or sheared into small enough particles,the shear stress falls in an approximately linear decreasing trend.For some cases(i.e.X1-3 and X4-1),the shear stress increases to the peak shear stress,and then quickly falls down,after which the shear stress increases at a very gentle rate.After the peak shear stress,the dominant asperity is damaged and crushed at a small shear displacement range,resulting in a quick decrease in shear stress.Finally,the joint moves along the surface that contains several small asperities,showing a gradual increase in the shear stress.

Fig.5.Profiles that have the largest inclination angle of the critical waviness for the models:(a)X3-1,(b)X3-2,(c)X3-3,and(d)X3-4.
Fig.11 presents the peak shear stress having a power law relationship with the inclination angle of the critical waviness of the joint surfaces for shear tests under CNL conditions.For a larger inclination angle of the critical waviness,a larger shear stress is needed to shear the sample,resulting in a larger peak shear stress value.The increasing rate of peak shear stress decreases as the inclination angle of the critical waviness increases.Since the shear stresses for the tests under CNS conditions have several peaks or do not have clear peak values,the relationship between peak shear stress and inclination angle of the critical waviness is not presented.
Trint felt good. Somewhere along the road tomorrow he d call home and talk to his brothers and kid sister. He d tell his mom about giving the toy to the kid. She d like that.
Under CNL conditions,the normal stress is a constant that has a value of 4 MPa,whereas under CNS conditions,the normal stress increases or decreases depending on the increase or decrease in the normal displacement.As shown in Eqs.(1)and(2),the normal stress has a linear relationship with the normal displacement.The variations in the normal stress are displayed in Fig.12,and show the same trends with those presented in Fig.9e-h.
3.3. Effect of inclination angle of the critical waviness on normal displacement
The roughness of the joints is represented by the inclination angle of the critical waviness,which plays a dominant role in the dilation/normal displacement.Fig.13 depicts the variations in the normal displacement versus the inclination angle of the critical waviness at shear displacements of 2 mm,5 mm and 10 mm under CNL and CNS conditions.The results show that with increment of the inclination angle of the critical waviness,the normal displacement increases at a decreasing rate,following power law functions with positive exponents under CNL conditions.This is reasonable because the larger the inclination angle of the critical waviness,the rougher the surface of the joints and thereby the larger the normal displacement during shearing.As the shear displacement increases,the normal displacement increases too,yet the increasing rate decreases,which is consistent with those presented in Fig.9a-d.The coefficient of determination R2is larger at a smaller shear displacement,because the inclination angle of critical waviness is more significantly changed at a larger shear displacement.The normal displacement of joints during shearing and the coefficient of determination R2under CNS conditions are both smaller than those under CNL conditions.This is due to the fact that,under CNS conditions,the normal stress is larger and the asperity is more robustly damaged.As a result,the inclination angle of the critical waviness decreases in a larger degree and the coefficient of determination R2is smaller.

Fig.6.Profiles that have the largest inclination angle of the critical waviness for the models:(a)X4-1,(b)X4-2,(c)X4-3,and(d)X4-4.
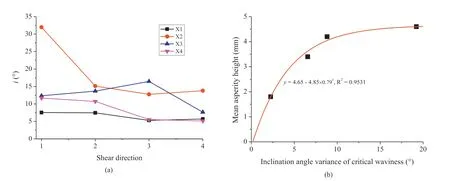
Fig.7.(a)Variations in the inclination angle of the critical waviness of the four rough samples in different shearing directions.During shearing,the upper joint is fixed and the lower joint is sheared.(b)Relationships between the mean asperity height and the inclination angle variance of the critical waviness.
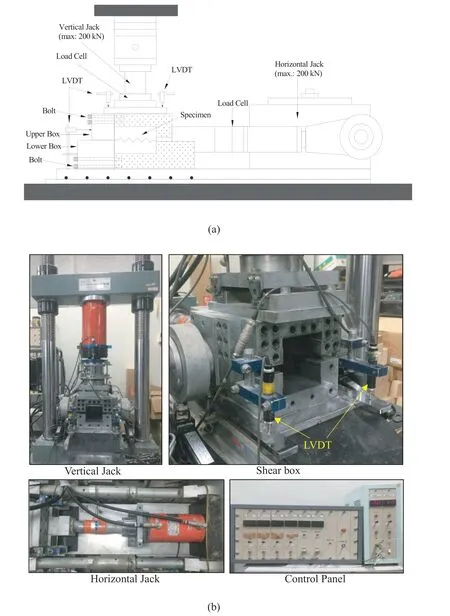
Fig.8.Servo-controlled shear testing apparatus:(a)Schematic view,and(b)Photographs of the units.
3.4. Failure patterns of joint surfaces after shear
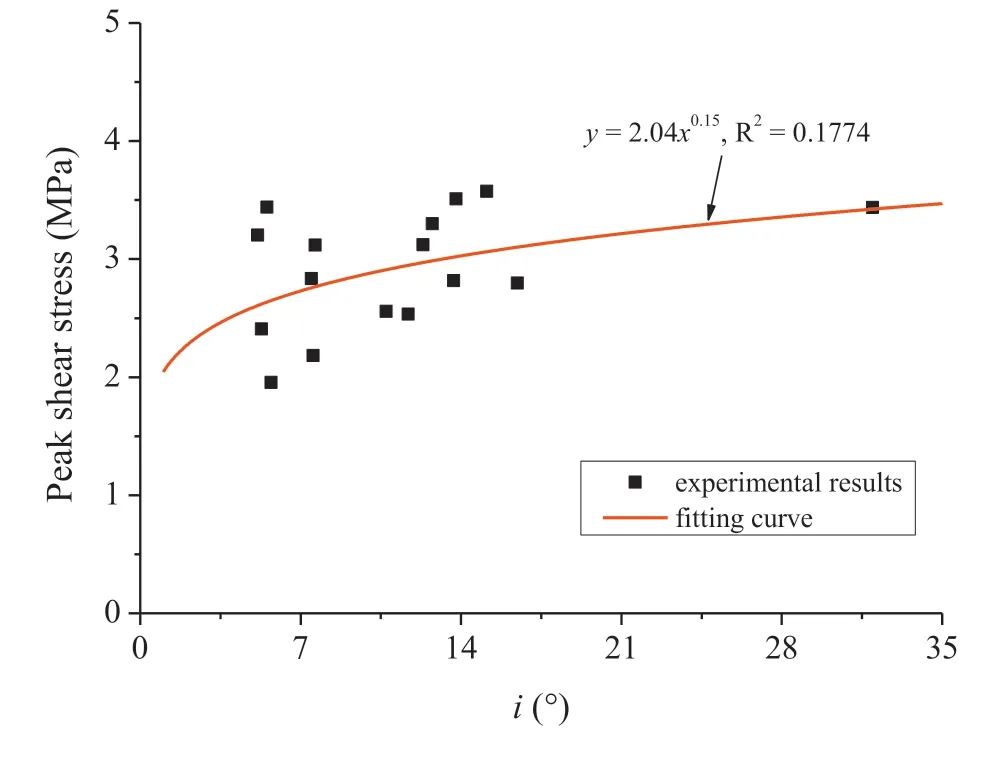
Fig.11.Evolution of peak shear stress with inclination angle of the critical waviness of joint surfaces under CNL conditions.
The shear-induced asperity degradation is a key parameter in controlling the mechanical,hydraulic and solute transport properties of joints(Misra,2002;Belem et al.,2007;Vogler et al.,2016;Zhao et al.,2018).After shearing,two examples of the damaged joint surfaces under CNL conditions are shown in Fig.14a and b.For each pair,the right half is the upper one fixed during shearing and the left half is the lower one being sheared along the arrow direction.The white color represents the marks of asperities that are abraded/crushed,which occur in the up slope direction.The damaged asperities are either uniformly distributed with many small ones (i.e. X1-3) or clustered in several large ones(i.e.X2-4).The edges perpendicular to the shear direction are sheared off due to stress concentration. Fig.14c and d displays two examples of the damaged joint surfaces after shear tests under CNS conditions,in which the asperities are more significantly damaged,because the constraint from the increasing normal stress under CNS conditions is larger,compared with that under CNL conditions.To quantitatively characterize the damaged asperities,the sheared-off asperities are weighed. On one hand, the sheared-off asperities existing within the void spaces of joints during shearing prop the joints to open and provide flow paths for fluid/solute to travel, which is similar to the roles of proppant in hydraulic fractured wells(Warpinski et al.,2009;Carpenter,2016).On the other hand,the damaged asperities infill the void spaces,and decrease the conductivity of joints.This also increases the surface area of particles and retards the solute transport (Zhao et al., 2018). Fig. 15 shows the relationships between the sheared-off asperity mass and the inclination angle of critical waviness under both CNL and CNS conditions.With increment of inclination angle of the critical waviness,the sheared-off asperity mass increases significantly and then gently,following power law functions.Although the exponents are very close, the linear coefficient and R2are smaller under CNS conditions than those under CNL conditions.The results indicate that the inclination angle of the critical waviness can be used to predict the sheared-off asperity mass,and has the potential to be incorporated into analytical solutions to represent asperity damage for calculating fluid flow and solute transport.

Fig.12.Relationships between normal stress and shear displacement for the four samples under CNS conditions.
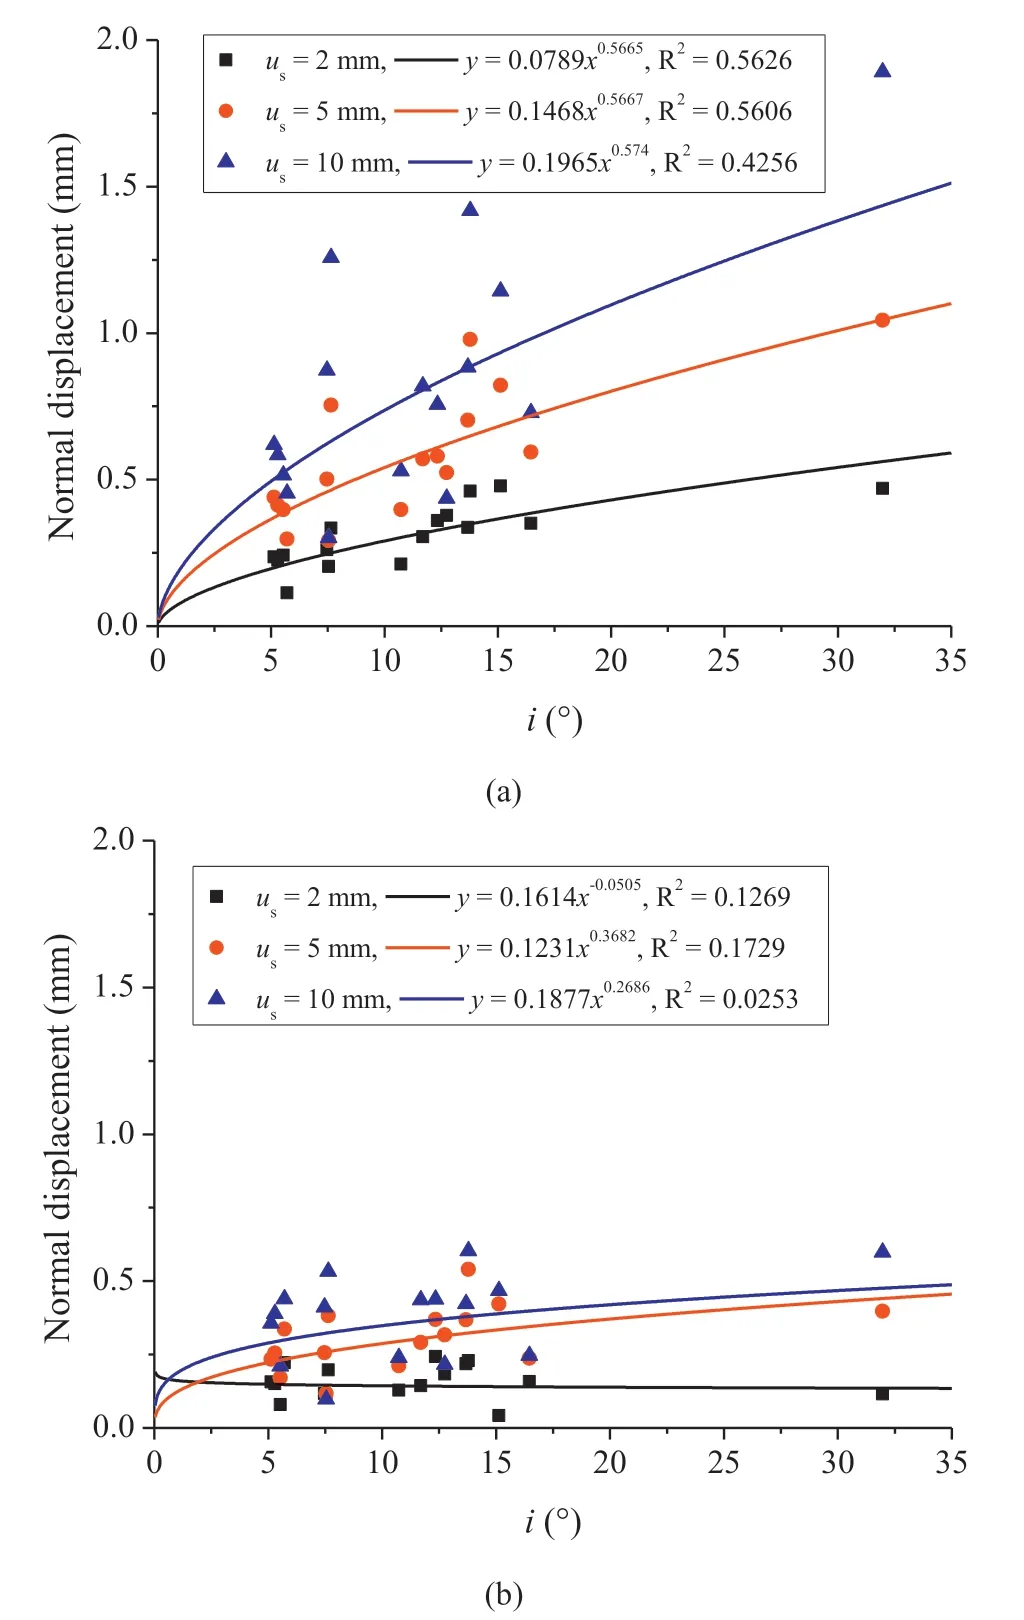
Fig.13.Normal displacement versus inclination angle of the critical waviness of joint surfaces under(a)CNL and(b)CNS conditions.
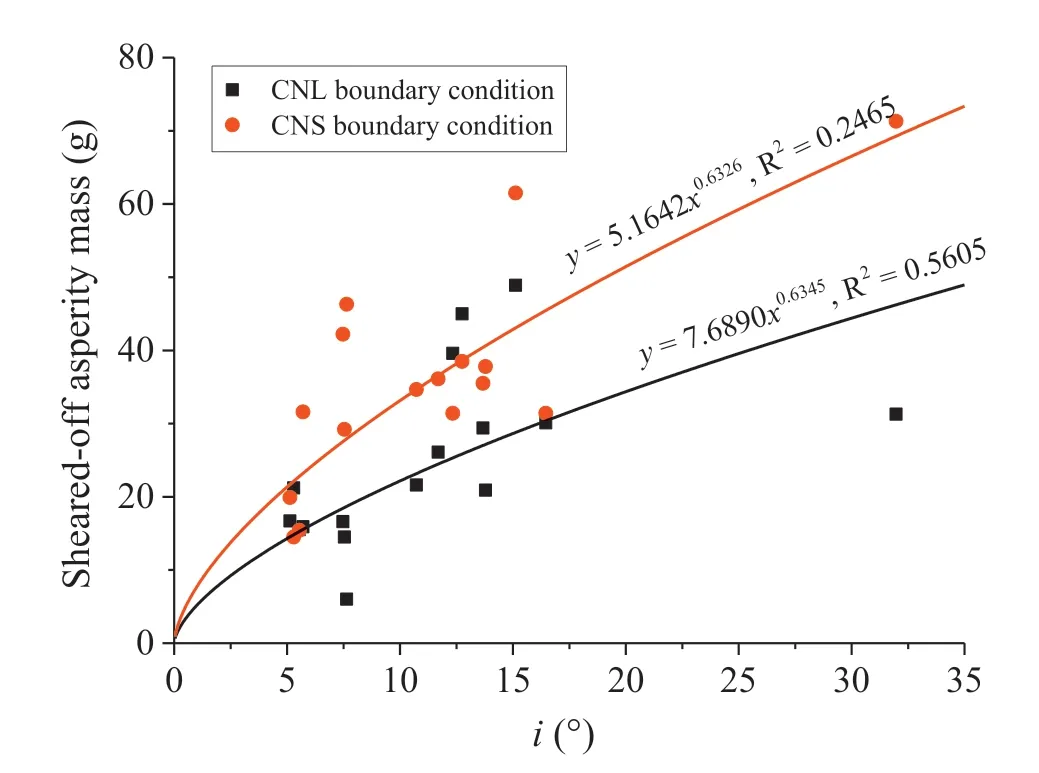
Fig.15.Relationships between the sheared-off asperity mass and inclination angle of the critical waviness under CNL and CNS conditions.
4. Discussions
The present study used the mixture of plaster, water and retardant to mimic rocks.Although the sample manufactured using the mixture has the same surface morphology with the real rocks,the micro-properties such as the size distribution of grains that can influence the asperity damage are still different.The reasons that we used the mixture are that the joints can be reproduced repeatedly,while the natural rocks cannot be split to the joints that have the same surface morphology.Thus,for the same joint,it is capable of carrying out shear tests along different directions to study anisotropic mechanical behaviors.Besides,the mixture can be molded into any shape,i.e.the perfect saw-toothed synthetic rock joints,to verify the results of numerical and theoretical models(Patton,1966;Li et al.,2018).However,the uniaxial compressive strength of the plaster sample is 47.4 MPa,which is much less than that of some types of rocks(e.g.150 MPa for granite).In future studies,new plaster materials that have similar strength with real rocks should be used.

Fig.14.Damaged joint surfaces after shear tests under CNL and CNS conditions.
The largest inclination angle of the critical waviness is utilized to describe joint surface roughness and surface anisotropy,and it can be well correlated to the evolutions of normal displacement,asperity degradation and sheared-off asperity mass.However,the surface roughness of joints, as well as the resulting physicomechanical behaviors such as normal displacement,shear stress,and normal stress,is overestimated.The corrections that decrease the overestimation are needed in future works.During shearing,the asperity is abraded and/or crushed.The largest inclination angle of the critical waviness decreases,and the predicted physicomechanical behaviors such as normal displacement shown in Fig.13a deviate more from the tested results for a larger shear displacement.This is reflected by a decreasing R2with increasing shear displacement.When the shear displacement is large(i.e.larger than 10 mm),the asperity is crushed for some cases and the normal displacement cannot be correlated with the largest inclination angle of the critical waviness.Therefore,the mobilized largest inclination angle of the critical waviness during shearing is more suitable and should be utilized in future works.
The current analytical models proposed by Indraratna et al.(2015)and Li et al.(2018)can predict the shear behavior of rough joints during shearing under CNS conditions. The normal displacement always increases as the shear displacement increases,although the asperity damage and/or degradation are included.However,the experimental results(i.e.the sample X2 under CNS conditions in Fig.9f)show that the normal displacement may decrease if the asperity on the rough surfaces of joints is crushed.These experimental results can provide calibrations for developing new analytical models that can predict the decrease in normal displacement in the residual stage of shear tests.
5. Conclusions
The present study carried out shear tests on rough-walled plaster joints using a servo-controlled shear testing apparatus under both CNL and CNS conditions.The surface roughness and anisotropy of joints were characterized using the inclination angle of the critical waviness. The physico-mechanical behaviors including normal displacement,shear stress and normal stress during shearing,as well as the relationships between the normal displacement and the inclination angle of the critical waviness,were investigated.The damaged surfaces of joints after shear tests were captured under CNL and CNS conditions.The variations in sheared-off asperity mass versus the inclination angle of the critical waviness were quantitatively analyzed.
The results show that the inclination angle of critical waviness can be used to well describe the joint surface roughness and surface anisotropy.Under CNL conditions,the normal displacement experiences three stages with increment of shear displacement.In the first stage,the normal displacement decreases to negative values due to the shear/normal stress-induced compactions.In the second stage,the normal displacement increases significantly because of shear-induced dilation. In the third stage, the asperities are abraded/crushed and the increasing rate of normal displacement decreases. Under CNS conditions, the variations in normal displacement in the first two stages are similar with those under CNL conditions,yet have smaller values.The shear stress under CNL conditions has obvious peaks,whereas under CNS conditions,it has no peaks or has two peaks.This is because the normal stress under CNL conditions is a constant of 4 MPa and increases(or decreases for several cases)under CNS conditions.The increased normal stress under CNS conditions constrains the dilation of joints and affects the variations in shear stress.The larger the inclination angle of the critical waviness,the rougher the joint surface and thereby the larger the normal displacement.The joint surface after shear tests under CNS conditions is more significantly abraded/crushed than that under CNL conditions.With increasing inclination angle of the critical waviness,the sheared-off asperity mass increases,following power law functions.
The future works will focus on the usage of the mobilized inclination angle of critical waviness to assess the surface roughness change of joints during shearing.
Declaration of Competing Interest
We wish to confirm that there are no known conflicts of interest associated with this publication and there has been no significant financial support for this work that could have influenced its outcome.
Acknowledgments
This study has been partially funded by National Natural Science Foundation of China(Grant Nos.51979272 and 51709260),and State Key Laboratory for Geomechanics and Deep Underground Engineering,China University of Mining and Technology,China(Grant No. SKLGDUEK1906). These supports are gratefully acknowledged.
 Journal of Rock Mechanics and Geotechnical Engineering2020年2期
- Journal of Rock Mechanics and Geotechnical Engineering的其它文章
- Sugarcane press mud modification of expansive soil stabilized at optimum lime content:Strength,mineralogy and microstructural investigation
- Dynamic compression characteristics of layered rock mass of significant strength changes in adjacent layers
- Reliability analysis of earth dams using direct coupling
- Centrifuge model test and numerical interpretation of seismic responses of a partially submerged deposit slope
- Effects of CO2-water interaction with coal on mineral content and pore characteristics
- Determination of full-scale pore size distribution of Gaomiaozi bentonite and its permeability prediction