
Evaluation of empirical estimation of uniaxial compressive strength of rock using measurements from index and physical tests
2020-04-17 13:48AdeyemiEmmanAladejare
Adeyemi Emman Aladejare
Oulu Mining School,University of Oulu,Pentti Kaiteran Katu 1,Oulu,90014,Finland
Keywords:Uniaxial compressive strength(UCS)Empirical equation Index test Physical test Uniaxial compression test Statistical analysis
A B S T R A C T The uniaxial compressive strength(UCS)of rock is an important parameter required for design and analysis of rock structures,and rock mass classification.Uniaxial compression test is the direct method to obtain the UCS values.However,these tests are generally tedious,time-consuming,expensive,and sometimes impossible to perform due to difficult rock conditions.Therefore,several empirical equations have been developed to estimate the UCS from results of index and physical tests of rock.Nevertheless,numerous empirical models available in the literature often make it difficult for mining engineers to decide which empirical equation provides the most reliable estimate of UCS.This study evaluates estimation of UCS of rocks from several empirical equations.The study uses data of point load strength(Is(50)),Schmidt rebound hardness(SRH),block punch index(BPI),effective porosity(n)and density(ρ)as inputs to empirically estimate the UCS.The estimated UCS values from empirical equations are compared with experimentally obtained or measured UCS values,using statistical analyses.It shows that the reliability of UCS estimated from empirical equations depends on the quality of data used to develop the equations,type of input data used in the equations,and the quality of input data from index or physical tests.The results show that the point load strength(Is(50))is the most reliable index for estimating UCS among the five types of tests evaluated.Because of type-specific nature of rock,restricting the use of empirical equations to the similar rock types for which they are developed is one of the measures to ensure satisfactory prediction performance of empirical equations.
1. Introduction
The uniaxial compressive strength(UCS)of rock is one of the most frequently used rock properties in civil and mining engineering practices.Bieniawski(1976)reported that mining engineers request for UCS more often than any other rock material properties.The UCS is required as an input in most rock and mining engineering designs. The UCS is also needed in prediction of deformation modulus(Sonmez et al.,2006)and major rock mass classifications,like the rock mass rating(RMR)system(Bieniawski,1974; Aladejare and Wang, 2019a), rock mass index (RMi)(Palmstrøm,1996),and among others.In addition,the Hoek-Brown failure criterion (Hoek et al., 2002) for predicting the strength parameters of rock masses also requires the UCS of intact rock as one of the inputs(Aladejare and Wang,2019b).From surface to underground mining practice,UCS is a critical rock property when considering a variety of issues encountered during drilling,blasting,and support construction of open pit slope or underground excavations and tunnels(Adebayo and Aladejare,2013).As UCS is important for most mining engineering designs,inadequate information about UCS may lead to unexpected failure of mining engineering structures.Therefore,determination of UCS is not only important but also strategic to the overall success of mining engineering designs and practices.
These advantages have led to an increasing popularity of the use of various indirect tests to estimate UCS.The possibility of little or no sample preparation by some of the tests used to indirectly estimate UCS through empirical equations makes them more attractive(Gunsallus and Kulhawy,1984;Ghosh and Srivastava,1991;Singh and Singh,1993;Ulusay et al.,1994;Chau and Wong,1996;Tugrul and Zarif,1999; Chatterjee and Mukhopadhyay, 2002;Gokceoglu and Zorlu,2004;Tsiambaos and Sabatakakis,2004;Aydin and Basu,2005;Kahraman and Gunaydin,2009;Basu and Kamran,2010;Aliyu et al.,2019).Results of some index and physical tests have been recommended for indirect estimation of UCS.Numerous studies of empirical equations developed for indirect estimation of UCS in the literature generally include those using point load strength(Is(50)),Schmidt rebound hardness(SRH),block punch index(BPI),effective porosity(n),and density(ρ)as inputs.
The indirect estimation of UCS helps mining engineers to overcome the difficulty in using the direct laboratory tests for estimation of UCS.However,using empirical equations may lead to underestimation or overestimation of site-specific UCS.Apart from type-specific nature of rock,rock properties are also site-specific which may vary within the same deposit or differ from deposit to deposit(Wang and Aladejare,2015,2016;Aladejare and Wang,2017, 2018; Aladejare and Akeju, 2019). Phoon and Kulhawy(1999)suggested that some degree of uncertainty will be introduced when empirical equations are used to estimate geotechnical properties,because the empirical equations are basically obtained by data fitting.There may be disparity between a directly measured and an indirectly estimated UCS,which can result from imperfect representation of reality.This may be caused by simplifications and idealisations that have been used or due to lack of knowledge during the development of such empirical equations(Ditlevsen,1981).It can also be due to the site-specific nature of rock properties and empirical equations. It is noted that the empirical equations developed using some site-specific data may be unsuitable when they are used to estimate UCS in another location or deposit,especially in the area with different geological histories.In addition to simple regression equations available in the literature,some researchers have developed multiple regression equations using soft computing techniques,such as artificial neural network(ANN),adaptive neuro-fuzzy inference system(ANFIS),particle swarm optimisation(PSO),and genetic programming(GP)(Yılmaz and Yuksek,2008;Khandelwal and Singh,2009;Singh et al.,2012a,b;Mishra and Basu,2013;Armaghani et al.,2014,2015,2016,2018;Momeni et al.,2015a,b).Tables 1 and 2 present some of the simple and multiple regression equations available in the literature, respectively. Goodman (1995) explained that when dealing with natural rocks,the only thing known with certainty is that this material will never be known with certainty.Due to the difference in rock nature which varies from place to place,the reliability of regression models should be studied. Therefore,evaluating how index and physical properties perform in empirical estimation of UCS is important, since they are available and frequently used in estimation of UCS.
When mining engineers and practitioners request the use of empirical equations,only data of a specific type of rock test may be available.Therefore,use of simple regression is important in mining engineering. This paper investigates the performance of empirical equations when estimating UCS of rock by measurements of index and physical tests.The approach proposed in this study is to investigate those empirical equations which use results of specific test type(i.e.simple regression).Firstly,this study reviews the index and physical tests as well as empirical equations commonly used in indirect estimation of UCS.Then,the estimations of UCS based on the results of index and physical tests on three rock types,e.g.granite,schist,and sandstone from India,are carried out.Finally,statistical analyses are conducted to compare the performances of empirical equations and assess the suitability of index and physical tests to produce satisfactory estimations of UCS.
2. Existing empirical equations for estimating uniaxial compressive strength
Results of different index and physical tests have been tried to estimate the UCS,as the index and physical tests are generally less expensive and simpler to perform than the uniaxial compression tests(Chatterjee and Mukhopadhyay,2002;Gokceoglu and Zorlu,2004;Aydin and Basu,2005;Kahraman and Gunaydin,2009).Index and physical tests require little or no sample preparation.Therefore,developing empirical equations to correlate the results of index or physical tests with UCS is promising.Empirical equations are developed for estimating UCS when UCS is not available and there is a possibility of performing index or physical tests.In the literature,there are various empirical equations for estimating UCS using the results of index and physical tests such as Is(50),SRH,BPI,n and ρ,as inputs.Thus,this study uses test data of Is(50),SRH,BPI,n and ρ to estimate UCS.This is to ensure that the input data can be easily obtained in laboratory without requiring elaborate machining and sample preparation.The major advantage of using empirical equation to estimate UCS is that it makes it easy to obtain UCS values when laboratory test is difficult or infeasible.Therefore,it is logical that the properties used to estimate UCS should be those that can be obtained with relative ease.
Table 3 presents some empirical equations for estimating UCS based on input data and rock types.A total of 27 empirical equations are listed in Table 1 and named as Models 1-27,respectively.Models 1-12,Models 13-20,Model 21,Models 22-24,and Models 25-27 use Is(50),SRH,BPI,n and ρ as inputs,respectively.This study classifies the empirical equations based on rock types,e.g.igneous,metamorphic or sedimentary rocks.Since the geological processes through which rocks are formed are different,it is important that empirical equations be used for the rock types which are like the one used in developing them.Therefore,Table 3 only includes those empirical equations obtained from a specific rock type using a single type of input data.Empirical equations developed from more than one rock type and those with multiple types of input data have been excluded.
The point load strength index(Is(50))obtained from point load strength test is used as an index for strength classification of rock materials.The test involves loading rock samples in forms of core(diametral and axial tests),cut block(block test),or irregular lump(irregular lump test) between a pair of spherically truncated,conical platens.As the test requires little or no sample preparation,it is a fast test.The test can be easily performed with portable equipment or using a laboratory testing machine and can also be conducted in field.Is(50)is widely used in rock mechanics ranging from being used to indirectly estimate UCS (Gunsallus andKulhawy,1984;Singh and Singh,1993;Ulusay et al.,1994;Smith,1997; Tsiambaos and Sabatakakis, 2004; Kahraman and Gunaydin,2009;Basu and Kamran,2010;Aliyu et al.,2019)to being an input when UCS is not available in rock mass classification system,such as RMR(Bieniawski,1989).Researchers have tried to compile a comprehensive list of empirical equations between Is(50)and UCS available in the literature (Basu, 2008; Wang and Aladejare, 2015). The compilations show that there are many empirical equations for predicting UCS from Is(50),which range from those developed by using a specific rock type data to those with several rock types data.

Table 1 Simple regression equations for estimating UCS.
The SRH is obtained from SRH test,which is a semi-nondestructive test used to provide an index for estimating UCS.The SRH test makes use of a Schmidt hammer consisting of a springloaded mass inside a piston that is released when the hammer is pressed orthogonally onto a rock surface.The rebound height of the piston gives an indication of the strength of the tested material(Basu and Aydin,2004;Mishra and Basu,2013).Many researchers have worked on the relationship between SRH and UCS, and proposed several empirical equations between these two properties(Tugrul and Zarif,1999;Yılmaz and Sendır,2002;Aydin and Basu,2005;Gupta,2009).
The BPI obtained from block punch strength index test is also intended as an index for strength classification of rock materials.Rock samples of thin cylindrical discs prepared from cores or blocks are placed into an apparatus designed to fit the point load device.Then,the rock samples are broken by applied load through a rectangular rigid punching block(Ulusay et al.,2001).Unlike point load strength test and SRH test,block punch test has been less explored.Another setback is that most of the studies that developed empirical equations between BPI and UCS used several rock types(Ulusay and Gokceoglu,1997;Gokceoglu and Aksoy,2000;Sulukcu and Ulusay,2001;Ulusay et al.,2001),making most of the equations unsuitable for use when there is a strict compliance with type-specific nature of rock.However,the efficiency of using BPI to estimate UCS has been found to be acceptable(Ulusay and Gokceoglu,1997;Sulukcu and Ulusay,2001;Ulusay et al.,2001;Mishra and Basu,2012).
A neighbour passing by called out to him- - Hi! I say! why are you beating the pedlar s donkey like that? The pedlar should keep him from eating my cabbages, said Nur Mahomed; if he comes this evening here again I ll cut off his tail for him! Whereupon he went off indoors, whistling cheerfully

Table 2 Multiple regression equations for estimating UCS.
Effective porosity(n)and density(ρ)are physical properties obtained through physical tests on rock samples.Effective porosity and density can be determined in laboratory by a couple of techniques including saturation and caliper techniques,saturation and buoyancy techniques,mercury displacement and grain specific gravity techniques,mercury displacement and Boyle’s law techniques(Franklin,1979).Mishra and Basu(2013)reported that effective porosity and density are widely used in engineering geological investigations for characterising various physicomechanical parameters of rock materials.Empirical equations between UCS and effective porosity and those between UCS and density have been also reported(Al-Harthi et al.,1999;Palchik,1999;Tugrul and Zarif,1999;Chatterjee and Mukhopadhyay,2002).
3. Rock data and performance indicators
To evaluate empirical estimation of UCS of rock,index and physical test measurements of three types of rocks are used.Also,three different performance indicators are employed to compare the estimated UCS from different empirical equations with measured UCS.Details of the database of rock data and performance indicators are discussed in subsequent subsections.
3.1. Rock data
To investigate the effectiveness of empirical equations for estimation of UCS,three rock types,i.e.granite,schist and sandstone belonging to igneous, metamorphic and sedimentary rocks,respectively,were considered in the evaluation.The rock samples were collected from Malanjkhand Copper Project,Malanjkhand(in the state of Madhya Pradesh,Central India),UCIL mine at Jaduguda(in the state of Jharkhand,Eastern India),and Singareni Collieries Company Limited,Kothagudem,Khammam(in the state of Andhra Pradesh,South India),respectively(Mishra and Basu,2013).Table 4 presents the results of index,physical and uniaxial compression tests carried out on the rock samples by Mishra and Basu(2013).The tests were used to determine Is(50),SRH,BPI,n,ρ and UCS.Note that only Is(50),SRH,BPI,n,and ρ will be used in empirical equations to estimate UCS.The measured UCS test values in Table 4 are included for comparison with estimated UCS from empirical equations.As can be seen from Table 4,the results are grouped as granite,schist and sandstone representing igneous,metamorphicand sedimentary rocks,respectively,and will be used in empirical equations developed for similar rock types.
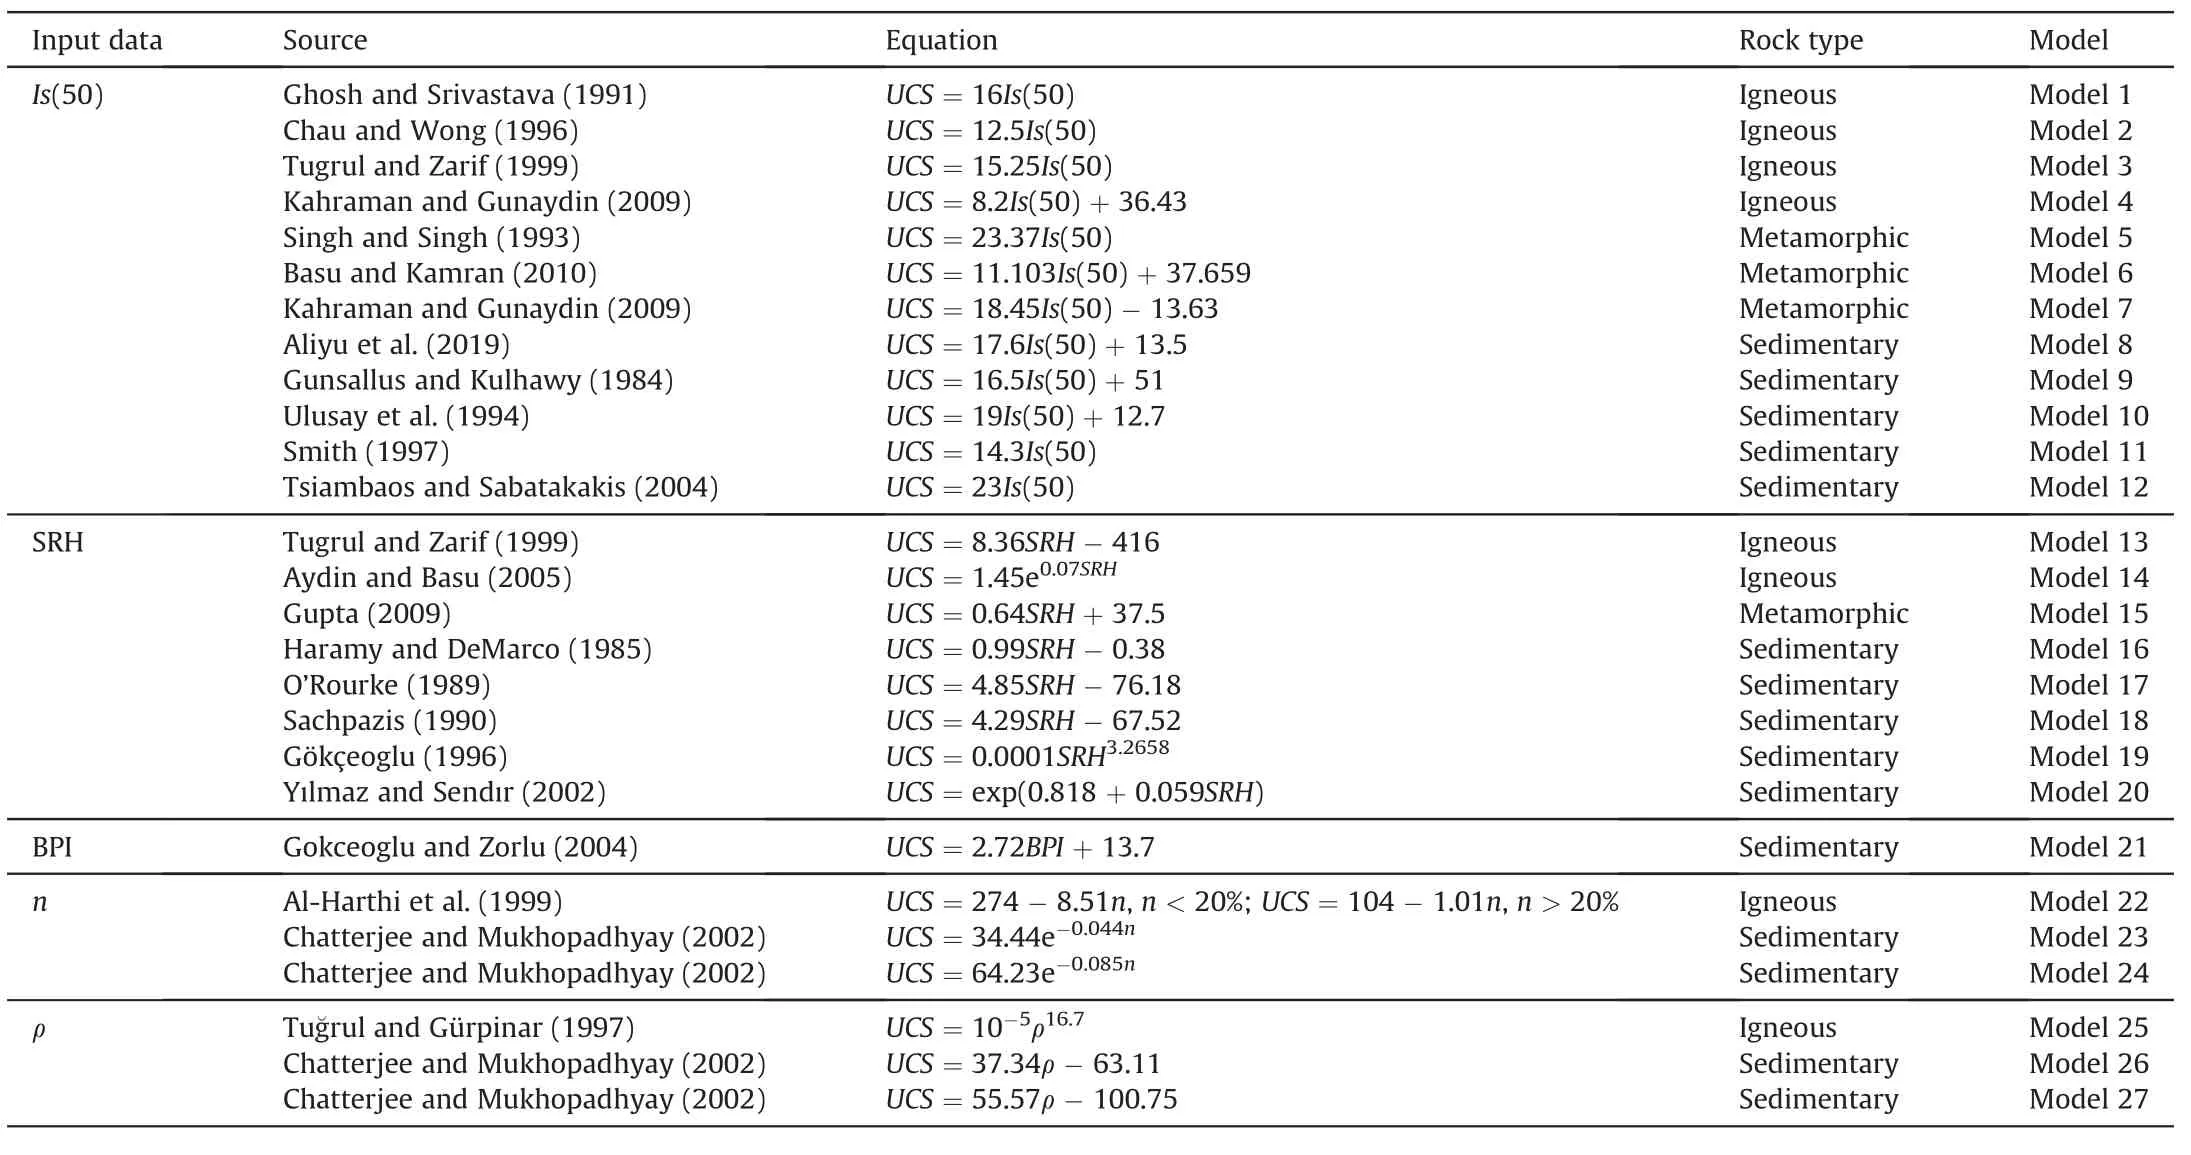
Table 3 Classification of empirical equations for estimating UCS based on input data and rock type.
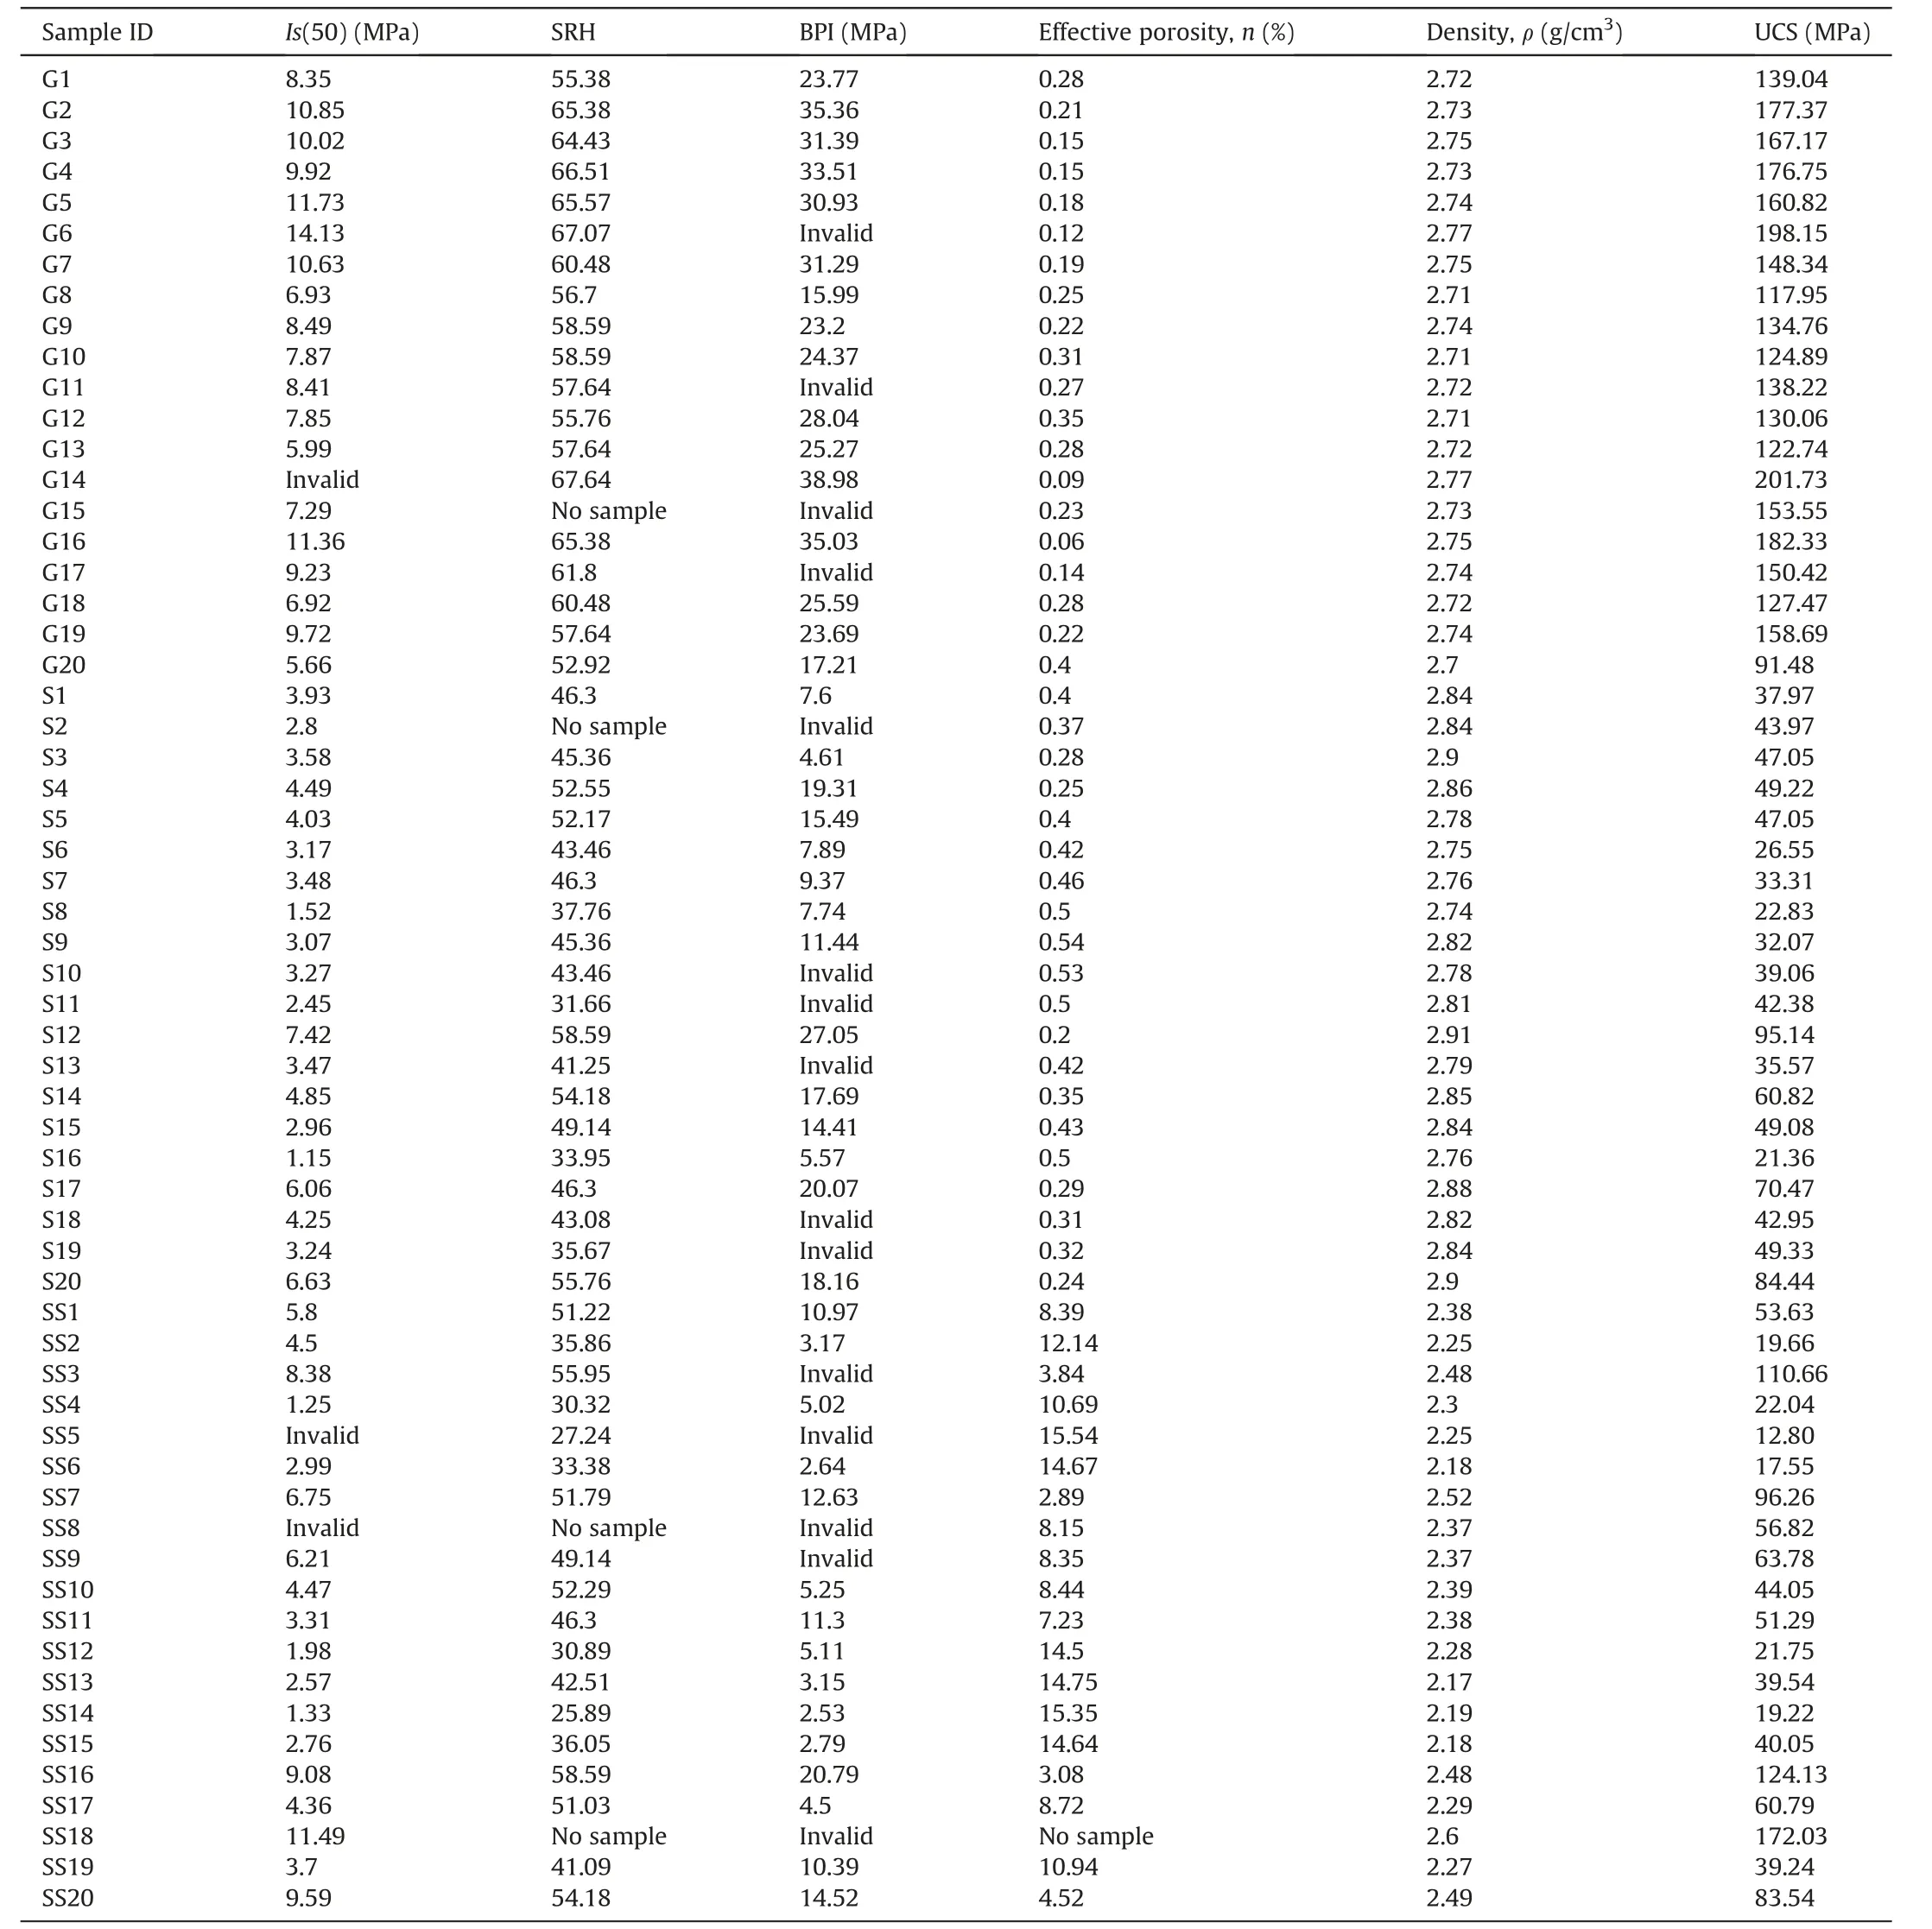
Table 4 Laboratory test results of different rocks collected in India(after Mishra and Basu,2013).
3.2. Performance indicators for the evaluation of empirical equations
The technique employed to evaluate estimation of UCS from index and physical tests results using empirical models is to compare the estimated UCS values with the measured (i.e.experimental)UCS values reported for the same rock type.The trend,statistics and probability distribution of estimated UCS are compared with measured UCS. Then, three performance indicators are used in this study to evaluate the prediction performance of the empirical equations.Absolute average relative error percentage(AAREP),root mean squared error(RMSE)and variance accounted for(VAF)are adopted as indicators to assess the UCS prediction.
AAREP is a measure of prediction accuracy of estimation method in statistics.Shen and Karakus(2014)explained that AAREP is useful for evaluating a group of data.They used AAREP in their study to evaluate the reliability of Hoek-Brown constant(mi)values calculated by different methods.AAREP is calculated as

where ntis the number of rock data used in analysis;UCSitestand UCSiestare the UCS values obtained from laboratory testing and empirical estimation,respectively.The smaller the value of AAREP,the more reliable the estimation.This assertion is consistent with the results of Shen and Karakus (2014) and Bahaaddini and Moghadam(2019).
RMSE measures the deviation of predicted or estimated values from the observed or measured values.RMSE is calculated as
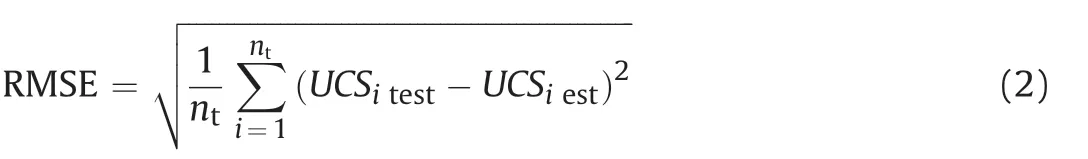
Hyndman and Koehler(2006)explained that RMSE is a measure of accuracy,to compare forecasting errors of different models for dataset.RMSE is always non-negative,and a value of 0 indicates a perfect fit of a model to the data.In general,low RMSE value indicates high prediction ability of empirical model and input data.Willmott and Matsuura(2006)explained that RMSE is the square root of the average of squared errors,and the effect of each error on RMSE is proportional to the size of the squared error.Therefore,larger errors have a disproportionately greater effect on RMSE.
VAF is another statistical method used to measure preciseness of prediction methods.High VAF denotes high prediction performance for a given dataset(Bahaaddini and Moghadam,2019).VAF is calculated as follows:

where Var()is the variance.
The VAF method is often used to verify the correctness of a model,by comparing the observed or measured values with the predicted or estimated values of the model.If the two values are the same,the VAF is 100% .If not,the VAF will be lower.The higher the difference between measured and estimated values,the lower the VAF,and vice versa.
4. Evaluation of UCS estimation from empirical models
4.1. Trend of UCS
Empirical models 1-27 were used to estimate UCS from their respective input data.The estimated UCS values are plotted with measured UCS values in Figs.1-5,which are used to compare the measured UCS with estimated UCS from inputs of Is(50),SRH,BPI,n,and ρ,respectively.From Fig.1,it seems that the Is(50)data and empirical models used provide satisfactory estimation of UCS values.Based on visual judgement of the performance of the empirical models,the estimated UCS from Models 1,3,7 and 11 seems to be close to the measured one.In Fig.1,not all estimated UCS values are close to the measured ones,but they have the same trend.From Fig.2,the estimated UCS values from empirical models and SRH data do not provide a satisfactory characterisation of UCS at the site.For all the cases plotted in Fig.2,the estimated UCS plots far away from the measured UCS.In addition,there are disparities in the trends of the estimated and measured UCS values,unlike those presented in Fig.1.Fig.3 presents the plots of estimated UCS values of sedimentary rock from a model using BPI as input data.Although the empirical model and BPI data underestimate the UCS values,the estimated UCS has a similar trend to the measured UCS.Fig.4 presents the estimated UCS values of igneous and sedimentary rocks from empirical models using effective porosity(n)as input data.For both rock types,the estimated UCS values have different trends from the measured UCS values.Averagely,Model 22 overestimates UCS for igneous rock while Models 23 and 24 underestimate UCS for sedimentary rock.Fig.5 presents the plot of estimated UCS values of igneous and sedimentary rocks from empirical models using density(ρ)as input data.For igneous rock,the estimated UCS has a similar trend to measured UCS but displays an overestimation of UCS compared with the measured UCS in the same figure.For sedimentary rock,the estimated UCS has a different trend from measured UCS and underestimates the UCS compared with the measured UCS.Note that the estimated UCS has not been presented for igneous and metamorphic rocks in Fig.3 and metamorphic rock in Figs.4 and 5.This is because most of the other models available in the literature are developed from several rock types and this study is restricted to specific rock types.

Fig.1.Comparison of the estimated UCS from different models using Is(50)as input data:(a)igneous rock;(b)metamorphic rock;and(c)sedimentary rock.
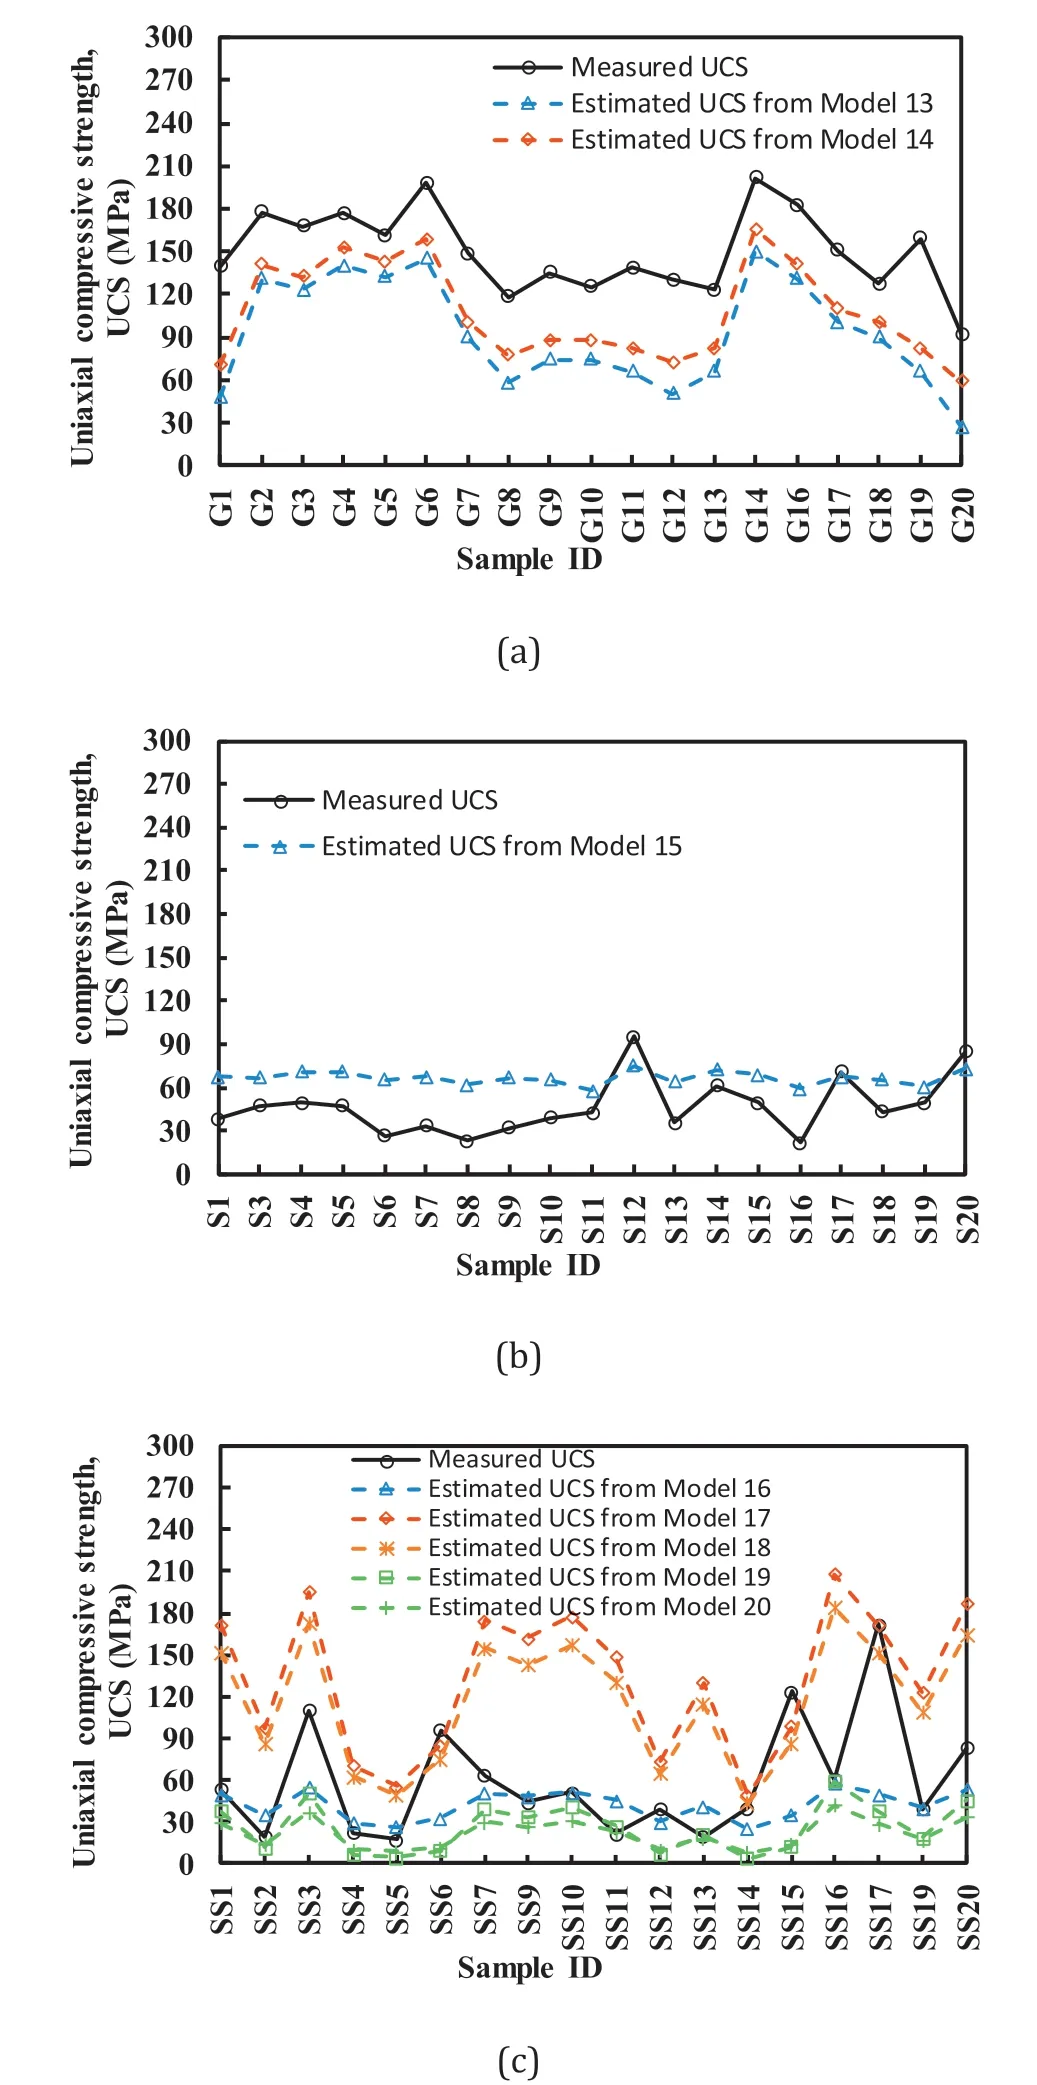
Fig.2.Comparison of the estimated UCS from different models using SRH as input data:(a)igneous rock;(b)metamorphic rock;and(c)sedimentary rock.
4.2. Statistics and probability distribution of UCS
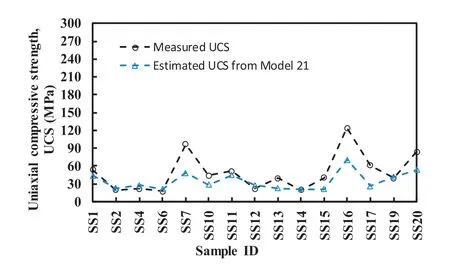
Fig.3.Comparison of the estimated UCS of sedimentary rock from a model using BPI as input data.
Visual examination is not enough to evaluate the estimated UCS from the empirical models and input data.Hence,statistics and probability distribution of estimated UCS are presented and compared with those of measured UCS in this subsection.Table 5 presents the statistics of the estimated UCS from different models including measured UCS. As rock is type-specific in nature,Table 5 divides the results into those of igneous,metamorphic and sedimentary rocks.The minimum values,maximum values,means and standard deviations of UCS are estimated and presented.For igneous rock,Models 1 and 3 produce the results close to the measured UCS in terms of their minimum,maximum and mean values.Many of the models for igneous rock produce estimates with standard deviations being relatively close to that of measured UCS, while the mean values are significantly different.Therefore,Models 1 and 3 using Is(50)can be taken as satisfactory models in this category.For metamorphic rock,the estimated UCS values from the models do not provide satisfactory statistics compared with measured UCS values. Although the estimated UCS from Model 7 using Is(50)produces a mean value relatively close to the mean of measured UCS,other statistics like minimum,maximum and standard deviation values are significantly different from those of the measured UCS.This again indicates the possibility to underestimate or overestimate UCS when UCS is obtained through empirical models.For sedimentary rock,the estimated UCS values from empirical models do not provide satisfactory statistics compared with measured UCS.The physical tests(i.e.n and ρ)and BPI values lead to underestimation of UCS;Is(50)values lead to overestimation of UCS compared with measured UCS,while SRH values lead to underestimation and overestimation of UCS.
Figs.6-8 present cumulative distribution functions(CDFs)of UCS for igneous,metamorphic and sedimentary rocks,respectively.In Fig.6,the CDFs of estimated UCS from Models 1 and 3 are close to that of measured UCS.This fair agreement suggests that the information contained in the estimated UCS using Models 1 and 3 is consistent with that obtained from the measured UCS.The CDFs of the estimated UCS obtained from other models are not close to that of measured UCS.This further confirms the statistical results of the estimated UCS,indicating that Models 1 and 3 provide better estimates than other models.In Fig.7,the CDFs of the estimated UCS generally plot away from that of the measured UCS.Although the CDF of estimated UCS from Model 7 is slightly close to the CDF of measured UCS,it is still far away when compared with the closeness of the CDFs of UCS from Models 1 and 3 as indicated in Fig.6.Like Fig.7,Fig.8 shows that the CDFs of estimated UCS plot away from the CDF of measured UCS.Although the CDF of estimated UCS from Model 11 follows the pattern and trend of the CDF of measured UCS,it plots away from the CDF of estimated UCS.The other CDFs of estimated UCS do not follow the pattern or trend of the CDF of measured UCS,and they plot far away.
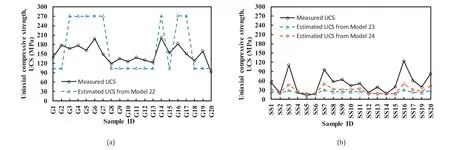
Fig.4.Comparison of the estimated UCS from different models using effective porosity(n)as data input:(a)igneous rock and(b)sedimentary rock.

Fig.5.Comparison of the estimated UCS from different models using density(ρ)as data input:(a)igneous rock and(b)sedimentary rock.

Table 5 Statistics of estimated UCS of rocks using different empirical models and input data.
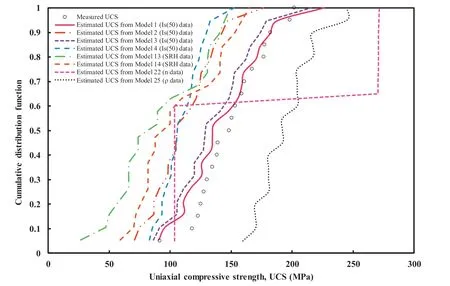
Fig.6.Cumulative distribution function of UCS of igneous rock.
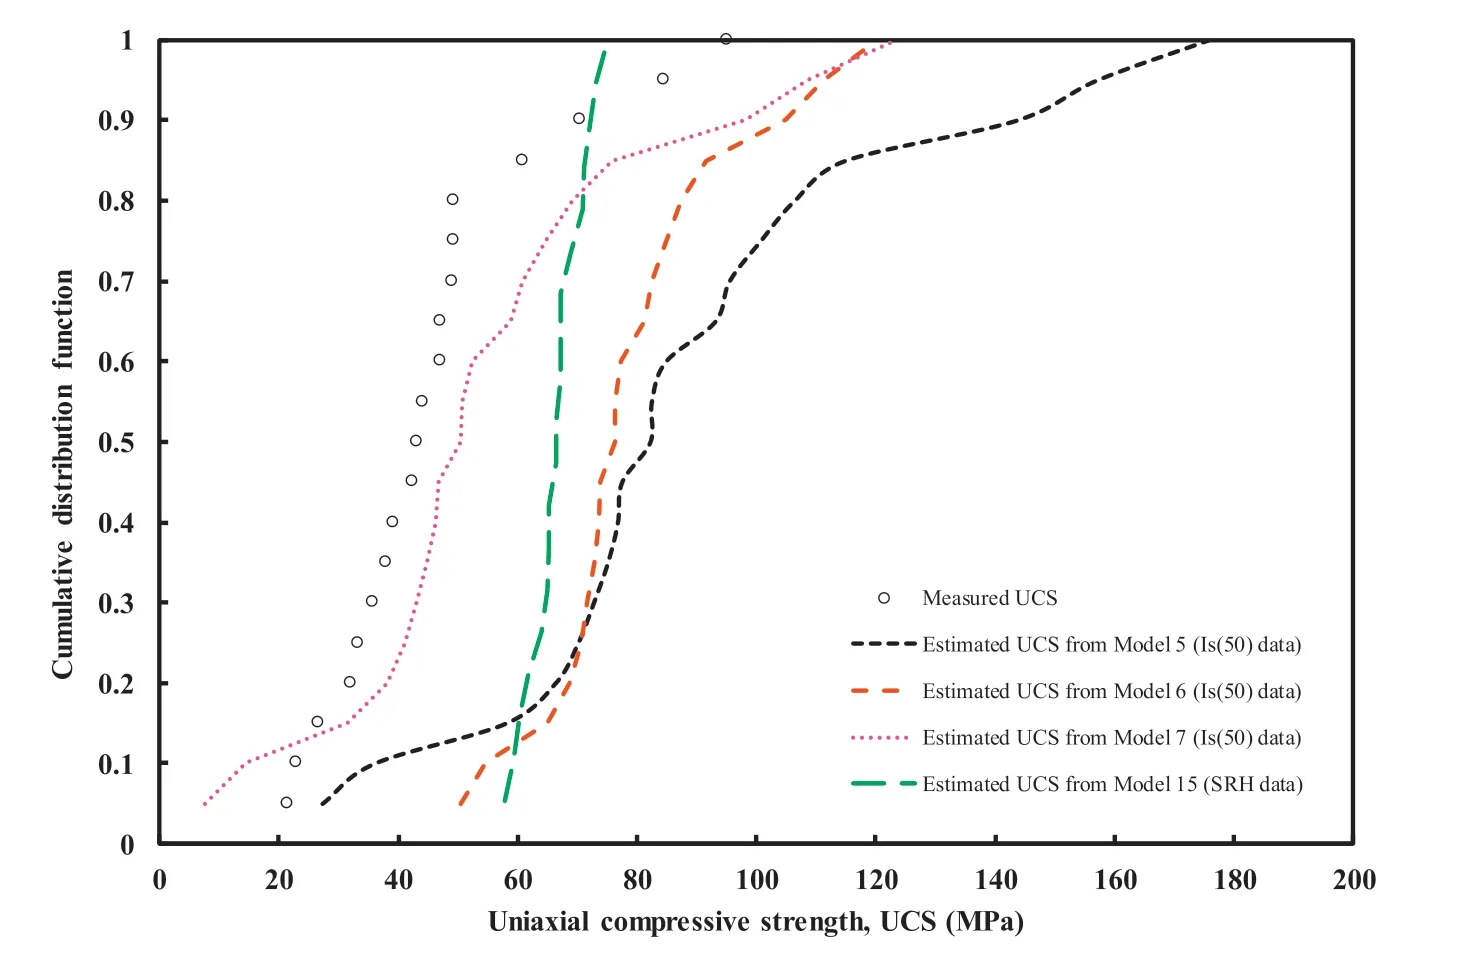
Fig.7.Cumulative distribution function of UCS of metamorphic rock.
4.3. Comparison of prediction performance of the empirical models
AAREP,RMSE and VAF are used to statistically analyse the performance of each regression equation when estimating UCS.Table 6 presents the results of the analyses.Comparison of the results indicates that the prediction performance of empirical equations varies with performance indicators.In this study,the best three prediction performances are identified for each of the performance indicators.For AAREP,Models 1,3 and 2 have the best performances at 7.56% , 10.25% and 23.99% , respectively,because the lower the AAREP,the better the empirical equation’s performance. It is interesting that all the three models are empirical models developed for igneous rocks using Is(50) as input.For RMSE,Models 1,7 and 3 have the best performances at 15.99 MPa,16.46 MPa and 17.67 MPa,respectively.Like AAREP,the lower the RMSE,the better the performance of an empirical equation. Like the regression models with best performances under AAREP,the three models with the best performances under RMSE are also using Is(50)as input.The slight difference from the case of AAREP is that two of three models are for estimating igneous rocks while the other is for metamorphic rocks.For VAF,Models 6,11 and 2 have the best performances at 83.62% ,82.88% and 78.01% ,respectively.Unlike AAREP and RMSE,the higher the VAF,the better the performance of an empirical equation.In a similar fashion to the regression models with best performances under AAREP and RMSE, the three models with the best performances under VAF are those with Is(50) as input. The difference from the cases of AAREP and RMSE is that igneous,metamorphic and sedimentary rocks has one model each out of the three models,with best prediction performances.
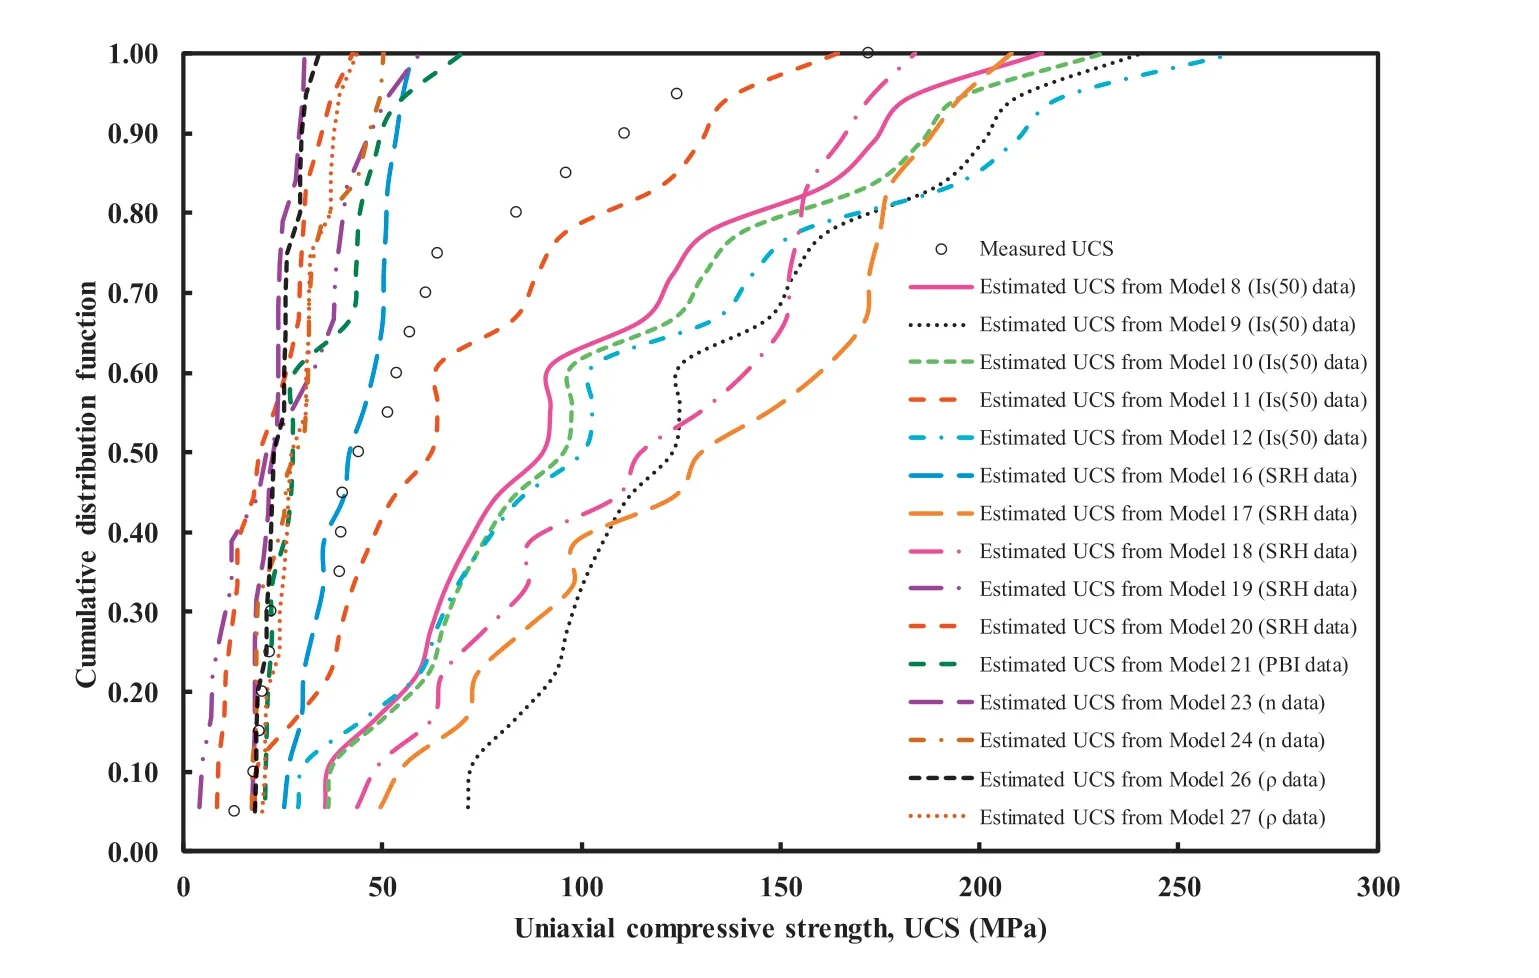
Fig.8.Cumulative distribution function of UCS of sedimentary rock.
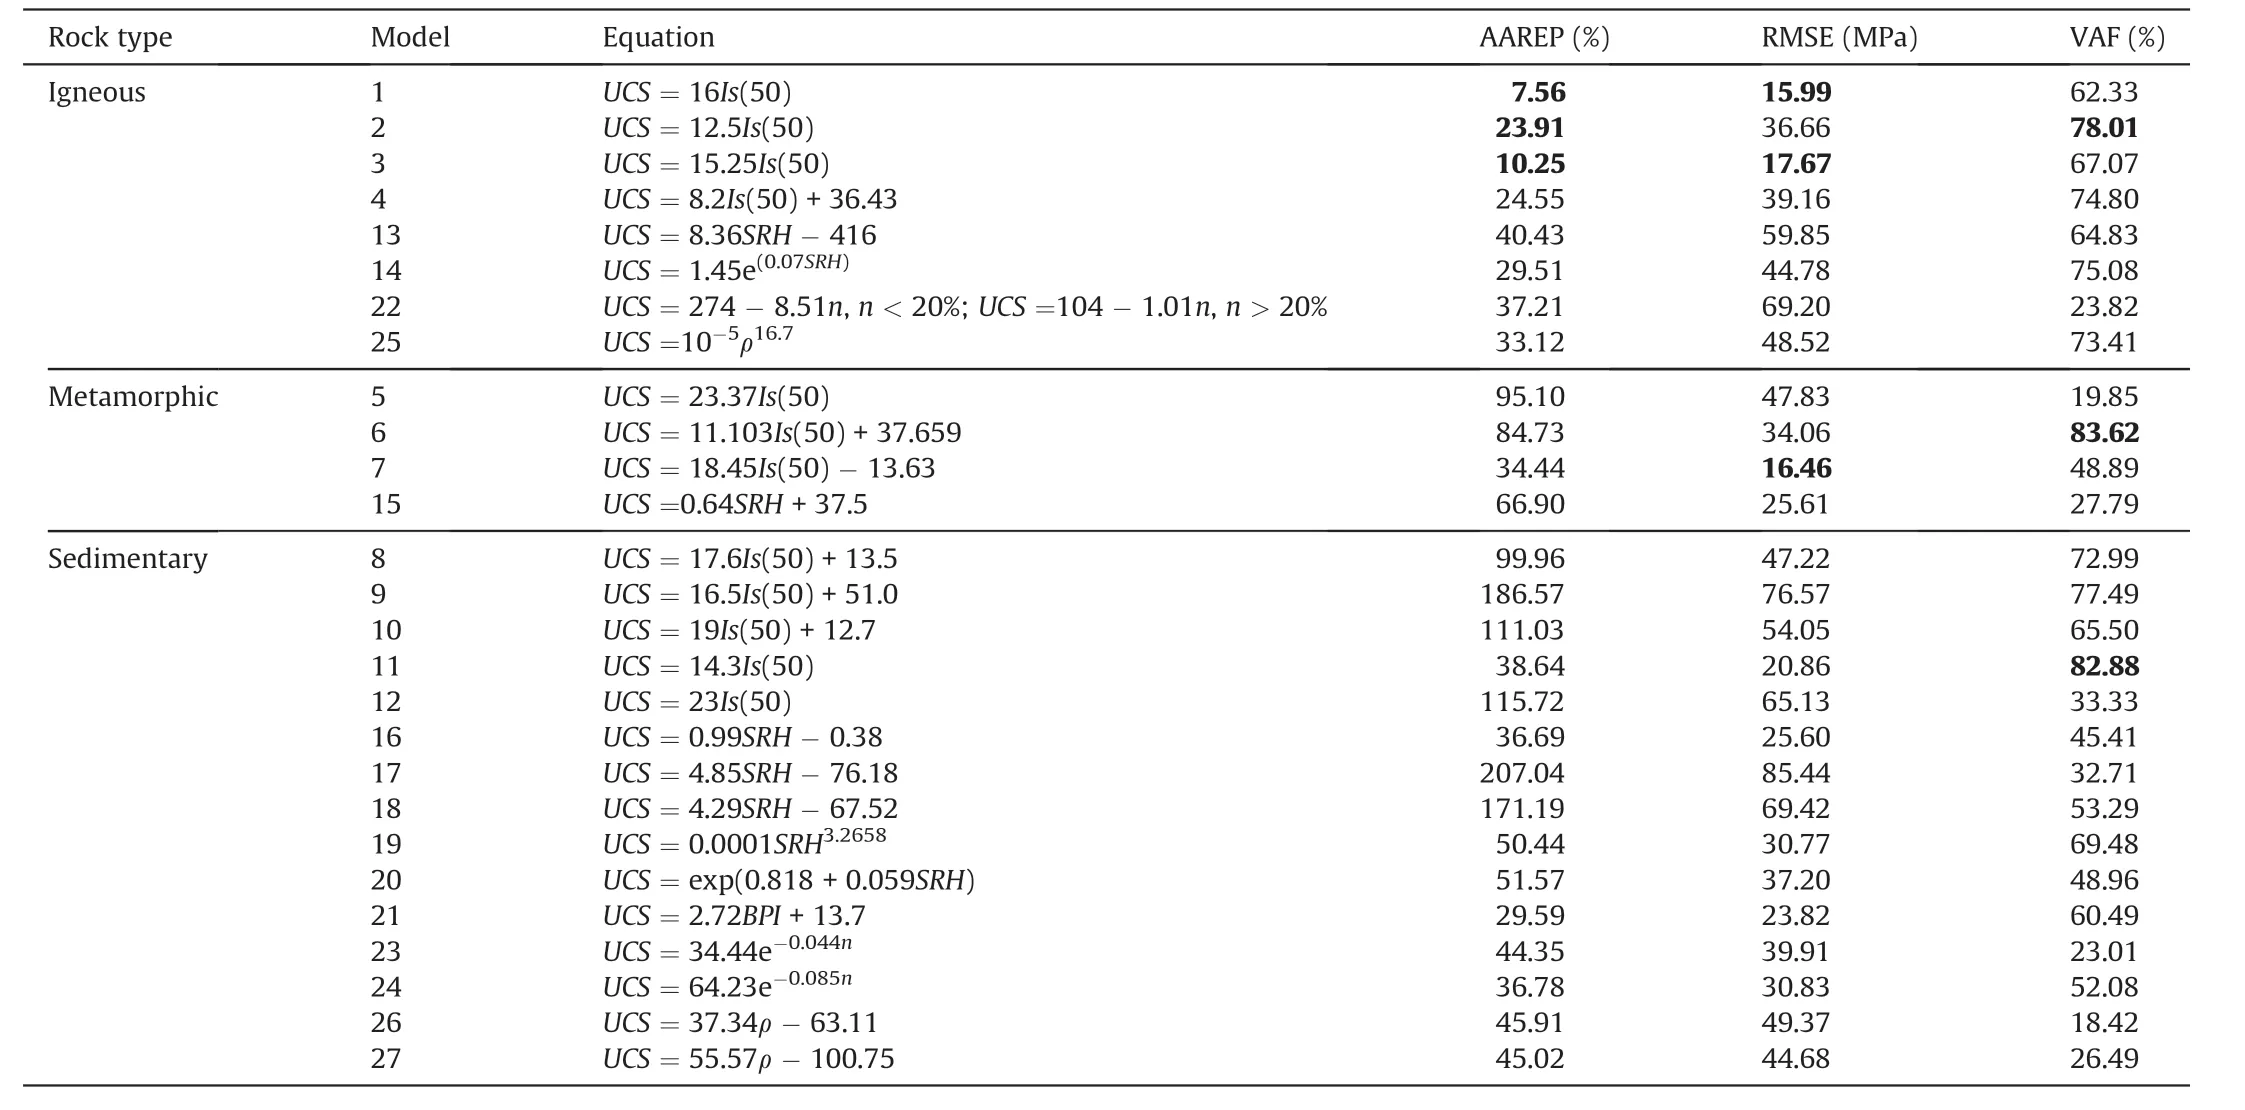
Table 6 Prediction performance of empirical models and input data in estimation of UCS.Models with the best performance in each statistical approach are shown in boldface.
From the statistical analyses using AAREP,RMSE and VAF as prediction indicators,no model emerges as the best in all three analyses.However,each of Models 1,2 and 3 has two best performances from the three statistical analyses.In addition,Model 1 has the best prediction performance in both AAREP and RMSE analyses.From the three statistical analyses performed in this study,the models with the best prediction performance are the empirical equations using Is(50)as input.The point load strength(Is(50))appears to be the best proxy for UCS,which is consistent with previous studies on estimated UCS (Brook,1985; Cargill and Shakoor,1990; Ghosh and Srivastava,1991; Tugrul and Zarif,1999;Mishra and Basu,2013).
5. Conclusions
The UCS is one of the basic inputs required for designs and analyses of most mining engineering projects.Uniaxial compression tests are tedious,time-consuming and expensive when they are used to obtain UCS of rocks.However,at the early stage of many practical applications,and in many small to medium-sized projects,UCS may not be available.Hence,it is necessary to estimate UCS without having uniaxial compression test data.In the absence of measured UCS,mining engineers often estimate UCS based on empirical equations and results from index and physical tests.However,using empirical equations comes with the possibility of overestimation or underestimation of UCS caused by site-specific nature of rock properties,type-specific nature of rock and data that are used to develop empirical equations.
Therefore,this study evaluates the prediction performance of 27 empirical equations in estimating UCS.There are 60 data of uniaxial compression tests in total from three project sites in India,with 20 data each for igneous,metamorphic and sedimentary rocks.The predictionperformances of the empirical equations in estimating UCS from index and physical test results are evaluated using statistical analyses.It isfound thattheempirical equations canunderestimate or overestimate UCS.Only about 5 out of the 27 investigated empirical equations produce satisfactory performances in estimating UCS.Also,point load strength(Is(50))is the most reliable index for estimating UCS among the five types of test results evaluated.Some of the main sources of inaccuracy in empirical estimation of UCS are related to the data used for developing the empirical equations,site-specific nature of rock properties and type-specific nature of rock.Rocks are formed under different geological conditions,which may lead to misleading estimation when empirical equations developed from such rock data are used for rocks with different geological histories.Another source of disparity between estimated UCS and measured UCS may arise from limited number and small range of data used to develop some of the empirical equations reported in the literature.There is a disparity when such empirical equations are used to estimate UCS beyond the range for which they have been developed.
It is suggested that experiments to obtain rock data for development of empirical equations should be performed with utmost care and precaution.This will reduce experimental and measurement errors that will propagate from the data to the empirical equations.The data for development of empirical equations should cover a wide range of rock data,so that the disparity is minimised when it is used for a wide range of rock data.In addition,mining engineers and practitioners should restrict the use of empirical equations to similar rock types from which they are developed.For instance,using empirical equations developed from igneous rock data to estimate UCS of igneous rock reduces some uncertainties which may occur when they are used to estimate UCS of metamorphic or sedimentary rock.Also,the use of machine learning and soft computing techniques is recommended when multiple types of input data are available at rock or project site,and when there is a need for use of multiple regressions to estimate UCS.
Declaration of Competing Interest
The author wishes to confirm that there are no known conflicts of interest associated with this publication and there has been no significant financial support for this work that could have influenced its outcome.
 Journal of Rock Mechanics and Geotechnical Engineering2020年2期
- Journal of Rock Mechanics and Geotechnical Engineering的其它文章
- Sugarcane press mud modification of expansive soil stabilized at optimum lime content:Strength,mineralogy and microstructural investigation
- Dynamic compression characteristics of layered rock mass of significant strength changes in adjacent layers
- Reliability analysis of earth dams using direct coupling
- Centrifuge model test and numerical interpretation of seismic responses of a partially submerged deposit slope
- Anisotropic surface roughness and shear behaviors of rough-walled plaster joints under constant normal load and constant normal stiffness conditions
- Determination of full-scale pore size distribution of Gaomiaozi bentonite and its permeability prediction