Experimental study on the detonation process of a pulse detonation engine with ionized seeds
Ling Lin ,Shun-n Hu ,Yn-in Hu ,*,Gung-ju Xu ,Hong-yu Jio ,Chun-sheng Weng
a School of Automotive Engineering,Changshu Institute of Technology,Suzhou,215500,China
b National Key Laboratory of Transient Physics,Nanjing University of Science and Technology,Nanjing,210094,China
Keywords:Pulse detonation engine Ionized seeds Detonation process Ignition frequency
ABSTRACT An experimental platform of a pulse detonation engine(PDE)was established to study the effect of different K2CO3 ionized seed mass contents on the detonation process.The pressure and ion concentration were detected in the detonation process of the PDE with different contents of ionized seeds.The initiation process of the PDE at different ignition frequencies was studied.The results show that the gas conductivity in the detonation process increased by adding ionized seeds to the PDE tube,and the conductivity increased with the increase in ionized seed mass content.With the increase in ionized seed mass content,the range of the conductivity decreased.The PDE was successfully ignited and formed a stable detonation wave at ignition frequencies of 5 Hz and 10 Hz,and the peak pressure of the stable detonation with the ignition frequency of 5 Hz was 17%higher than that with an ignition frequency of 10 Hz.The detonation wave intensity was weakened and degenerated to a shock wave that propagated in the tube without the fuel filled at the ignition frequency of 20 Hz.©2020 China Ordnance Society.Production and hosting by Elsevier B.V.on behalf of KeAi Communications Co.This is an open access article under the CC BY-NC-ND license(http://creativecommons.org/licenses/by-nc-nd/4.0/).
1.Introduction
The pulse detonation engine(PDE)has recently been recognized as a potential aerospace propulsion device because of its high energy efficiency and great thrust output[1-3].The thrust is an important parameter to measure the performance.How ever,a method to improve the thrust is needed,and most scholars improve the thrust by improving the design of the nozzle[4].How ever,nozzle design has great theoretical and technical challenges due to the instability of the flow field of the combustion chamber[5,6].
The ionization phenomenon occurs on the wave front because of the high temperature and pressure during the detonation process[7-9].The plasma produced during the detonation process can be used as a magnetohydrodynamic(MHD)generator or for flow control by adding an external magnetic field.Research indicates that the thrust of the PDE can be improved by the MHD augment[10],which transforms the energy from the high-temperature and high-pressure gas discharged from the detonation chamber to kinetic energy through the magnetic fluid accelerator to maximize the thrust.The core technology of MHD acceleration is the ionization of the air flow.How ever,it is necessary to increase the ionization efficiency during the detonation process because of the limited amount of plasma produced by detonation.A magnetohydrodynamic acceleration experiment using an arc shock tube was studied by the NASA Research Center[11],where the electrical conductivity of air increased by injecting potassium carbonate powder.The electrical conductivity in ionized gas mixtures produced by detonation was numerically investigated with and without potassium seeds by J.C.Schulz[12].The results show that the addition of potassium ionized seeds could effectively improve the air conductivity,and a stable detonation wave could not be formed once the mass content of the ionized seeds exceeded a certain value.The interconnection between the electromagnetic field and the detonation was discussed in detail,and the interaction between the propagating process of the detonation wave and the external electromagnetic field was studied by Cole[13].The MHD power extracted from rotating detonation combustors was numerically investigated by Braun[14]using an in-house monodimensional flow solver with a chemical kinetics library.The electrical conductivity of the detonation with various mixtures with and without seeding was analysed.
A model of the PDE with ionization seeds was established to numerically study the effects of ionization seeds on the detonation characteristics[7].The effect of the ionization seed contents on the electrical conductivity and detonation characteristic parameters was analysed,and the MHD control of the detonation process was realized by adding the external electromagnetic field device.The results show that the addition of ionized seeds to the PDE could increase the ion concentration produced during the detonation process.In this paper,an experimental platform of the PDE was built to study the effect of different K2CO3ionized seed mass contents on the detonation process.The pressure and ion mass concentration in the detonation process with different ionized seed mass contents were detected,and the initiation process at different ignition frequencies was studied.
2.Experimental system
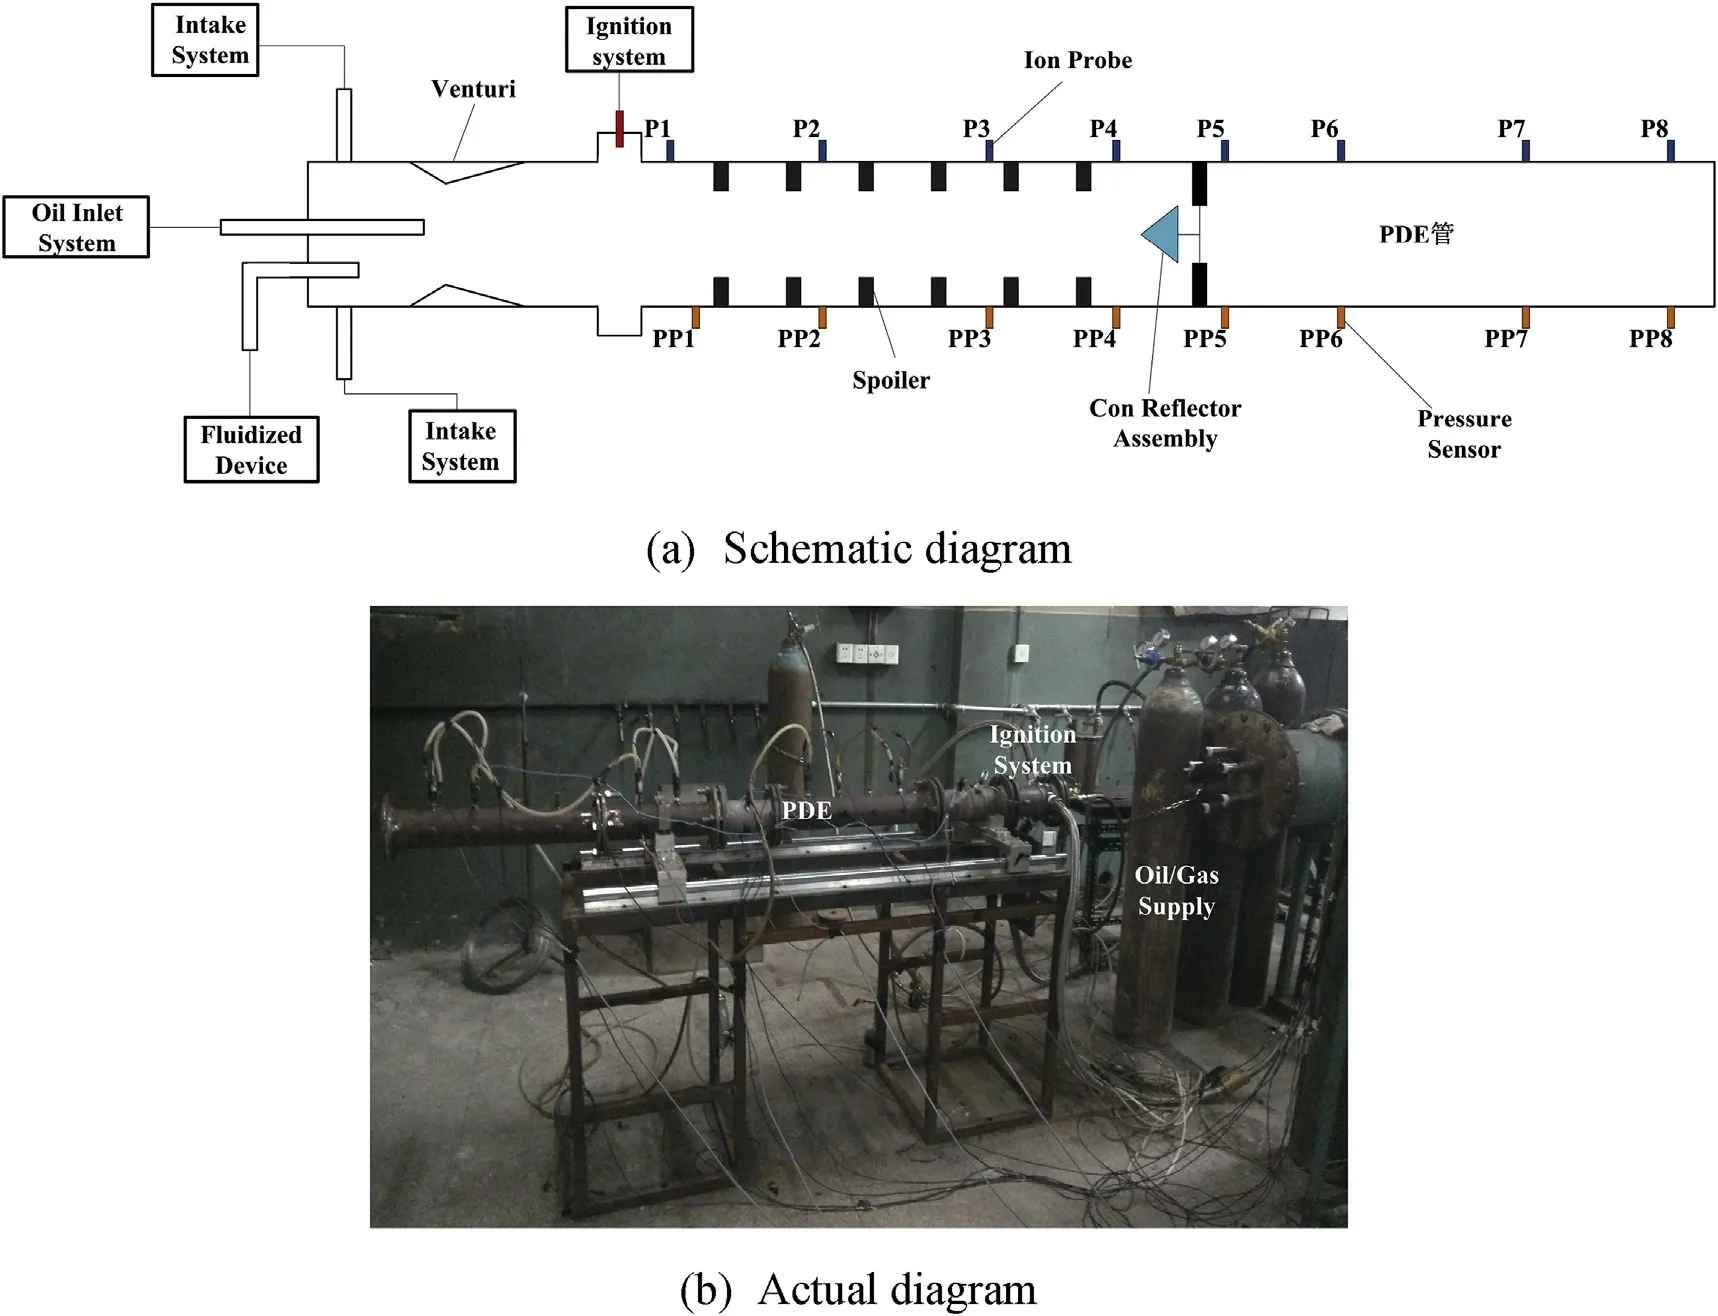
Fig.1 shows the schematic diagram of an experimental system of the PDE with the K2CO3fluidizer.The experimental system is composed of a detonation tube,an oil supply/gas supply system,an ignition control system,a test system,a powder fluidizing device,etc.
The detonation tube consists of a mixing chamber,an ignition chamber and a detonation chamber.The detonation tube is 0.08 m in diameter and 1900 mm in length.The mixing chamber is equipped with a tangential air inlet,a fine atomizing nozzle and a venture.The oxidant flow s vertically through the air inlet,and the primary atomization injects gasoline droplets into the Venturi.The second atomization occurs in the Venturi and is fully mixed with the oxidant.A plasma ignition device is installed in the ignition chamber.The ring spoiler device is also installed in the detonation chamber to enhance the combustion process.
In the oil/gas supply system,the gasoline in the tank is transported to the PDE by nitrogen extrusion.Gas delivery is controlled by the pressure and flow rate by regulating the pressure relief valve at the outlet of the nitrogen cylinder.
The test system consists of a pressure sensor,a thrust sensor,a data acquisition system and a coolant system.The signals obtained by the pressure sensor and thrust sensor are converted to a digital signal via an A/D converter.The temperature should not be too high when the pressure sensor operates,and the cooling water jacket is used to cool the pressure sensor.
The high-frequency dynamic pressure sensors of 113B24 and 113B26 series of PCB company were used for pressure measurement.The measurement accuracies of the pressure sensors were±1.3%FS,and the ion probe was homemade.The thrust measurement was based on PCB’s 208C05 series force transducers,which have measurement accuracies of±1.0%FS.The measured signal was processed by a signal conditioner and collected by an NI PXIe-1062Q multi-channel high-speed data acquisition system.The acquisition software was a PDE-32 channel signal acquisition and analysis system based on LabView software,and the sampling frequency was 500 k samples/s during the test.

Fig.1.Schematic diagram of the PDE experimental system.
During the experiment,a gasoline/oxygen rich mixture was filled with a stoichiometric ratio in a detonation tube with an oxygen mass fraction of 40%.The ignition frequency was 10 Hz,and the ignition position was 320 mm from the head.Positions P1-P8 were equipped with an ion probe,and all of them were ion signal acquisition points.The distances between positions P1-P8 and the left thrust wall were 395 mm,780 mm,880 mm,1080 mm,1270 mm,1370 mm,1780 mm,and 1880 mm,respectively.Positions PP1-PP8 were equipped with pressure sensors,and all of them were pressure acquisition points.The distances between positions PP1-PP8 and the left thrust wall were 580 mm,780 mm,880 mm,1080 mm,1270 mm,1370 mm,1780 mm,and 1880 mm,respectively.Test points P1 and PP1 were located between the ignition section and the spoiler,test points P2,P3,PP2 and PP3 were near the spoiler,test points P4 and PP4 were located between the spoiler and the shock wave reflector,and test points P5 and PP5 were located in the rear of the shock wave reflector.
3.Analysis of ion concentration at different locations during detonation
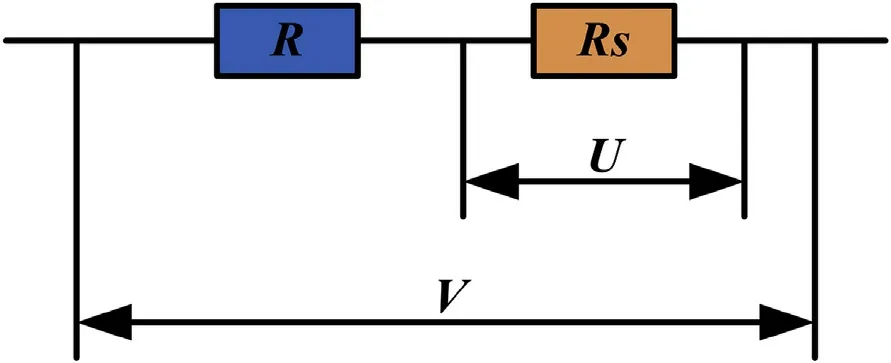
The ionization phenomenon occurs with the burning of the gasoline/air mixture in the combustion chamber,and ions and free electrons will make the gas have a certain electrical conductivity.Ions and free electrons have directional motion when the supply voltage is added to the ion probe poles,and a current is formed between the positive and negative components of the ion probe.Therefore,it is approximately equal to a gas electricresistance for the ion probe.The combustion condition in the engine chamber can be understood by monitoring the resistance.A schematic diagram of the ion probe is shown in Fig.2,and detailed instructions can be found in the literature[15].
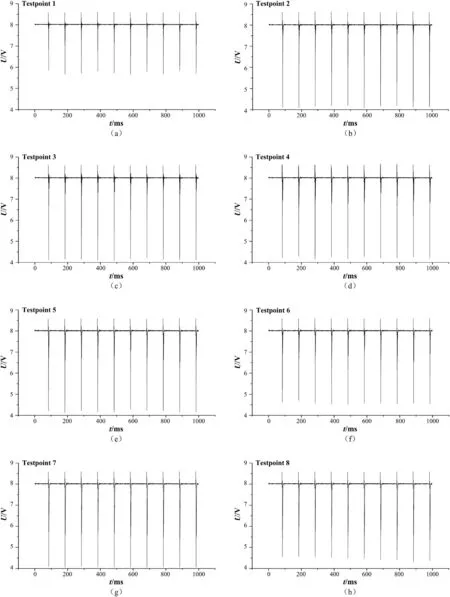
The combustion condition inside the detonation tube can be determined to study the detonation process with ionized seeds by detecting the ion concentration at different positions.Fig.3 shows the ion probe signal diagram at test points P1-P8 at an ignition frequency of 10 Hz.The diagram indicates that the ignition initiation was successful at the ignition frequency of 10 Hz since 10 sharp peaks appeared in 1000 ms.The baseline voltage in the figure was 8 V.Before ignition began,there was no combustion in the detonation tube,and the voltage at gas resistance Rs was equal to the supply voltage.The signal voltage value U(75 mm from the ignition position)was 5.66-5.85 V,as shown in Fig.3(a).The voltage signals in the spoiler were 4.11-4.35 V and 4.12-4.20 V(as shown in Fig.3(b)and Fig.3(c)).The voltage signal value between the spoiler and the shock reflector was 4.15-4.31 V(as shown in Fig.3(d)).The voltage signal values measured in Fig.3(e)-Fig.3(h)were 4.14-4.44 V, 4.50-5.16 V, 4.08-4.14 V, and 4.30-4.54 V,respectively.
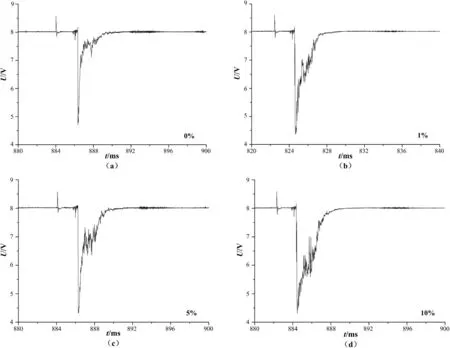
Fig.4 shows partial zoomed-in images of the ion probe signal at different positions.The voltage signal values were 8 V before ignition,and the ignition signals,which were similar to the sine signal,appeared when the plasma was ignited.The signal in Fig.4(a)slowly decreased and subsequently increased after ignition began.The gasoline/air mixtures near the ignition section were ignited by the plasma jet,and some ions were generated with the combustion process.At the beginning of ignition,the combustion of the combustible mixture in the PDE tube was not sufficiently complete;thus,the voltage signal slowly decreased.The voltage signal slowly increased and subsequently became stationary because ion generation was accompanied by ionic polymerization.As shown in Fig.4(b)and Fig.4(c),the voltage signal after ignition rapidly dropped,slowly increased,dropped again and finally stabilized.

Fig.2.Schematic diagram of the ion probe.
The shock wave intensity was enhanced by the reflection that occurred at the spoiler.The appearance of the first peak was due to the ionization generated by the violent chemical reaction.The ion concentration sharply increased,and thus,the voltage at the gas resistance sharply decreased.Subsequently,the molecules were formed after ion reunion,and the ion concentration decreased;thus,the voltage value at the gas resistance constantly increased[15].Ionization seeds were added into the PDE tube.The thermal ionization phenomenon occurred with temperatures above 2000 K due to the low ionization energy of the ionized seeds;thus,the latter peaks in the figure appeared.As shown in Fig.4(g)and Fig.4(h),the voltage signal sharply decreased;then,the rate of increase in amplitude decreased.The high temperature produced by the detonation ionized the gas,increasing the concentration of the ions produced by thermal ionization.Thus,stable detonation occurs at this time.
4.Analysis of the detonation process at different ignition frequencies
An experimental study was performed to study the detonation process of the PDE with K2CO3ionized seeds at ignition frequencies of 5 Hz,10 Hz and 20 Hz by testing the pressure and ion concentrations at different positions.Fig.5 shows the detonation pressures and ion signals at three ignition frequencies.There were 5,10 and 20 sharp waves in 1000 ms.Hence,the ignition process was realized at ignition frequencies of 5 Hz,10 Hz and 20 Hz.In Fig.5(a),the peak pressure was 3.08-3.54 MPa and the pressure signal was 4.08-4.32 V.In Fig.5(b),the peak pressure was 2.52-3.0 MPa and the pressure signal was 4.07-4.16 V.In Fig.5(c),the peak pressure was 0.34-0.47 MPa,and the pressure signal was 7.67-7.84 V.From the data analysis,Fig.5(a)and Fig.5(b)indicate successful detonation,while Fig.5(c)shows that the detonation wave was not formed.The gasoline/air explosive mixture in the detonation tube was in the over-filled state and filled state at ignition frequencies of 5 Hz and 10 Hz,respectively.The peak value of the detonation pressure in the over-filled state was greater than that in the filled state.Because the gasoline/air was not filled to the position of the test point,no detonation occurred at 20 Hz.
The pressure versus time curve at different test points was locally amplified to evaluate the DDT process of the gasoline/air explosive mixture with ionized seeds at different ignition frequencies.Fig.6 shows the tube wall pressure versus time curve at different test points,which were under single ignition at ignition frequencies of 5 Hz,10 Hz and 20 Hz.When the plasma igniter was turned on,the pressure sensor was first disturbed,and the pressure sharply rose at the nearest test point(i.e.,test point 2).The transverse wave that propagated upward was formed when the compression wave travelled to the lower wall.The combustion wave was converted into a local strong detonation wave due to the chemical reaction,which was enhanced by the collision between the spoiler and the compression wave.Because test points 2 and 3 were located between the spoilers,the measured pressure was a strong detonation pressure.The strong detonation wave intensity continued to weaken without the effect of the spoiler,and a stable detonation wave finally formed with the continuous action of the detonation tube wall.

Fig.3.Ion probe signal at different positions.

Fig.4.Partial zoomed-in images of the ion probe signal.

Fig.5.Pressure and ion probe signal at different ignition frequencies.
The peak pressure at test point 2 reached 4 MPa and decreased at test points 3 and 4 in Fig.6(a);the peak pressure was reached at test point 4 in Fig.6(b)and Fig.6(c).The pressure at test point 5 obviously dropped in these three pictures and subsequently rose to form a stable pressure wave.Test points 2 and 3 were located between the spoilers,test point 4 was located between the spoiler and the shock reflector,and test point 5 was located after the shock reflector.“Overdrive detonation”refers to detonation process in which the main detonation parameters,such as detonation pressure and propagating velocity,exceed the theoretical Chapman-Jouguet(C-J)values[16-18].It was know n that the overdrive detonation phenomenon occurred at test point 2(the peak pressure was 3.95 MPa higer than the CJ pressure 3.09 MPa)because the shock wave was strengthened by the spoiler at an ignition frequency of 5 Hz.How ever,overdrive detonation occurred at test point 4(the peak pressure were 3.63 MPa and 3.96 MPa,respectively)due to the effect of the spoiler and shock reflector at ignition frequencies of 10 Hz and 20 Hz.Because the intensity of the detonation wave was weakened by the shock reflector,the pressure peak obviously decreased at test point 5 at the back end of the shock reflector.The peak pressures at test points 7 and 8 were 3.20 MPa and 3.28 MPa,respectively,in Fig.6(a),whereas they were 2.81 MPa and 2.78 MPa in Fig.6(b).The pressure measured at test points 7 and 8 in Fig.6(a)and Fig.6(b)first sharply increased and subsequently decreased to a plateau pressure.They continued to decline and tended to be smooth and eventually similar.Thus,stable detonation occurred at test points 7 and 8.The intensity of the detonation wave decreased when the detonation wave propagated in the tube direction in Fig.6(c),which indicated that it degenerated into the shock wave propagation in the tube,since the pressure curve rose for a long time at test point 6.The PDE tube was not fully filled with the gasoline/air explosive mixture because the ignition frequency was too high.The detonation wave degenerated into a shock wave without the supporting energy in the propagation process.
The average velocity of the propagation wave at different

Fig.6.Tube wall pressure versus time curve at different test points under single ignition.
Tpositions and ignition frequencies,which is shown in Table 1,was calculated using the ratio of the distance between two adjacent test points to the time difference of the arrival of the same wave.Table 1 shows that the velocities of the stable detonation waves formed at ignition frequencies of 5 Hz and 10 Hz were 2114.5 m/s and 2035.5 m/s,respectively.The wave speed u45 at the ignition frequency of 20 Hz decreased more obviously than those at ignition frequencies of 5 Hz and 10 Hz.The wave speed decreased to 840 m/s after test point 5,which was obviously lower than the CJ wave speed.The pressure at test point 5 in Fig.6(c)was also lower than that in Fig.6(a)and Fig.6(b),which indicates that there was no fuel at this location,and the detonation wave degenerated into a shock wave in the propagation process.

able 1 Wave velocity in the PDE tube at different ignition frequencies.
The PDE was successfully ignited and formed stable detonation w aves at ignition frequencies of 5 Hz and 10 Hz under the experimental conditions,and the peak pressure of stable detonation with an ignition frequency of 5 Hz was 17%higher than that of 10 Hz.With an ignition frequency of 20 Hz,there was no fuel at test point 5,and the detonation wave degenerated into a shock wave while propagating in the PDE tube.
The average velocity of a combustion wave propagating between two pressure measuring points can be calculated according to the distance between the two points and the difference between the times at which the combustion wave reaches each pressure measuring point[19].The theoretical detonation pressure of C-J for an octane/air mixture is 3.09 MPa,and the propagation velocity of the detonation wave is 2230.4 m/s when the initial pressure is 0.1 MPa and the initial temperature is 300 K[20].The pressure and propagation velocity of the combustion wave measured in the experiment are slightly lower than the theoretical value of C-J detonation because,for the two-phase detonation process,there are factors such as fuel atomization,mixing and mixture distribution[21].Therefore,this test can be considered to be a successful initiation combined with the measured peak pressure and propagation velocity of the combustion wave.
5.Analysis of the detonation process at different ionization seed contents
The experiment on the gasoline/oxygen-enriched air of the pulse detonation engine with K2CO3mass contents of 0%,1%,5%and 10%at an ignition frequency of 10 Hz was performed to study the effect of K2CO3mass content on the performance of the PDE.The pressure of the PDE tube wall at test point 8 at different K2CO3mass contents was analysed due to the formation of the stable detonation wave at this point.
The curve of pressure versus time in the PDE with K2CO3mass contents of 0%,1%,5%and 10%at test point 8 is shown in Fig.7.In the diagram,the pressure of the PDE with different ionized seed mass contents at test point 8 congruously changed with time.When the plasma igniter was not activated,an ignition signal first appeared,and the pressure at the position of the detonation wave sharply increased.Then,it continued to decline to a platform pressure,slowly declined and finally stabilized.The wall peak pressures were 2.753 MPa,2.771 MPa,2.795 MPa,and 2.805 MPa,at K2CO3mass contents of 0%,1%,5%and 10%,respectively.The peak pressures at test point 8 with K2CO3mass contents of 1%,5%and 10%increased by 0.65%,1.5%and 1.8%,respectively,compared without K2CO3.With the increase in K2CO3mass content,the increase in peak pressure was not obvious.Therefore,the addition of a certain amount of K2CO3to the detonation tube had little effect on detonation.
Fig.8 shows the curve of the ion concentration versus time at test point 8 with K2CO3mass contents of 0%,1%,5%,and 10%.The diagram shows that there was no ionization in the PDE combustion chamber because the igniter was not activated,and the voltage measured at both ends of the gas resistance Rs was 8 V,which is equal to the power supply voltage.There was an obvious ignition signal when the igniter was activated.The ion signal rapidly decreased due to ion production during the combustion of the gasoline/air mixture and the high temperature produced by the detonation process,which ionized the gas.The ions and free electrons created a certain conductivity of the gas,which was approximately a gas resistance.A circuit was formed by the gas resistance and partial pressure resistance;thus,the voltages at both ends of the gas resistance were reduced.A smaller value of U corresponds to a greater voltage of the gas resistance,which indicates a greater ion concentration produced by ionization.The voltage signal in the graph began to rise after the sharp decline.The increase gradually slow ed so that the value of U was equal to the power supply voltage.The ions produced by the detonation process converged into molecules so that the ion concentration decreased.The temperature generated by the detonation process was as high as 3000 K,while the ionization temperature of the ionized seeds added to the detonation tube was 2000 K.Therefore,the hightemperature gas after the flame was re-ionized slowed the decrease in the ionic concentration.The peak voltage signals at test point 8 of the PDE with the K2CO3mass contents of 0%,1%,5%,and 10%were 4.757 V,4.402 V,4.349 V and 4.337 V,respectively.The decrease in the peak value of the pressure signal implies that the ion concentration in the PDE tube increased with the increase in ionized seed content.The area S enclosed by the ion signal curve and the baseline U=8 V indicates the ion content within a certain time in the PDE tube.A larger area S corresponds to a greater concentration of the ions and a higher conductivity.The ion concentration measured in the PDE with seed mass contents of 1%,5%and 10%increased by 10.89%,11.41%and 13.38%,respectively,from that without K2CO3.Therefore,the addition of ionized seeds into the PDE tube could increase the conductivity of the gas in the detonation process,and the conductivity increased with the increase in ionization seed mass content.The rate of increase in electrical conductivity decreased with the increase in ionized seed mass content.

Fig.7.Enlarged curve of pressure versus time at different K2CO3 mass contents.

Fig.8.Enlarged curve of ion concentration versus time at different K2CO3 mass contents.
6.Conclusions
In this paper,an experimental platform of a pulse detonation engine was established.The pressure and ion concentration were detected during the detonation process of the PDE with different contents of ionized seeds.The initiation process of the PDE at different ignition frequencies was studied.The results show that the following
(1)The gas conductivity in the detonation process was increased by adding ionized seeds to the PDE tube,and the conductivity increased with the increase in the ionized seed mass content.The range of the conductivity decreased with the increase in ionized seed mass content.
(2)The PDE was successfully ignited and formed a stable detonation wave at ignition frequencies of 5 Hz and 10 Hz,and the peak pressure of stable detonation with an ignition frequency of 5 Hz was 17%higher than that of 10 Hz.The detonation wave attenuated and degenerated to a shock wave that propagated in the tube without the fuel filled at the ignition frequency of 20 Hz.
Declaration of competing interest
The authors declare that they have no conflicts of interest.
Acknowledgment
This study was supported by the National Natural Science Foundation of China(No.11802039,No.51605046)and the Jiangsu Natural Science Foundation of China(No.BK20160406).
- Defence Technology的其它文章
- A review of dual-spin projectile stability
- A new look on the electric spark sensitivity of nitramines
- Damage assessment of the target area of the island/reef under the attack of missile warhead
- Physical and damping properties of kenaf fibre filled natural rubber/thermoplastic polyurethane composites
- Effect of transverse compression on the residual tensile strength of ultrahigh molecular weight polyethylene(Dyneema®SK-76)yarns
- Design of infrared camouflage cloak for underground silos

