
Impact of Phenanthrene on Denitrification Activity and Transcription of Related Functional Genes in Estuarine and Marine Sediments
2020-03-09 04:49:58SUNPengfeiBAIJieLIKuiranZHAOYangguoTIANWeijunBAIXiaoyanandTIANYanzhao
SUN Pengfei, BAI Jie, 2), LI Kuiran, ZHAO Yangguo, 2), TIAN Weijun, 2), BAI Xiaoyan, and TIAN Yanzhao
Impact of Phenanthrene on Denitrification Activity and Transcription of Related Functional Genes in Estuarine and Marine Sediments
SUN Pengfei1), BAI Jie1), 2), LI Kuiran3), *, ZHAO Yangguo1), 2), TIAN Weijun1), 2), BAI Xiaoyan1), and TIAN Yanzhao1)
1)College of Environmental Science and Engineering, Ocean University of China, Qingdao266100, China 2) The Key Laboratory of Marine Environmental Science and Ecology, Ministry of Education, Ocean University of China, Qingdao 266100, China 3) College of Marine Life Science, Ocean University of China, Qingdao 266003, China
The effects of phenanthrene (Phe) on the denitrification activity and denitrifying genes (,and) were evaluated by dose-response experiments in sediments of Dagu River Estuary (DRE) and Jiaozhou Bay (JZB). The results showed that potential denitrification activity (PDA), N2O, NO3−and NO2−reduction rates of both areas were inhibited with an increase of Phe concentrations. The PDA, N2O, NO3−and NO2−reduction rates of both areas was highest and lowest in the control (DRE: 0.453, 0.427, 7.439 and 3.222mgNkg−1h−1, JZB:0.592, 0.555, 8.470 and 3.793mgNkg−1h−1) and highest Phe amended treatments (DRE: 0.069, 0.001, 4.486, and1.563mgNkg−1h−1; JZB: 0.114, 0.024, 5.527 and 2.200mgNkg−1h−1). The inhibition rate of PDA was highest, follow by NO2−reduction and then NO3−reduction. Moreover, with the increasing of Phe concentrations, total bacteria count and the abundance of denitrifying genes were decreased. And N2O accumulation was promoted with the addition of Phe for both areas. Based on the comparison of EC50values, denitrifiers harboring three genes were more sensitive to Phe thanPDA, and denitrifiers harboringgene were more sensitive, followed bygene, and thengene. Furthermore, according to correlation analysis, the relative abundance of denitrifying genes was much more positively correlated with PDA, NO3−and NO2−reduction than total bacteria count. In addition, thedenitrification activity and total bacteria count in JZB were more inhibited than that of DRE. This study is useful for understanding the impact of Phe pollution on denitrification in estuary and marine sediments, with profound implications for the management of aquatic ecosystems regarding eutrophication (N-removal) and greenhouse effect.
phenanthrene effect; denitrification; denitrifying genes; estuarine sediment; marine sediment
1 Introduction
Polycyclic aromatic hydrocarbon (PAHs), as a group of ubiquitous persistent organic pollutants (POPs), are listed as priority pollutants by international environmental protection agencies due to their carcinogenic, mutagenic, and toxic effects (Ghosal., 2016). PAHs mainly originate from anthropogenic activities, what is more, incomplete combustion of fossil and biomass fuel, oil spills vehicle, exhausts and industrial production are main source of PAHs. Several studies have demonstrated that marine sediments are the most important reservoir of PAHs, which can affect the sediment bacterial community structure in relation to N cycle (.., N-fixing bacteria) (Zhou., 2009; Sun., 2012; Cannarsa., 2014; Zhang., 2014). Especially, phenanthrene (Phe) with its toxicity on nitrification activity is particularly noteworthy (Maliszewska-Kordybach., 2007).
Denitrification is a crucial microbial process in the nitrogen (N) cycle, which plays an important role in estuarine and coastal systems because N compounds (NO3−and NO2−) are available for phytoplankton and macrophyte blooms in the coastal zone (Seitzinger., 2006). It is already known that microbial denitrification is the primary pathway by which fixed N such as NO3−returns to the atmosphere from terrestrial and aquatic environments. In addition, the selective inhibition of different steps in the denitrification process in soil/sediment could aggravate the ecological consequences of pollution. It has been proved that the process of N2O reduction is more sensitive than the process of NO3−reduction in denitrification (McKenney and Vriesacker, 1985). Hence it would lead to the accumulation of N2O to toxic levels, and a selective inhibition of NO reductase or N2O reductase by heavy metals and PAHs enhanced NO or N2O emission from soils (Holtan-Hartwig., 2002; Guo., 2011). Besides N2O has a 300-fold higher global warming potential than carbon dioxide (CO2) (Canfield., 2010).As a consequence, the incomplete denitrification can cause large N2O emissions, which might lead to global warming and stratospheric ozone destruction (Wuebbles, 2009).
In recent years, with the intensification of human activities, the Dagu River brought into Jiaozhou Bay (JZB) rich nutrients and contaminants, the total concentrations of PAHs in Dagu RiverEstuary (DRE) and JZB surface sediments ranged from 0.02 to 29.56 g kg−1(Liu., 2016). Therefore, evaluation the effect of PAHs pollution on N2O production, denitrification and denitrifiersin estuarine and marine sediments is an important environmental concern. Furthermore, as estuary and bay areas are two typical habitats with different physical-chemical characteristics. whether the responses of denitrification processes to PAHs exposure were different or not was unknown. This study examined how a gradient of one major pollutant, Phe, can affect different denitrification steps in estuarine and marine sediments, taking transcripts of NO3−(, NO2−() and nitrous oxide reductase () into account as well.
2 Materials and Methods
2.1 Site Description and Sample Collection
The DRE and coastal marine sediment of JZB were selected as the sampling site. The JZB is located in northern China (35˚43´-36˚18´N, 120˚04´-120˚23´E), and it is the home of Qingdao Port. More than 10 rivers flow into JZB, of which the length and watershed area of Dagu River are the longest and largest, and it is also an important sediment provenance of JZB. With the intensification of human activities, the study area has been heavily modified with bank re-alignment, port, shipyard and fishing harbor. This ecosystem is also impacted by agricultural run-off and urban and industrial sewage processing units, thus large amount of nutrients and other waste from domestic, industrial and agricultural areas were discharged into this area.
Surface sediments (0-5cm) samples were collected from two stations,.., E (36˚10´07´´N, 120˚08´11´´E) and S (36˚07´37´´N, 120˚11´02´´E) in July 2017 (Fig.1). The collected marine sediments were sealed in polyethylene bags to preclude the possibility of sediment oxidation, placed in covered buckets, and stored in a dark cold room at 4℃ (without sediment freezing) prior to use. The sediment from two stations was air-dired, and further sieved to remove debris over 1mm in size, followed by thorough homogenization before sediment characterization and following experiment (Zhang., 2015). Sedi- ments used in the present study had negligible background levels of Phe (0.035±0.003mg Phe/Kg sediment in DRE and 0.041±0.004mgPhe/Kg sediment in JZB based on GC-MS) compared with the spiked Phe concentration. Seawater samples were collected from the water column overlaying the sediment by using a water sampler, which comprised a transparent polyvinyl chloride cylinder with a capacity of 2L. The collected water was stored in polyethylene acid (10% HCl) cleaned (milli-Q water rinsed) bottles. Seawater samples were immediately transported to laboratory and filtered by 0.22μm membrane filters, then stored at 4℃. Samples were processed for the slurry experiments as described below (Xu., 2016).
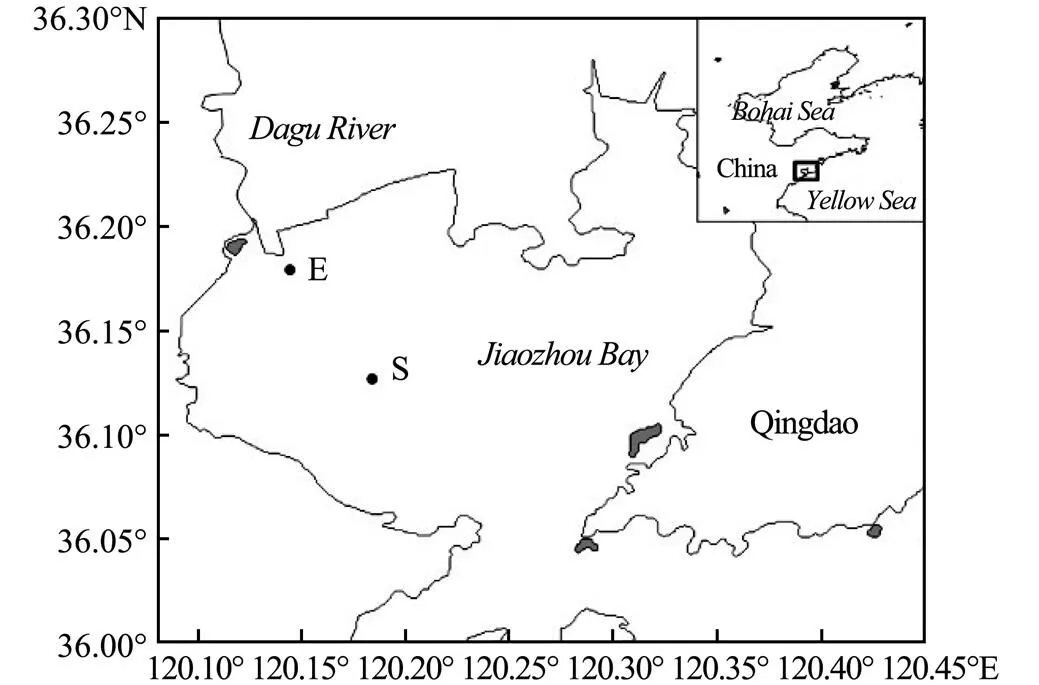
Fig.1 The sampling stations in Dagu RiverEstuary and Jiaozhou Bay.
2.2 Experiment Setup
2.2.1 Spiking of sediment with Phe
Crystalline Phe (L01921, Alfa Aesar, Lancaster, USA) was dissolved in acetone and uniformly sprayed onto dry sediment to produce sub-samples with Phe levels of 0 (Phe-free, with acetone only), 150, 300, 900, 2100, 4500, 15000 and 45000mgkg−1dry weight sediment. After careful mixing, each sediment subsample was left overnight in darkness to allow the solvent to evaporate.
2.2.2 Denitrification activity
Potential denitrification activity (PDA) was measured using the acetylene (C2H2) inhibition technique according to Sørensen (1978). 0.5g of each sub-sample was mixed with 15g wet sediment and 15mL filtered water from corresponding station in 50mL serum bottle. Then it was shaken thoroughly, generating final Phe levels of 0 (non- spiked control), 5, 10, 30, 70, 150, 500 and 1500mgkg−1wet sediment. The incubation water was amended with 20 mmolL−1KNO3and 22mmolL−1glucose. The serum bottle was hermetically sealed with a butyl stopper and aluminum crimp, then purged with N2for 15min to remove O2. Each of the three replicates with different concentrations of Phe was divided into two subsamples to be incubated with and without C2H2(20% v/v). Glucose and nitrate were added so that C and N would not limit denitrification; thus, our measurements reflect the potential rates of the processes under the particular conditions. All serum bottles were shocked at 80rmin−1 in the dark for 24h at a constant temperature (25℃). After 24h, 12mL of gas was collected from each serum bottle and injected into an evacuated serum vial (18mL) for later analysis of N2O. Then the bottles were shaken to make the samples homogenized, and 5mL sediment slurries were sampled in 10mL sterilized centrifuge tube for DNA extraction. Meanwhile, 5mL sediment slurries were added 0.2mL of 1gL−1HgCl and collected in 10mL sterilized centrifuge tube. Then these samples were centrifuged with 0.22μm filter to measure of NO3−and NO2−. 2g wet sediment was transferred to 10mL sterilized centrifuge tube containing 5mL of saline solution (0.22μm filtered, 9gL−1NaCl, 200μL of 0.22μm filtered, 12.5% v/v Tween 80) and fixed with 100μL of formaldehyde (0.22μm filtered, 4% v/v) for total cell count by flow cytometry.
2.3 Total Bacterial Count
The above subsamples of slurries for total bacterial count were stirred at 150rmin−1for 15min, followed by sonication for 30s at a low intensity (0.5 cycle, 20% amplitude). Then the bacterial cells in the cleaned suspensions were stained with SYBR Green I in anhydrous dimethylsulfoxide (DMSO) at a final concentration of 0.1 μmolL−1and incubated in the dark for 15min at room temperature (Foladori. 2010; Collado., 2017). The samples were then diluted 1:10 or 1:100 with saline solution (0.22μm filtered, 9gL−1NaCl, 200μL of 0.22μm filtered) so that the cell concentration did not exceed 106cellsmL−1.
Samples were analyzed with a BD Accuri C6 flow cytometer (Becton, Dickinson and Company,) equipped with a-laser emitting light at 488nm. Green and red fluorescence were measured at 530±20nm (FL1 channel) and 630nm (FL3 channel). Counts were recorded as logarithmic signals and were triggered on the green fluorescence channel (FL1). Data were processed with BD Accuri C6 Plus software (Becton, Dickinson and Company), using electronic gating to separate the desired events. Presentation of the data as FL1/FL3 dot plots allowed for optimal distinction between stained intact microbial cells and instrument noise or sample background (Hammes and Egli, 2005).
2.4 Nucleic Acid Extraction and QuantitativeReal-Time Polymerase Chain Reaction
The genomic DNA was extracted from 1g wet weight of sediment using a Fast DNA SPIN kit for soil (SK8233, Sangon Biotech Co., Ltd.) according to the manufacturer’s instructions. The DNA solution was stored at-80℃ for real-time quantitative polymerase chain reaction (RT-qPCR).
Quantification of,andgenes was performed on a Roche LightCycler 480 using the previously described primer sets (Table 1). The 25μL reaction mixtures contained 10μL of SYBR Green Fast qPCR Master Mix (Roche, Switzerland), 0.4μL of each 20mmolL−1primer, 7.2μL ddH20, and 2μL of template DNA. Thermal cycling conditions for,andgenes were as follows: pre-incubation at 95℃ for 3min, 45 cycles consisting of denaturation at 94℃ for 7s, annealing at 57℃ for 10s, extension at 72℃ for 30s, followed by melting curve analysis at 60-95℃ with a heating rate of 0.11℃s−1and a continuous fluorescence measurement) and finally a cooling step to 40℃. The measurement of gene expression was performed by RT-qPCR in triplicate, and the mean of all these values was used for final analysis. The relative abundance of gene was analyzed by 2−ΔΔCTmethod (Livak and Schmittgen, 2001). All qPCR reactions including unknown samples were performed in triplicate and no template control (NTC) treatments were included in all runs.
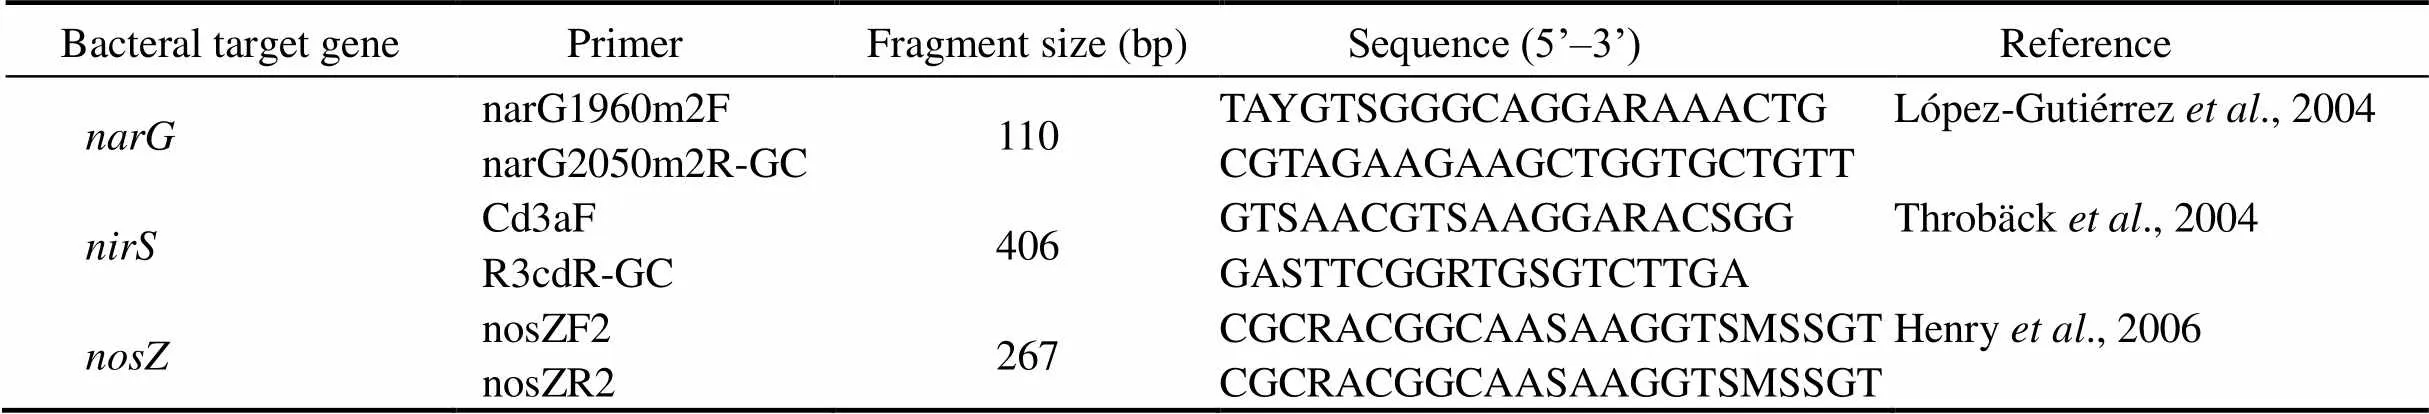
Table 1 Oligonucleotide probes used for PCR amplification and sequencing of denitrifying genes (narG, nirS and nosZ) in this study
2.5 Sample and Data Analyses
Salinity of water samples was measured in situ using a conductivity/temperature/depth sensor (CTD) SeaBird 911. pH was measured with a pH meter (Model 290A, Thermo Fisher Scientific Inc., Beverly, USA). Redox potential (Eh) was measured in situ using portable acidity meter (JENCOYC6010, USA). Organic matter (OM) was measured by calculating the percentage of weight loss (Heiri., 2001).Total nitrogen (TN) was analyzed in a CHN elemental analyzer (CE-440, USA). The dissolved inorganic N (DIN: NO3−, NO2−, NH4+) concentration in the seawater was quantified using a nutrient analyzer QuAAtro (Seal Analytical). The grain sizes were measured using a Mastersizer 2000 Laser Size Analyzer (Malvern Co., UK). Water (H2O) percentage (%) of sediment was measured by calculating the weight loss after drying sediment samples to 105℃ for 6h.
N2O was quantified using a gas chromatograph (Shimadzu GC-14B, Japan) equipped with an electron-capture detector. N2O was quantified using daily standard curves generated from certified gas standards, and the detection limit of the method was approximately 20nmolL−1N2O. Ecotoxicity of Phe was described by EC50(concentration of Phe in sediment causing 50% inhibition of PDA). EC50was expressed in milligrams of Phe per kilogram of wet sediment. EC50values were calculated on the basis of the best-fit linear regression models assessing the concentration-effect relationship. N2O accumulation was calculated by N2O produced without acetylene. N2O reduction (N2produced) via denitrification was calculated as the difference between the N2O produced with and without acetylene. (Joye., 1996).NO3−reduction rate was calculated by the difference between concentrations of N compounds measured at0and24h. NO2−reduction rate was calculated by the difference between NO3−reduction and NO2−residues after 24h. Inhibition rate (%) was calculated using the following equation:

whereRmeans the value of control treatment,Rmeans the value of Phe treatment. The N2O reduction ratio was calculated using the equation:
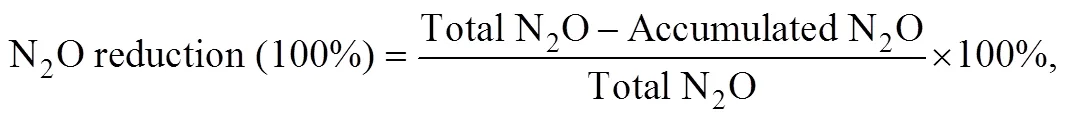
where total N2O means PDA, and accumulation N2O was calculated by N2O produced without acetylene.
Samples were analyzed in triplicate for all relevant parameters. The mean and standard deviation values were calculated for each treatment.Student’s-test was used to determine the statistical significance of environmental factors of two stations. To compare the means of each parameter among treatments, differences were analyzed by parametric one-way ANOVA and significant variations were analyzed by spearman correlation by using SPSS 19.0 software.
3 Results
3.1 Water and Sediment Characteristics
Physical and chemical characteristics of collected water and sediment were listed in Table 2, exhibiting substantial variability between two stations. Sediments collected from DRE exhibited coarser grain size, whereas those from JZB contained 58.7% of total particles less than 0.063mm. In fact, salinity, pH, DIN (NO3−-N, NO2−- N and NH4+-N), OM and total bacteria count of JZB were higher than those of DGR; on the contrary, Eh, TN and water content were lower.Moreover, salinity, DIN, Eh, TN and OM contents and silt and clay percentages were significantly (Student’stest,<0.05) different between two stations.
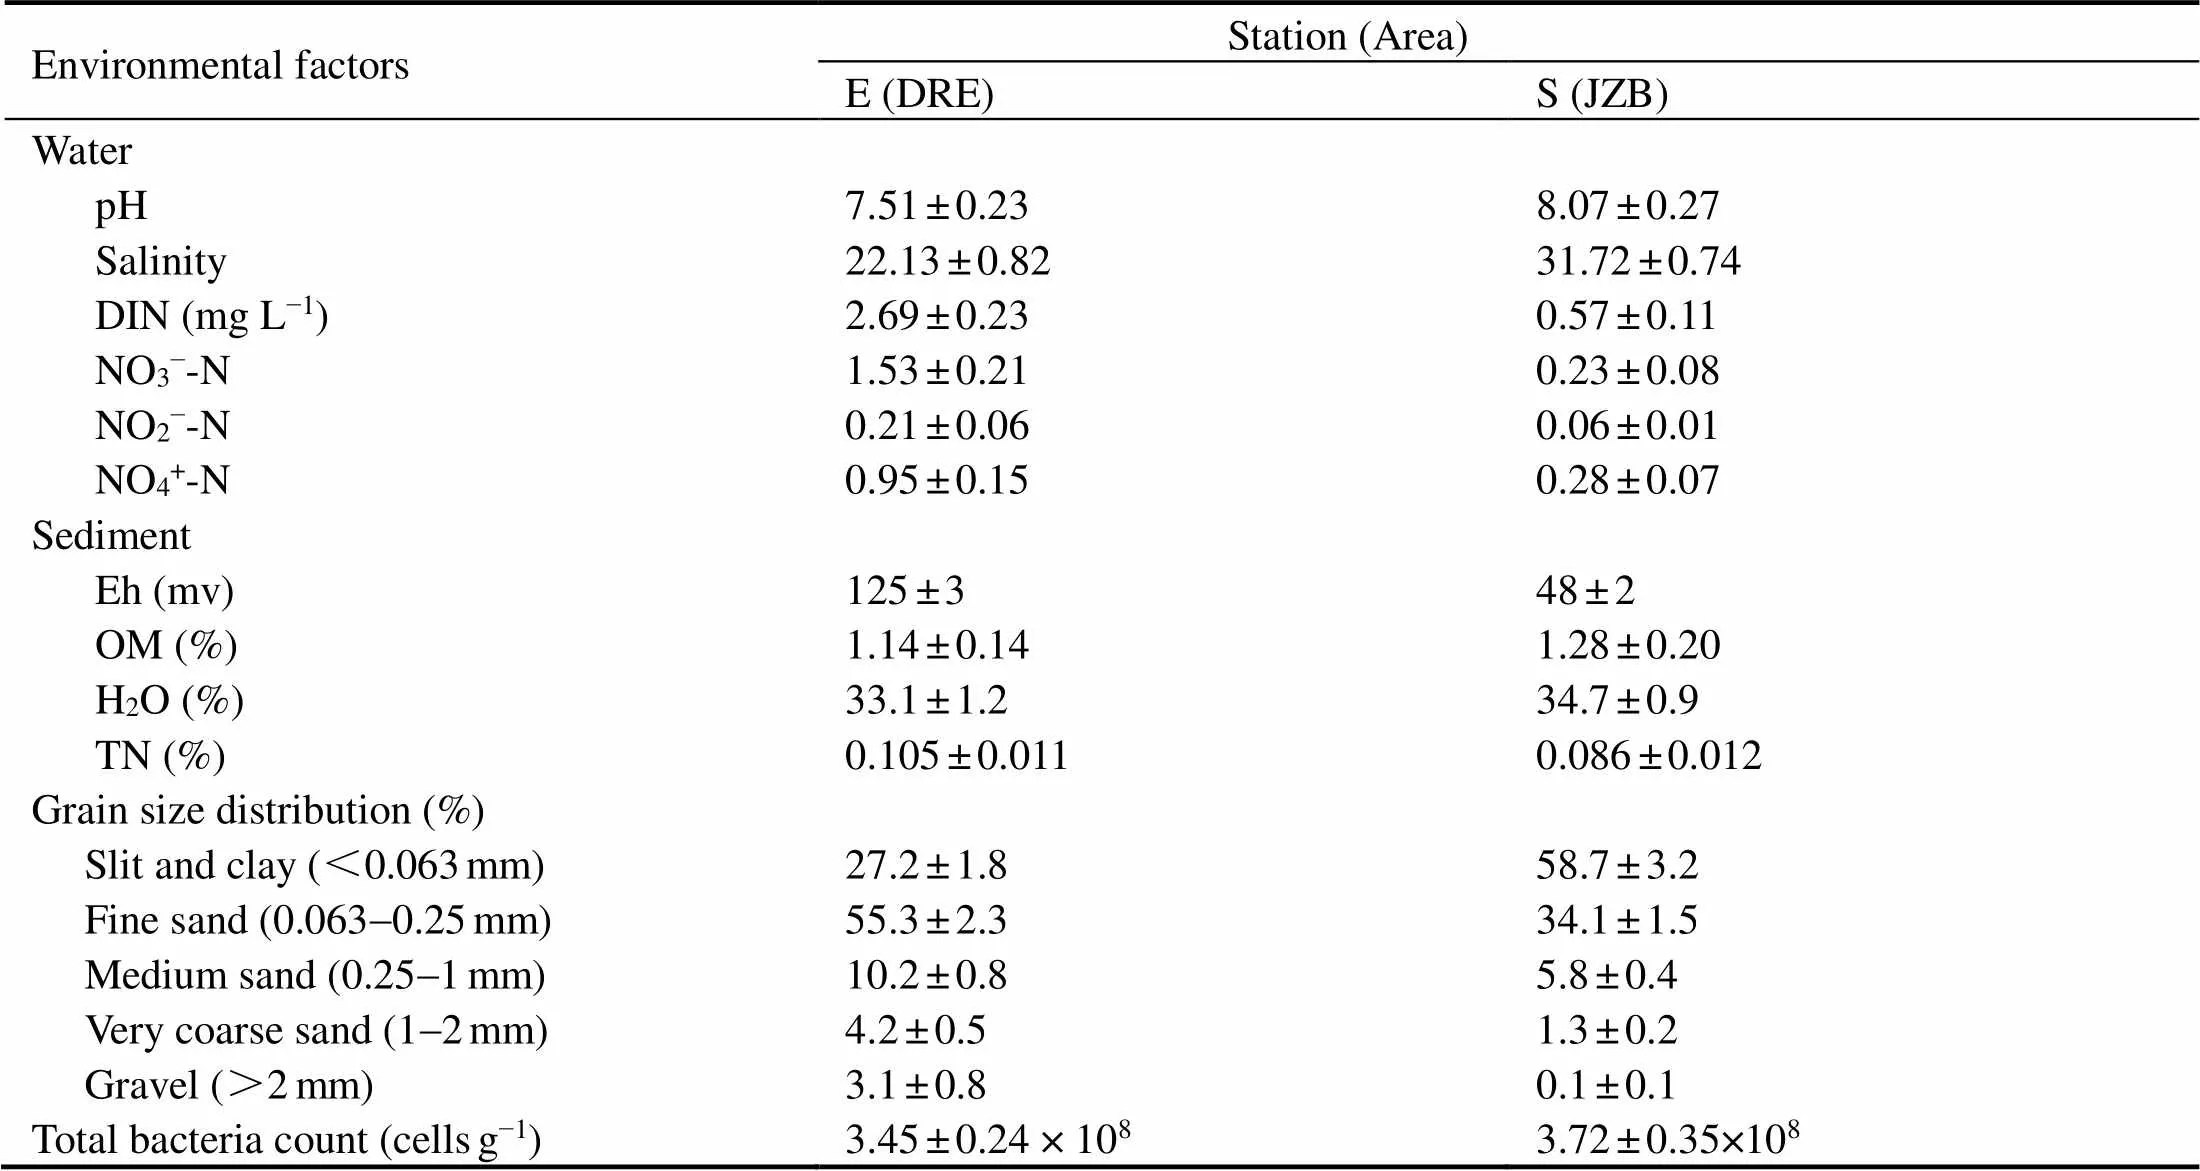
Table 2 Physical and chemical characteristics of water and sediment from the two stations
Notes: DIN, Dissolved nitrogen; Eh, Redox potential; OM, Organic matter; H2O, Water percentage.
3.2 Denitrification Activity
3.2.1 Potential denitrification activity
ThePDA was expressed in terms of N2O concentration in the serum bottle headspace from two study areas (Fig.2). PDA in control treatments of DRE and JZB was both the highest (DRE: 0.453mgNkg−1h−1; JZB: 0.592 mgNkg−1h−1) among all treatments, and lowest at Phe concentrations of 1500mgkg−1(DRE: 0.069mgNkg−1h−1; JZB: 0.114mgNkg−1h−1). The range, of inhibition rate of DRE and JZB were 5.74-84.66% and 3.20-80.75% respectively. Moreover, the PDA of both areas decreased with an increase of Phe concentration and significantly negatively correlated with the concentration of Phe (DRE:= −0.985,<0.001; JZB:=−0.988,<0.001). In addition, PDA of JZB was generally higher than that of DRE. The PDA in experimental treatments at 5mgkg−1Phe concentrationsof DRE had no significant difference compared with control treatment, and it had significant difference (ANOVA,<0.05) at Phe concentrations above 10mgkg−1sediment. By contrast, the PDA in experimental treatments at Phe concentrations at 5 and 10 mgkg−1Phe concentrationsof JZB did not show significant difference compared with control treatment, and a statistically significant difference (ANOVA,<0.05) was noted at Phe concentrations above 30mgkg−1. The mean EC50values of Phe for PDA of DRE and JZB were 44.66 mgkg−1(2= 0.99,<0.0001) and 61.19 (2= 0.99,<0.0001), respectively.
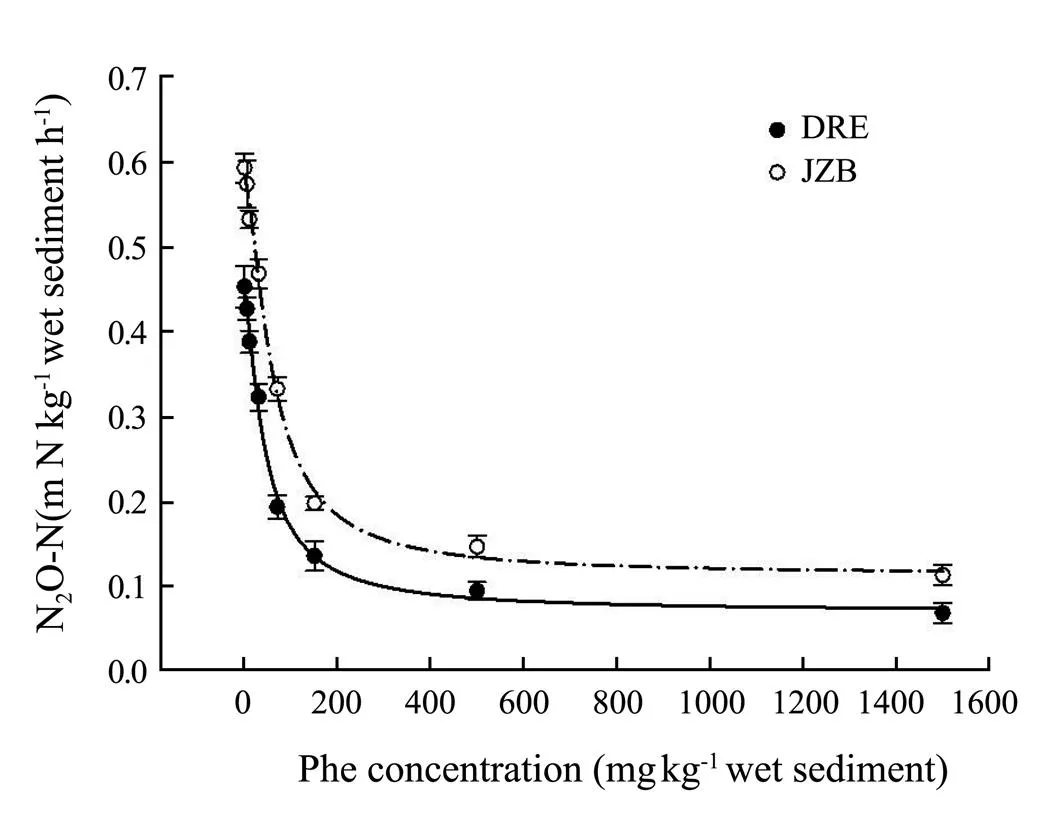
Fig.2 Potential denitrification activity (PDA, presented as mgNkg−1 sedimenth−1) under different phenanthrene concentrations in Dagu River Estuary and Jiaozhou Bay. Note: Bars represent standard deviation. The fitting curve and the mean EC50 value were obtained by applying ‘Four Parameter Logistic Curve’ (y=min+(max−min) / (1+(x / EC50) Hillslope) to the relation of phenanthrene concentration and PDA.
3.2.2 Nitrate and nitrite reduction
The NO3−and NO2−reduction rates of both study areas showed a decrease with an increase of Phe concentration (Fig.3), and it was significantly negatively correlated with the concentration of Phe (DRE:= −0.972,< 0.001,= −0.985,< 0.001; JZB:=−0.983,< 0.001,= −0.988,< 0.001). Moreover,the NO3−and NO2−reduction rates of all experimental treatments of both areas had significant difference (ANOVA,<0.05) compared with control treatment. Furthermore, NO3−reduction rate of both areas was highest in the control treatments, and lowest in the 1500mgPhekg−1treatments (DRE: 7.439 and 4.486 mgNkg−1h−1; JZB: 8.470 and 5.527mgNkg−1h−1) which was inhibited by 39.69 and 34.74% of control treatments. NO2−reduction rate was also highest and lowest in the control and 1500mgPhekg−1treatments (DRE: 3.222 and 1.563mgNkg−1h−1; JZB: 3.793 and 2.200mgNkg−1h−1). The addition of highest Phe concentration inhibited NO2−reduction rate by 51.48 and 42.01% of the control treatments of DRE and JZB. Besides, NO3−and NO2−reduction rates of DRE were generally lower than that of JZB (ANOVA,<0 .05).
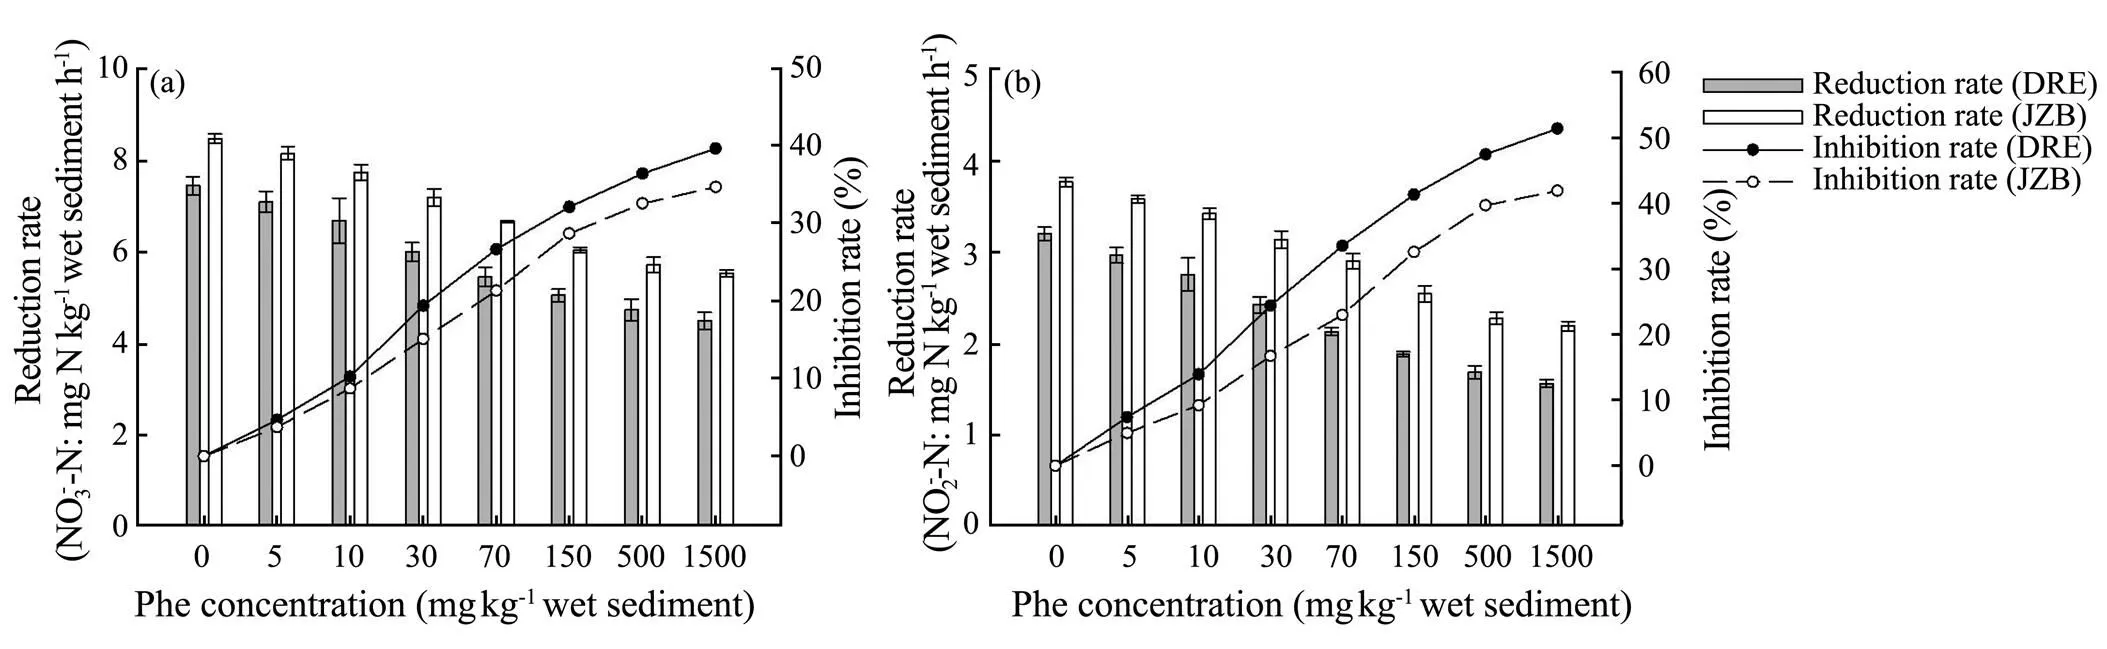
Fig.3 Effect of phenanthrene on NO3− (a), NO2− reduction (b) and inhibition rates in Dagu River Estuary and Jiaozhou Bay.
3.2.3 N2O accumulation and reduction
N2O accumulation rate in control treatment of DRE and JZB was both the lowest (DRE: 0.025mgNkg−1h−1; JZB: 0.038mgNkg−1h−1) (Fig.4). The overall trend of N2O accumulation rate of the both areas was increased firstly and then decreased with an increase of Phe concentrations (Fig.4a). Moreover, The N2O accumulation of experimental treatments of both areas had significant difference (ANOVA,<0.05) compared with control treatments. Furthermore, the N2O accumulation rate of DRE and JZB was 2.03-5.38 and 1.63-4.99 folds of control treatments (Fig.4), and the highest value appeared at the 30 and 70mgPhekg−1(DRE: 0.137mgNkg−1h−1; JZB: 0.188mgNkg−1h−1) respectively, which means the N2O accumulation of DRE was more affected by Phe than JZB (ANOVA,< 0 .05).
The trend of N2O reduction ratedecreased with an increase of Phe concentration(Fig.5).N2O reduction was significantly negatively correlated with Phe (DRE:= −0.983,<0.001; JZB:=−0.968,<0.001). Moreover, the N2O reduction rate of experimental treatments of both areas had significant difference (ANOVA,<0.05) com- pared with control treatment at Phe concentrations above 5mgkg−1. Furthermore, concentrations of Phe above 10 mgkg−1were much more sensitive to inhibited N2O reduction as the decreasing trend turned to be sharp. N2O reduction rate in control treatments was both the highest (DRE: 0.427mgNkg−1h−1; JZB: 0.555mgNkg−1h−1), and the reduction ratio was 94.38% and 93.64% respectively. The N2O reduction ratio of DRE and JZB was both the lowest at 1500mgPhekg−1(DRE: 13.74%; JZB: 21.16%). Besides, N2O accumulation and reduction rates of JZB were higher than that of DRE in all treatments (ANOVA,< 0.05) (Figs.4, 5).
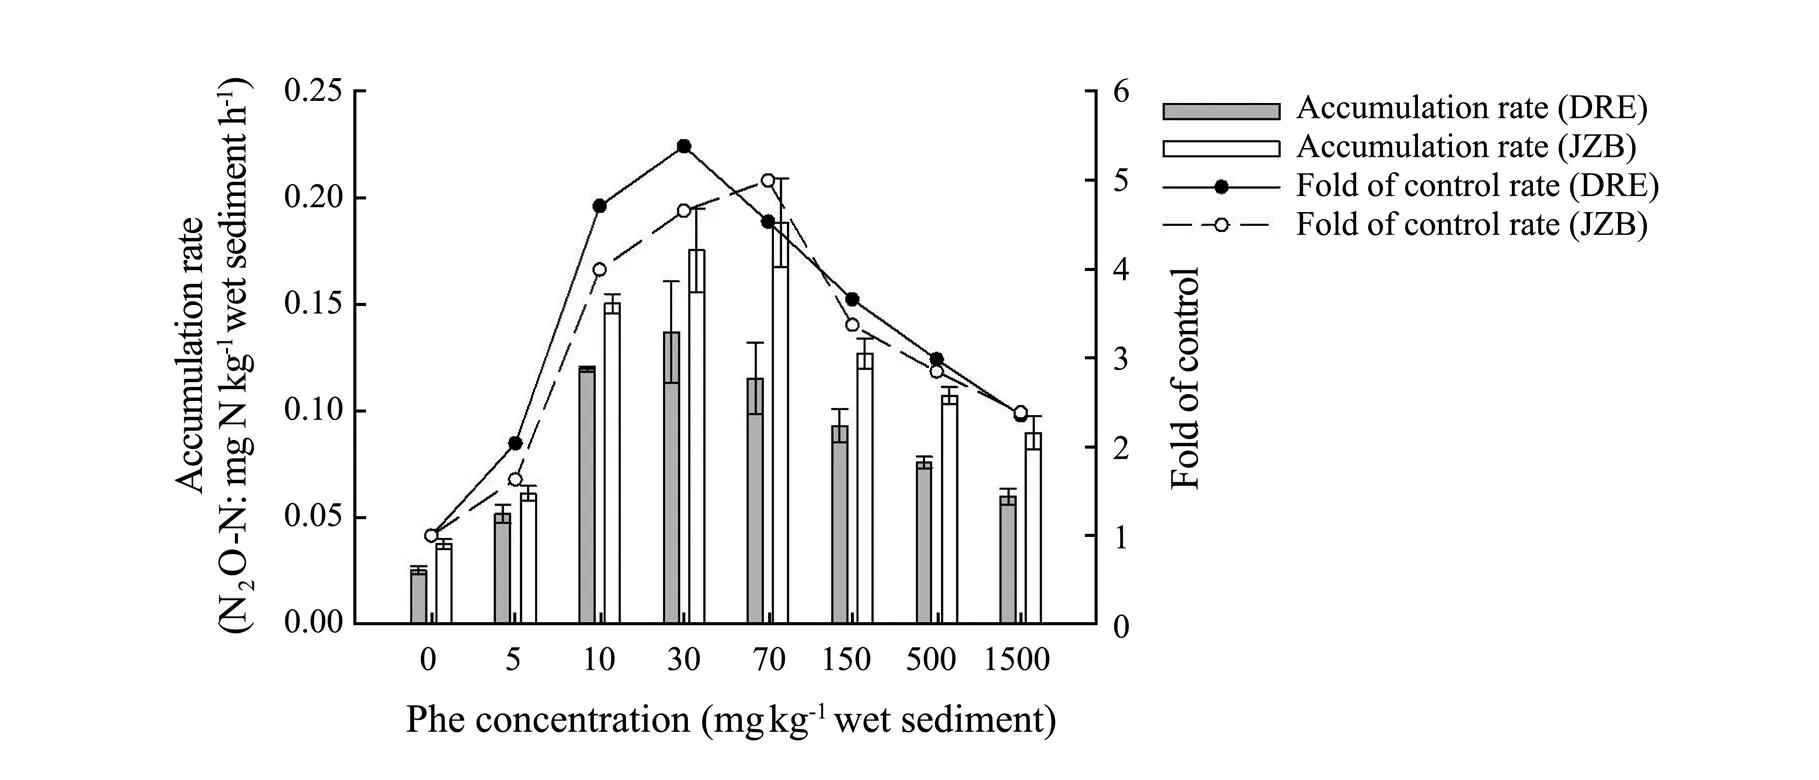
Fig.4 N2O accumulation rate and fold of control in different phenanthrene concentration treatments in Dagu River Estuary and Jiaozhou Bay.
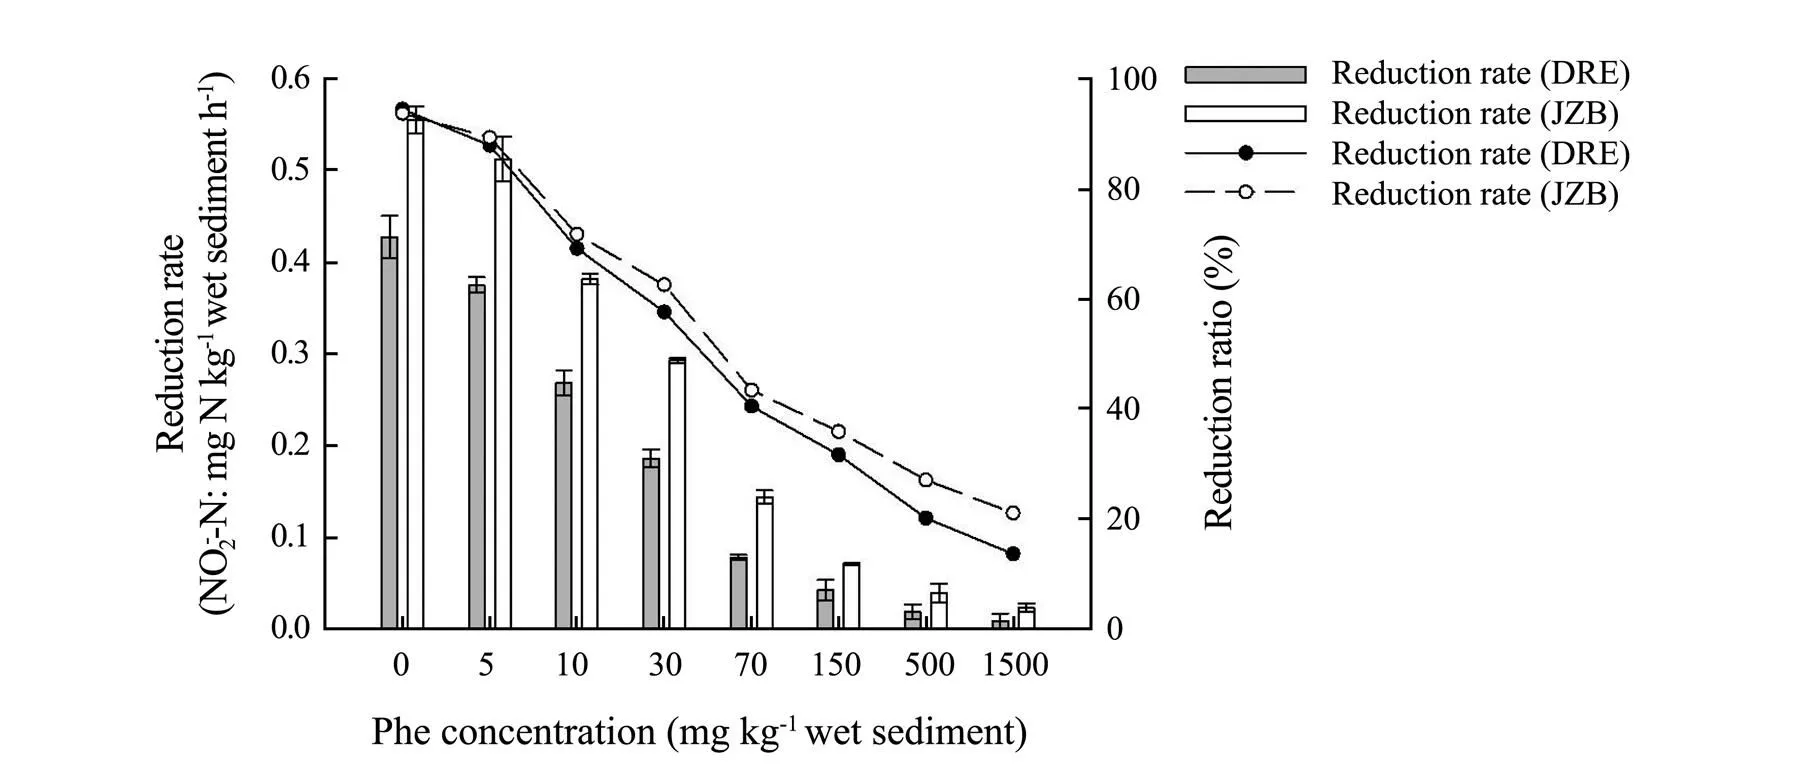
Fig.5 N2O reduction rate and ratio in different phenanthrene concentration treatments in Dagu River Estuary and Jiaozhou Bay.
3.3 Total Bacterial Count and Relative Abundance of narG, nirS and nosZ Genes
The overall trend of total bacterial count of both areas showed increase firstly and then decrease gentlywith an increase of Phe concentration (Fig.6). The results also revealed a slightly increasing in the total bacteria counts among the control and the first three Phe concentration treatments (5, 10 and 30mgPhekg−1sediment) in DRE and the first four Phe concentration treatments (5, 10, 30 and 70mgPhekg−1sediment) in JZB. The total bacteria counts of DRE and JZB were the highest at 10 and 30mgPhekg−1sediment (DRE: 6.16×10⁸cellsg−1; JZB: 6.84 ×10⁸cellsg−1), and they were 1.17 and 1.21 times larger than the control treatments respectively. Furthermore, total bacteria count of DRE and JZB was the lowest at 1500mgPhekg−1(DRE: 3.87×10⁸cellsg−1; JZB: 4.36× 10⁸cellsg−1), indicating a toxicity effect, and the inhibition rates were 26.43 and 22.89% respectively.Total bacterial count of DRE was more inhibited compared with JZB (ANOVA,<0 .05).
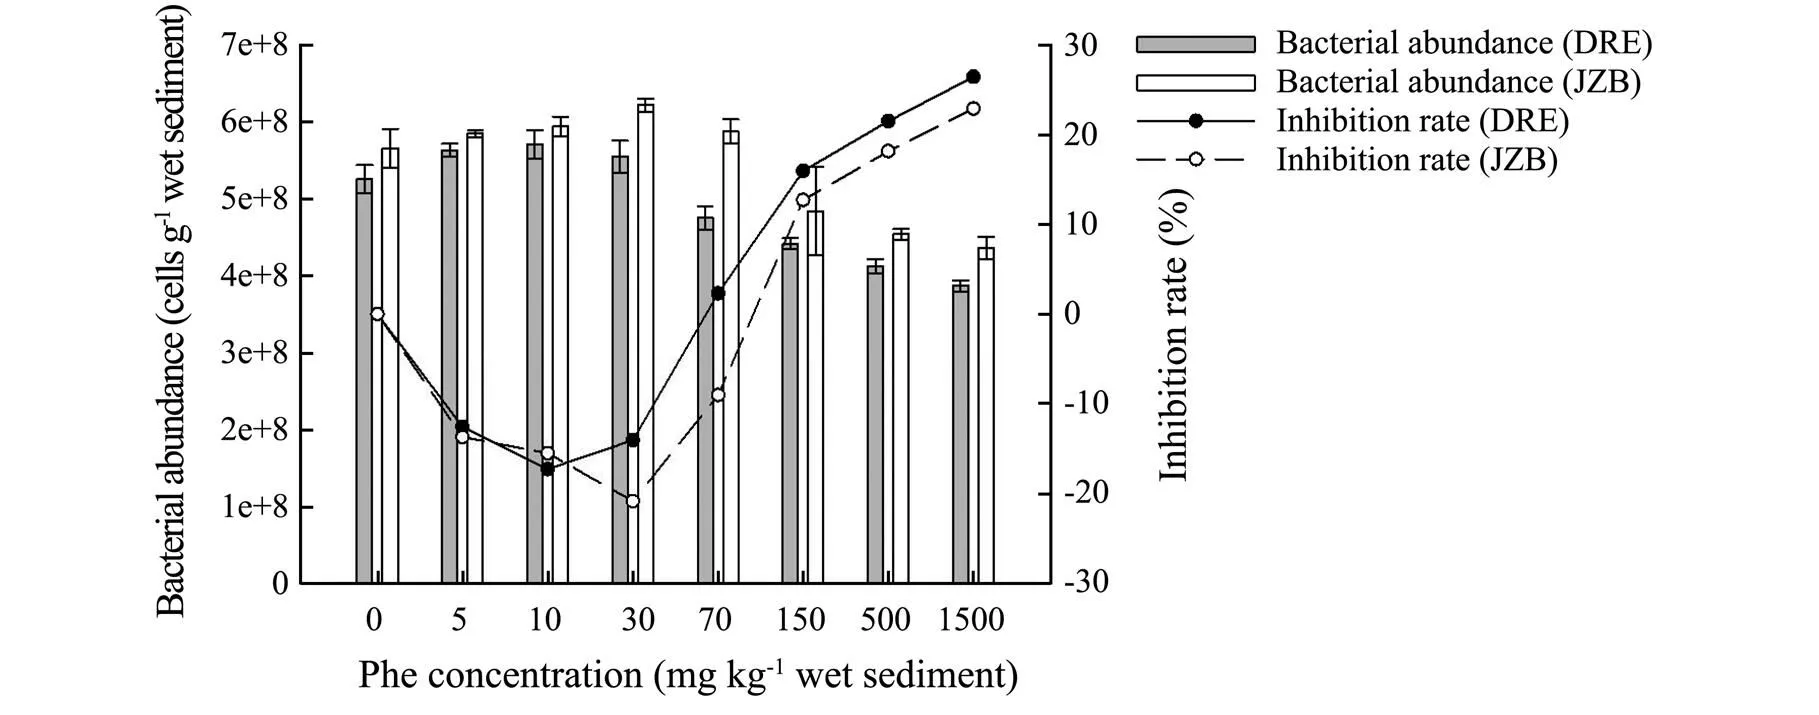
Fig.6 Effect of phenanthrene on total bacterial count and inhibition rate in Dagu River Estuary and Jiaozhou Bay.
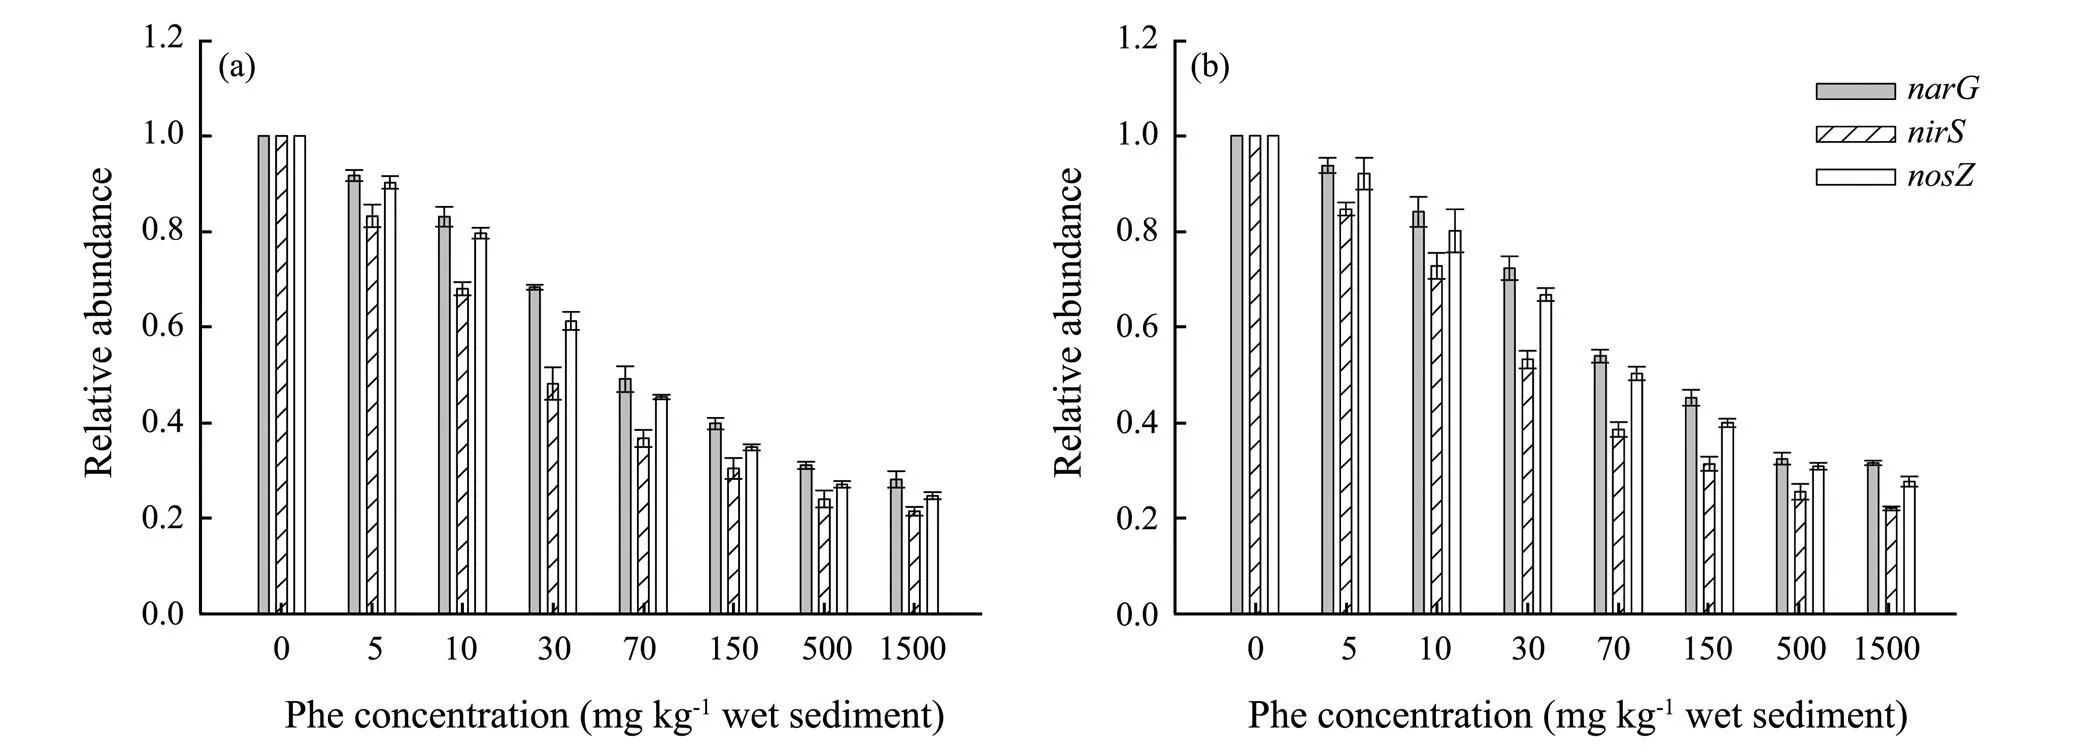
Fig.7 The relative abundance of narG, nirS and nosZ genes in treatments with different phenanthrene concentrations in Dagu River Estuary (a) and Jiaozhou Bay (b).
The relative abundance of,andgenes in response to Phe concentrations in DGE and JZB are shown in Fig.7. It showed that the relative abundance of the three genes generally decreased with the increase of Phe concentrations, besidesandgenes were more tolerant thangene. Moreover, the relative abundance of,andgenes of DGE and JZB was all the lowest at 1500mgPhekg−1sediment (DRE: 0.28, 0.21 and 0.25; JZB: 0.32, 0.22 and 0.29,respectively). The EC50values of Phe for relative abundance of,andgenes were 35.23, 15.38 and 28.87 mg kg−1in DRE, and 42.07, 19.63 and 34.35mg kg−1(2> 0.97,<0.0001, figures not shown) in JZB, respectively. That means EC50values of Phe for relative abundance of,andgenes were lower than that of Phe for PDA (ANOVA,<0.05), and the EC50values ofgenewas the highest, followed bygene, thengene.
3.4 Correlations Between Microbial Abundance and Denitrification
Clear correlation was observed between total bacterial count, relative abundance of denitrifying genes and denitrification for both areas (Table 3). Total bacterial count was positively correlated with PDA, N2O, NO3−and NO2−reduction rates (<0.01) for both areas; in contrast, relative abundance of,andgenes was all strongly positively correlated (<0.001), and the correlation coefficients were higher. In addition, the three denitrifying genes were strongly positively correlated between each other (<0.01). It is possible that the deni-trifying genes were more sensitive to Phe than total bacterial count, which means Phe has specific effects on denitrifiers.
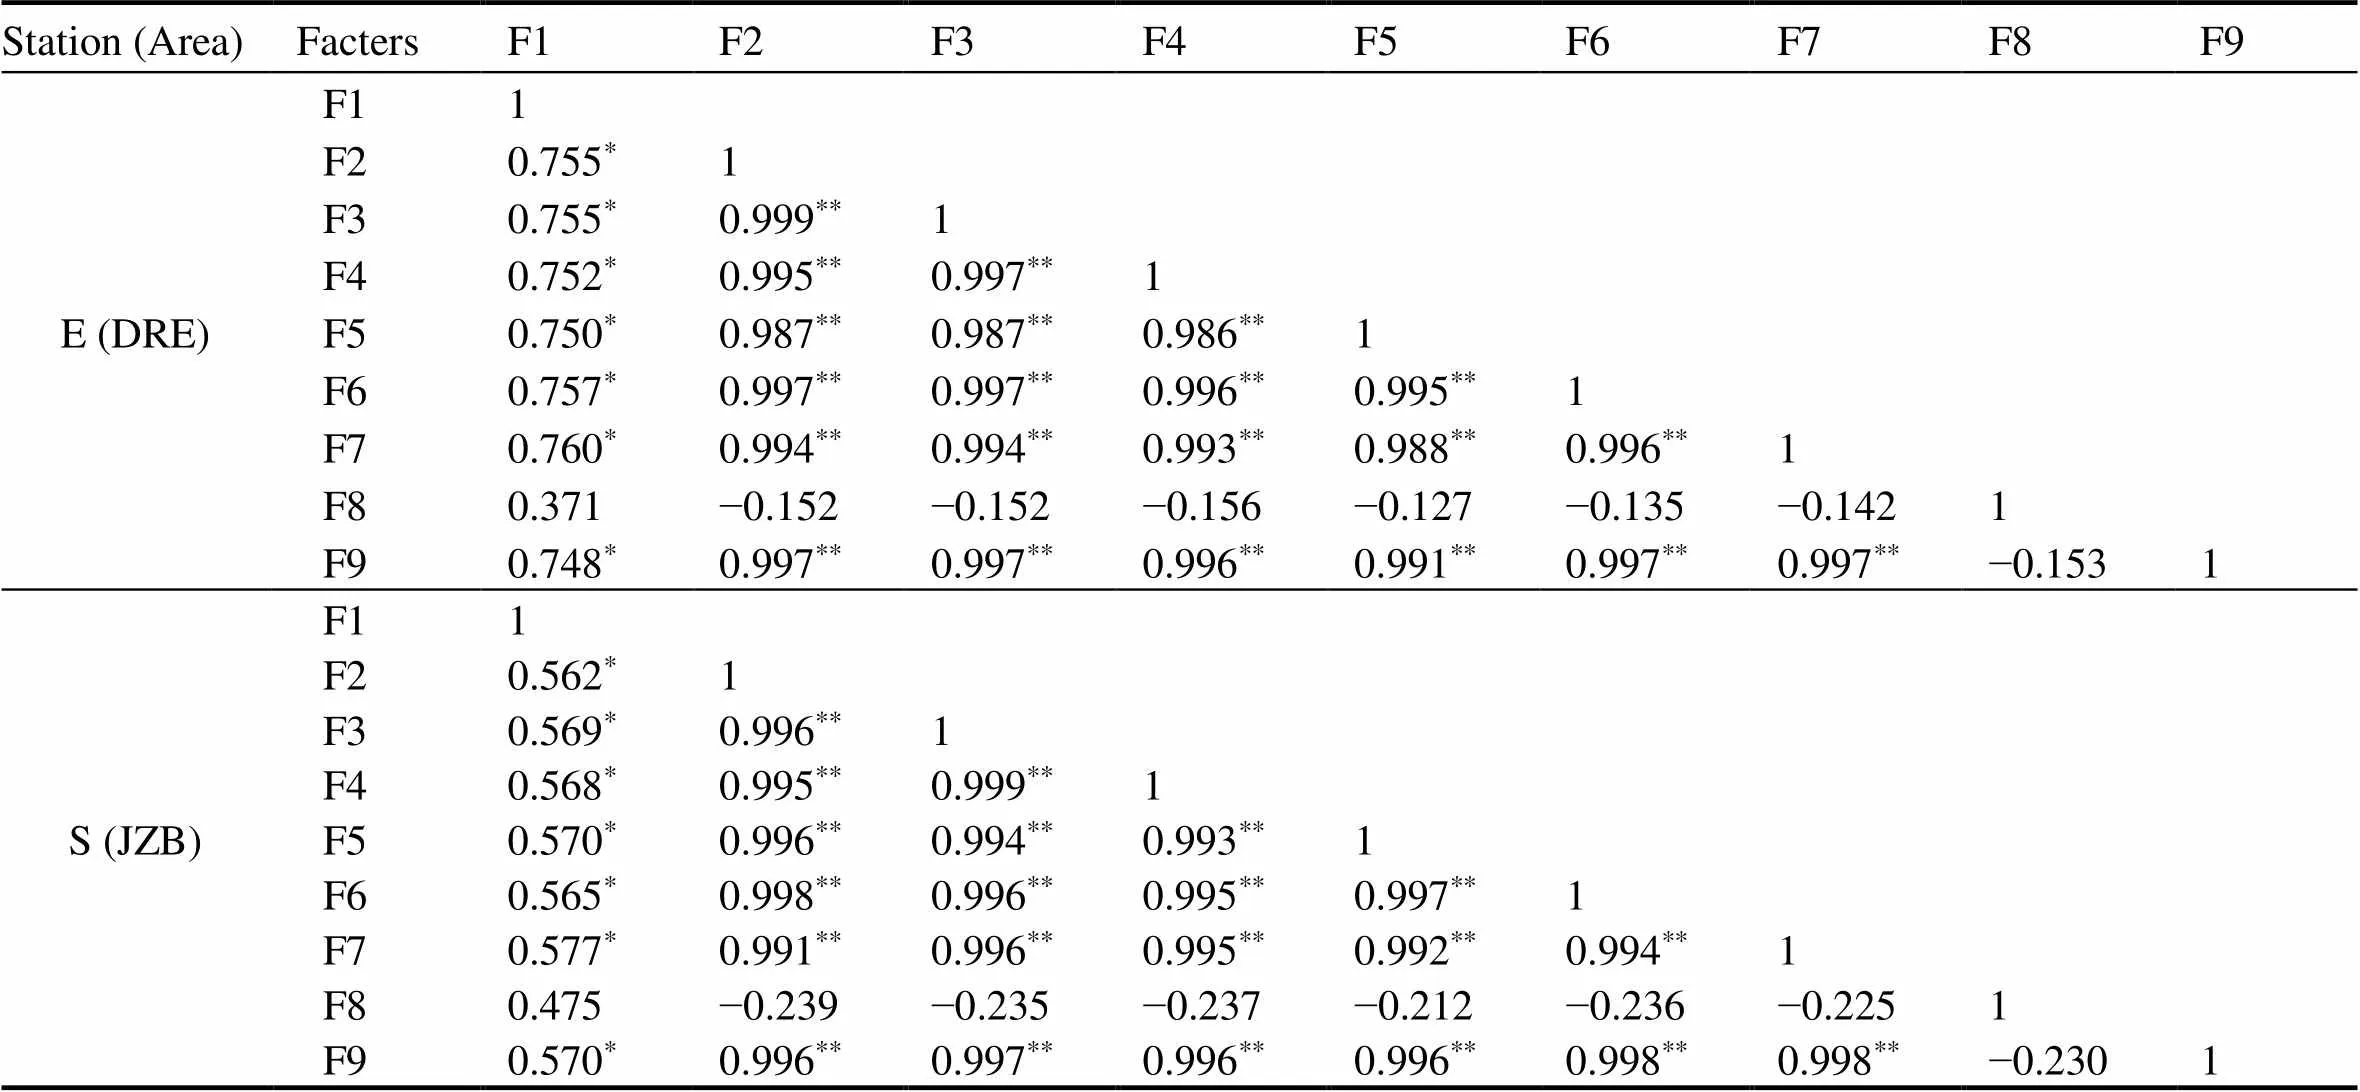
Table 3 Correlations between total bacterial count, relative abundance of denitrifying genes (narG, nirS and nosZ) and denitrification in Dagu River Estuary and Jiaozhou Bay (Spearman correlation)
Notes: *Correlation is significant at the 0.01 level (2-tailed); **Correlation is strongly significant at the 0.001 level (2-tailed). F1, total bacterial count; F2,relative abundance of; F3, relative abundance of; F4, relative abundance of; F5, NO3−reduction; F6, NO2−reduction; F7, PDA; F8, N2O accumulation; F9, N2O reduction.
4 Discussion
4.1 Effect of Phenanthrene on the Denitrification Activity
The results demonstrated that the PDA, NO3−and NO2−reduction rates can be inhibited by experimental range of Phe concentrations for both areas (Figs.2, 3). The decline in the PDA with increasing concentrations of PAHs has also been observed previously (Guo., 2011). Guo. (2011) also found that the mean EC50value of pyrene for PDA was 59.7mgkg−1, which was in the same order of magnitude compared to this study. The N2O accumulation rate of Phe treatments was all higher than that of the control treatments for both areas, and the overall trend showed increased firstly and then decreased with an increase of Phe concentrations (Fig.4a). Besides, the results showed the N2O reduction rate and ratio of both areas were decreased with an increasing of Phe concentrations. And the lower N2O reduction ratio could lead to the higher N2O accumulation (Devol, 2008; Guo., 2011). Some researchers confirmed that N2O reductase was inhibited more readily by Phe than NO reductase and the selective inhibition resulted in the accumulation of N2O (Holtan-Hartwig., 2002). Contreras-Ramos. (2009) found that pollution of soil with 500 mg Phe, 350 mg anthracene and 150mg benzopyrenekg−1soil could increase N2O emissions. Alburquerque. (2015) demonstrated that N2O emissions were increased with PAH addition for 4, 10 and 20mgkg−1dry soil. N2O accumulation rates decreasing with Phe concentrations exceeded 30 and 70mgkg−1for DRE and JZB respectively. There was a clear accumulation of N2O at Phe concentrations between 10 and 150mgkg−1for both areas (Fig.4), and the decreasing of N2O accumulation rate after the maximum value of two areas might attribute to the decline of PDA (Fig.2). However, the N2O reduction step was clearly inhibited with an increase of Phe concentrations (Fig.5). Low concentration of Phecould be used as carbon and energy source for bacterial growth. Some researchers have confirmed that PAHs biodegradation was coupled to nitrate reduction under denitrifying conditions, leading to an increase in N2O production. (Rockne and Strand, 2001; Lu., 2011; Yang., 2013). However, dramatically toxic effects on bacterial community and denitrifying genes were found under high concentration of PAHs (Guo., 2011; Sun., 2012; Zhang., 2014).
Activity measurements showed a clear differentiation of the different reduction steps of denitrification to Phe tolerance. The NO3−and NO2−reduction steps were more tolerant than the N2O reduction step. This gradient of tolerance to Phe by the enzymes of the denitrification pathway is in agreement with results for other POPs such as sulfamethazine (Hou., 2015) and dimethylsulfoniopropionate (DMSP) (Magalhães., 2012). In a word, this selective inhibition of the denitrification pathway about different steps may indirectly exacerbate the pollution of PAHs contamination. For instance, excessive accumulation of NO3−, NO2−and N2O in the sea and atmosphere could lead to eutrophication and the greenhouse effect.
4.2 Effect of Phenanthrene on Community Abun-dance Total Bacterial Count and Relative Abundance of Denitrifying Genes
This study showed that the total bacterial count of both areas increased firstly and then decreased with an increase of Phe concentration (Fig.6), which indicated that low concentration of Phe of both areas could promote bacterial growth. It is possible that some bacteria use the PAHs as carbon and energy sources in the initial growth phase, which leads to an increase in the number of bacteria (Wilson and Jones, 1993; Haritash and Kaushik, 2009). Functional genes that encode key enzymes, such as NO3−, NO2−, nitric oxide (NO), and N2O reductase in the denitrification pathway, have been exploited as molecular markers for qualitative and quantitative studies of denitrifiers in the environment. The reduction of soluble NO3−to NO2−is catalyzed by a membrane-bound (), which is encoded by thegene. The reduction of soluble NO2−to NO is catalyzed by a cyto-chrome cd1 NO2−reductase (encoded by). The last step of the denitrification pathway, the reduction of N2O to N2, is catalyzed by N2O reductase (encoded by the) which exists in the periplasm (Chon and Cho, 2015; Zeng., 2016). The relative abundance of the three denitrifying genes were all decreased with the increase of Phe concentrations (Fig.7), and the inhibition rate ofgene was the highest, followed bygene and thengene (ANOVA,< 0.05). It has been reported that the addition of heavy metals or POPs could decrease abundance of denitrifying genes (Magalhães., 2012; Liu., 2018). Moreover, the EC50values ofgenewas the highest, followed bygene, thengene. This result was similar to Guo. (2011), who found the EC50values of PAHs (pyrene) for copy numbers of,andgenes were 39.3, 17.7 and 31.5mgkg−1in agricultural soil. Furthermore, these results also demonstrated that denitrifiers harboring,orgene was more sensitive to Phe than PDA, and denitrifiers harboringgene was most sensitive to Phe among the three genes, followed bygene, thengene.
The inhibition rate of PDA of the highest Phe treatments compared with the control treatments in both areas was highest, followed by NO2−reduction and then NO3−reduction (ANOVA,<0.05). As,andgenes carry out NO3−reduction, NO2−reduction and nitrous oxide reduction processes respectively, and the step of NO2−reduction was former of N2O reduction. The lower inhibition rate ofgene may have negative effect on the step of N2O reduction, which may lead to high inhibition rate of PDA. Therefore, this study further demonstrated that microbial functions and abundance of denitrifying genes carrying out different denitrification processes were different in sensitivity to Phe contamination. PAHs amendment could not only reduce the activity of denitrifers and microbial respiration, but also have a different negative effect on the abundance and community structure of denitrifying genes (Guo., 2011; Yang., 2013; Zhou., 2017).Previous studies suggested that soil microorganisms could be considered as the best indicators of soil pollution, because they are not only in intimate contact with the soil environment but also might be responsive to contaminants and react rapidly to other disturbance of soil pollutants (Maliszewska- Kordybach., 2007).
This research clearly showed that the relative abundance of denitrifying genes (,and) were much more positively correlated with NO3−reduction, NO2−variation andPDA than total bacterial count (Table.3), and it is possible that the denitrifying genes were more sensitive to Phe than total bacterial count. which means Phe has specific effects on denitrifiers. Besides, this also may be related to short incubation time and stress response of the denitrifiers (Trautwein., 2008). These results are in agreement with previous studies (Guo., 2011; Wu., 2012). Guo. (2013) reported that there were positive correlations between PDA and abundance and the ratios of the,andgenes, and PAHs were identified as the major pollutants which explained 18.7%, 18.3%, and 37.6% of the variation in the abundance of the,, andgenes. These results are in agreement with previous studies (Guo., 2011; Wu., 2012). Some researchers found that that the denitrification enzyme activity was correlated with the abundance of,andgenes (Hallin., 2009; Chon and Cho, 2015), which means that denitrifiers harboring these functional genes played an important role in the denitrification process, and the abundance of the denitrifying genes could predict the corresponding process (Hallin., 2009).
4.3 Effects of Water and Sediment Physical and Chemical Characteristics
In this study, sediments with lower Eh and higher OM, silt and clay supported higher total bacteria count (Ribeiro., 2016). The results showed that PDA, N2O accumulation, N2O reduction, NO3−reduction, NO2−reduction and total bacterial count of JZB are general higher than that of DRE. This may be related to the lower Eh and higher total bacteria count, pH, OM, silt and clay of JZB, which were of more benefit to microbiological denitrification (Bodelier., 1996; Schläppy., 2010). Generally increasing oxygen, decreasing pH, decreasing carbon/nitrate ratio and absolute high concentration of nitrate may favor denitrification and accumulation of N2O (Shao., 2011). In this study, the influence of these factors on denitrification activity may not be as strong as salinity, Eh, OM, silt and clay. As clay minerals and OM content are the most influential factors on the absorption, sequestration, and bioavailability of PAHs and denitrification is carried out mostly by anaerobic and facultative microorganisms(Portet-Koltalo., 2013; Zhu., 2016). Which means the hypoxic environment of sediment of JZB can provide more favorable conditions for the growth of denitrifiers than DRE. Moreover, Increased salinity has been shown to increase C mineralization (Weston., 2011), which could in turn promote denitrification (Marton., 2012). Besides, the toxic effects on bacteria can be due to singlet oxygen, superoxide, free radicals, and many other active intermediates produced during the procession of excited state PAHs molecules react with environmental molecules (Yu, 2002; Yan., 2004). Unfortunately, determining the mechanisms of toxicity was beyond the scope of this study. As observed in this study, the toxicity of Phe on sediment organisms is dose-dependent and that observed toxicity depends on sediment physico-chemical characteristics (Wang., 2014; Ribeiro., 2016). Some researchers have found that OM and grain size of sediment can affect the nutrient supply, source of carbon substrate and the available surface area for microbial colonization, and then influence the activity and structure of microbial communities (Ribeiro., 2015). Particle size and OM can influence the surface area available for microbial colonization, the nutrient supply, and source of carbon substrate, which in turn influences the growth, size and structure of bacterial populations (Ribeiro., 2013; Ribeiro., 2015).
5 Conclusions
In this study, dose-response experiments were carried out to investigate the effects of phenanthrene (Phe) on the denitrification activity and denitrifying genes (,and) in sediments of DRE and JZB. The results showed that PDA, N2O reduction, NO3−reduction, NO2−reduction, total bacterial count, and the abundance of denitrifying genes were all inhibited in different degree for both areas. Besides, N2O accumulation rate was increased compared with control groups. The calculation of correlations showed that denitrifiers were more sensitive to Phe than other bacteria. Based on the inhibition rate, it could be concluded that the negative effect of Phe varied in the order: PDA>NO2−reduction rate>NO3−reduction rate, and for denitrifying genes it varied in the order:>>. The mean EC50values of Phe for relative abundance of denitrifying genes showed the same trend. These results were consistent for both sediments types evaluated in despite of their different physical and chemical characteristics. However, this study also found that anaerobic environment, high salinity, high OM and fine muddy textured of sediment may not only favor denitrification activity and denitrifiers, but be also less easy to be affected by Phe than the sediment with aerobic environment, low salinity, low OM and coarser textured.
Acknowledgements
This work was supported by the National Major Project of Water Pollution Control and Management Technology in China (No. 2013ZX07202-007).
Alburquerque, J. A., Sánchez-Monedero, M. A., Roig, A., and Cayuela, M. L., 2015. High concentrations of polycyclic aromatic hydrocarbons (naphthalene, phenanthrene and py- rene) failed to explain biochar’s capacity to reduce soil nitrous oxide emissions., 196 (196C): 72-77.
Bodelier, P., Libochant, J. A., Blom, C. W. P. M., and Laanbroek, H. J., 1996. Dynamics of nitrification and denitrification in root-oxygenated sediments and adaptation of ammonia-oxi- dizing bacteria to low-oxygen or anoxic habitats., 62 (11): 4100-4107.
Cao, Y., Green, P. G., and Holden, P. A., 2008. Microbial community composition and denitrifying enzyme activities in salt marsh sediments., 74 (24): 7585-7595.
Canfield, D. E., Glazer, A. N., and Falkowski, P. G., 2010. The evolution and future of Earth’s nitrogen cycle., 330 (6001): 192-196.
Cannarsa, S., Abete, M. C., Zanardi, M., and Squadrone, S., 2014. Polycyclic aromatic hydrocarbons (PAH) in marine se- diment of the northwestern Mediterranean Sea (Italy)., 20 (2): 137- 141.
Chon, K. M., and Cho, J. W., 2015. Abundance and expression of denitrifying genes (,,, and) in sediments of wastewater stabilizing constructed wetlands., 20 (1): 51-57.
Collado, S., Oulego, P., Alonso, S., and Díaz, M., 2017. Flow cytometric characterization of bacterial abundance and physiological status in a nitrifying-denitrifying activated sludge system treating landfill leachate., 24 (26): 21262-21271.
Contreras-Ramos, S. M., Alvarez-Bernal, D., Montes-Molina, J. A., Van Cleemput, O., and Dendooven, L., 2009. Emission of nitrous oxide from hydrocarbon contaminated soil amended with waste water sludge and earthworms., 41 (1): 69-76.
Foladori, P., Bruni, L., Tamburini, S., and Ziglio, G., 2010. Direct quantification of bacterial biomass in influent, effluent and activated sludge of wastewater treatment plants by using flow cytometry., 44 (13): 3807-3818.
Ghosal, D., Ghosh, S., Dutta, T. K., and Ahn, Y., 2016. Current state of knowledge in microbial degradation of polycyclic aromatic hydrocarbons (PAHs): A review., 7 (386): 1369.
Guo, G. X., Deng, H., Qiao, M., Mu, Y. J., and Zhu, Y. G., 2011. Effect of pyrene on denitrification activity and abundance and composition of denitrifying community in an agricultural soil., 159 (7): 1886-1895.
Guo, G. X., Deng, H., Qiao, M., Yao, H. Y., and Zhu, Y. G., 2013. Effect of long-term wastewater irrigation on potential denitrification and denitrifying communities in soils at the watershed scale., 47 (7): 3105-3113.
Hallin, S., Jones, C. M., Schloter, M., and Philippot, L., 2009. Relationship between N-cycling communities and ecosystem functioning in a 50-year-old fertilization experiment., 3 (5): 597.
Hammes, F. A., and Egli, T., 2005. New method for assimilable organic carbon determination using flow-cytometric enumeration and a natural microbial consortium as inoculum., 39 (9): 3289-3294.
Haritash, A. K., and Kaushik, C. P., 2009. Biodegradation aspects of polycyclic aromatic hydrocarbons (PAHs): A review., 169 (1-3): 1-15.
Henry, D., 2006.. Vol. 840. Springer, 1-44.
Heiri, O., Lotter, A. F., and Lemcke, G., 2001. Loss on ignition as a method for estimating organic and carbonate content in sediments: Reproducibility and comparability of results., 25 (1): 101-110.
Holtan-Hartwig, L., Dörsch, P., and Bakken, L. R., 2002. Low temperature control of soil denitrifying communities: Kinetics of N2O production and reduction., 34 (11): 1797-1806.
Hou, L., Yin, G., Liu, M., Zhou, J. L., Zheng, Y. L., Gao, J., Zong, H. B., Yang, Y., Gao, L., and Tong, C. F., 2015. Effects of sulfamethazine on denitrification and the associated N2O release in estuarine and coastal sediments., 49 (1): 326-333.
Liu, N., Yin, P., Zhu, Z. G., Liu, Q. J., Hou, G. H., Lin, X. H., Yan, D. Y., and Zhang, D. L., 2016. Distribution, sources and ecological risk assessment of PAHs in surface sediments from the Dagu River Estuary in Jiaozhou Bay, China., 35 (6): 831-837.
Liu, Y., Shen, K., Wu, Y., and Wang, G., 2018. Abundance and structure composition ofandgenes as well as denitrifying activity in heavy metal-polluted paddy soils., 35 (2): 100-107.
Livak, K. J., and Schmittgen, T. D., 2001. Analysis of relative gene expression data using real-time quantitative PCR and the 2−ΔΔCTmethod., 25 (4): 402-408.
López-Gutiérrez, J. C., Henry, S., Hallet, S., Martin-Laurent, F., Catroux, G., and Philippot, L., 2004. Quantification of a novel group of nitrate-reducing bacteria in the environment by real- time PCR., 57 (3): 399- 407.
Lu, X., Zhang, T., Fang, H. H. P., Leung, K. M., and Zhang, G., 2011. Biodegradation of naphthalene by enriched marine denitrifying bacteria., 65 (1): 204-211.
Magalhães, C., Kiene, R. P., Buchan, A., Machado, A., Teixeira, C., Wiebe, W. J., and Bordalo, A. A., 2012. A novel inhibitory interaction between dimethylsulfoniopropionate (DMSP) and the denitrification pathway., 107 (1-3): 393- 408.
Maliszewska-Kordybach, B., Klimkowicz-Pawlas, A., Smreczak, B., and Janusauskaite, D., 2007. Ecotoxic effect of phenanthrene on nitrifying bacteria in soils of different properties., 36 (6): 1635-1645.
Marton, J. M., Herbert, E. R., and Craft, C. B., 2012. Effects of salinity on denitrification and greenhouse gas production from laboratory-incubated tidal forest soils., 32 (2): 347-357.
McKenney, D. J., and Vriesacker, J. R., 1985. Effect of cadmium contamination on denitrification processes in Brookston clay and Fox sandy loam.,, 38 (3): 221-233.
Or, D., Smets, B. F., Wraith, J. M., Dechesne, A., and Friedman, S. P., 2007. Physical constraints affecting bacterial habitats and activity in unsaturated porous media–A review., 30 (6-7): 1505-1527.
Portet-Koltalo, F., Ammami, M. T., Benamar, A., Wang, H., Le Derf, F., and Duclairoir-Poc, C., 2013. Investigation of the release of PAHs from artificially contaminated sediments using cyclolipopeptidic biosurfactants., 261 (20): 593-601.
Ribeiro, H., Almeida, C. M. R., Mucha, A. P., Teixeira, C., and Bordalo, A. A., 2013. Influence of natural rhizosediments characteristics on hydrocarbons degradation potential of microorganisms associated to Juncus maritimus roots., 84 (6): 86-96.
Ribeiro, H., Almeida, C. M. R., Magalhães, C., Bordalo, A. A., and Mucha, A. P., 2015. Salt marsh sediment characteristics as key regulators on the efficiency of hydrocarbons bioremediation by Juncus maritimus rhizospheric bacterial community., 22 (1): 450-462.
Ribeiro, H., Mucha, A. P., Azevedo, I., Salgado, P., Teixeira, C., Almeida, C. M. R., Joye, S. B., and Magalhães, C., 2016. Differential effects of crude oil on denitrification and anammox, and the impact on N2O production., 216: 391-399.
Rockne, K. J., and Strand, S. E., 2001. Anaerobic biodegradation of naphthalene, phenanthrene, and biphenyl by a denitrifying enrichment culture., 35 (1): 291-299.
Schläppy, M. L., Schöttner, S. I., Lavik, G., Kuypers, M. M., de Beer, D., and Hoffmann, F., 2010. Evidence of nitrification and denitrification in high and low microbial abundance sponges., 157 (3): 593-602.
Seitzinger, S., Harrison, J. A., Böhlke, J. K., Bouwman, A. F., Lowrance, R., Peterson, B., Tobias, C., and Drecht, G. V., 2006. Denitrification across landscapes and waterscapes: A synthesis., 16 (6): 2064-2090.
Shao, M. F., Zhang, T., Fang, H. H. P., and Li, X., 2011. The effect of nitrate concentration on sulfide-driven autotrophic denitrification in marine sediment., 83 (1): 1-6.
Sun, F. L., Wang, Y. S., Sun, C. C., Peng, Y. L., and Deng, C., 2012. Effects of three different PAHs on nitrogen-fixing bacterial diversity in mangrove sediment., 21 (6): 1651-1660.
Sørensen, J., 1978. Denitrification rates in a marine sediment as measured by the acetylene inhibition technique., 36 (1): 139-143.
Throbäck, I. N., Enwall, K., Jarvis, Å., and Hallin, S., 2004. Reassessing PCR primers targeting,andgenes for community surveys of denitrifying bacteria with DGGE., 49 (3): 401-417.
Trautwein, K., Kühner, S., Wöhlbrand, L., Halder, T., Kuchta, K., Steinbüchel, A., and Rabus, R., 2008. Solvent stress response of the denitrifying bacterium ‘’ strain EbN1., 74 (8): 2267-2274.
Weston, N. B., Vile, M. A., Neubauer, S. C., and Velinsky, D. J., 2011. Accelerated microbial organic matter mineralization following salt-water intrusion into tidal freshwater marsh soils., 102 (1-3): 135-151.
Wang, L., Zheng, B., Nan, B., and Hu, P., 2014. Diversity of bacterial community and detection of- and- encoding denitrifying bacteria in sandy intertidal sediments along Laizhou Bay of Bohai Sea, China., 88 (1-2): 215-223.
Wilson, S. C., and Jones, K. C., 1993. Bioremediation of soil contaminated with polynuclear aromatic hydrocarbons (PAHs): A review., 81 (3): 229-249.
Wu, Y. Y., Wu, Q. H., Huang, S., Ye, J. X., Zhang, H. J., and Zhang, R. D., 2012. Effect of polycyclic aromatic hydrocarbons on the vertical distribution of denitrifying genes in river sediments., 33 (10): 3592-3597.
Wuebbles, D. J., 2009. Nitrous oxide: No laughing matter., 326 (5949): 56-57.
Xu, F., Qiu, L., Cao, Y., Huang, J., Liu, Z., Tian, X., Li, A. C., and Yin, X., 2016. Trace metals in the surface sediments of the intertidal Jiaozhou Bay, China: Sources and contamination assessment., 104 (1-2): 371- 378.
Yan, J., Wang, L., Fu, P. P., and Yu, H., 2004. Photomutagenicity of 16 polycyclic aromatic hydrocarbons from the US EPA priority pollutant list., 557 (1): 99-108.
Yang, X., Ye, J., Lyu, L., Wu, Q., and Zhang, R., 2013. Anaerobic biodegradation of pyrene byunder various nitrate/nitrite-reducing conditions., 224 (5): 1578.
Yu, H., 2002. Environmental carcinogenic polycyclic aromatic hydrocarbons: photochemistry and phototoxicity.,, 20 (2): 149-183.
Zeng, W., Zhang, J., Wang, A., and Peng, Y., 2016. Denitrifying phosphorus removal from municipal wastewater and dynamics of ‘’ and denitrifying bacteria based on genes of ppk1,,and., 207: 322-331.
Zhang, X. Z., Xie, J. J., and Sun, F. L., 2014. Effects of three polycyclic aromatic hydrocarbons on sediment bacterial com- munity., 68 (6): 756-762.
Zhang, Z., Lo, I. M. C., Zheng, G., Woon, K. S., and Rao, P., 2015. Effect of autotrophic denitrification on nitrate migration in sulfide-rich marine sediments., 15 (4): 1019-1028.
Zhu, J., Wang, Q., Yuan, M. D., Tan, G. Y. A., Sun, F. Q., Wang, C. X., Wu, W. X., and Lee, P. H., 2016. Microbiology and potential applications of aerobic methane oxidation coupled to denitrification (AME-D) process: A review., 90: 203-215.
Zhou, H. W., Wong, A. H. Y., Richard, M. K., Park, Y. D., Wong, Y. S., and Tam, N. F., 2009. Polycyclic aromatic hydrocarbon-induced structural shift of bacterial communities in mangrove sediment., 58 (1): 153-160.
Zhou, Z. F., Yao, Y. H., Wang, M. X., and Zuo, X. H., 2017. Co- effects of pyrene and nitrate on the activity and abundance of soil denitrifiers under anaerobic condition., 199 (8): 1091-1101.
September 25, 2018;
January 5, 2019;
June 18, 2019
© Ocean University of China, Science Press and Springer-Verlag GmbH Germany 2020
. E-mail: likr@ouc.edu.cn
(Edited by Ji Dechun)
 Journal of Ocean University of China2020年1期
- Journal of Ocean University of China的其它文章
- Screening and Characterization of Nitrite-Degrading Bacterial Isolates Using a Novel Culture Medium
- Purification and Characterization of a Novel Lipase from Antarctic Krill
- Quality Assessment of Frozen Solenocera crassicornis Treated with Sodium Metabisulphite by Soaking or Spraying
- Contribution of Mesoscale Eddies to the Subduction and Transport of North Pacific Eastern Subtropical Mode Water
- Semi-Empirical Algorithm for Wind Speed Retrieval from Gaofen-3 Quad-Polarization Strip Mode SAR Data
- An Effective Method of Prompting Juvenile Rainbow Trout (Oncorhynchus mykiss) to Cope with Heat Stress