Semi-Empirical Algorithm for Wind Speed Retrieval from Gaofen-3 Quad-Polarization Strip Mode SAR Data
ZHU Shuai, SHAO Weizeng, *, MARINO Armando, SUN Jian, and YUAN Xinzhe
Semi-Empirical Algorithm for Wind Speed Retrieval from Gaofen-3 Quad-Polarization Strip Mode SAR Data
ZHU Shuai1), SHAO Weizeng1), *, MARINO Armando2), SUN Jian3), and YUAN Xinzhe4)
1) Marine Science and Technology College, Zhejiang Ocean University, Zhoushan 316000, China 2) Natural Sciences, University of Stirling, Stirling FK9 4LA, UK 3) Physical Oceanography Laboratory, Ocean University of China, Qingdao 266100, China 4) Key Laboratory of Space Ocean Remote Sensing and Application, National Satellite Ocean Application Service, Beijing 100081, China
Synthetic aperture radar (SAR) is a suitable tool to obtain reliable wind retrievals with high spatial resolution. The geophysical model function (GMF), which is widely employed for wind speed retrieval from SAR data, describes the relationship between the SAR normalized radar cross-section (NRCS) at the copolarization channel (vertical-vertical and horizontal-horizontal) and a wind vector. SAR-measured NRCS at cross-polarization channels (horizontal-vertical and vertical-horizontal) correlates with wind speed. In this study, a semi-empirical algorithm is presented to retrieve wind speed from the noisy Chinese Gaofen-3 (GF-3) SAR data with noise-equivalent sigma zero correction using an empirical function. GF-3 SAR can acquire data in a quad-polarization strip mode, which includes cross-polarization channels. The semi-empirical algorithm is tuned using acquisitions collocated with winds from the European Center for Medium-Range Weather Forecasts. In particular, the proposed algorithm includes the dependences of wind speed and incidence angle on cross-polarized NRCS. The accuracy of SAR-derived wind speed is around 2.10ms−1root mean square error, which is validated against measurements from the Advanced Scatterometer onboard the Metop-A/B and the buoys from the National Data Buoy Center of the National Oceanic and Atmospheric Administration. The results obtained by the proposed algorithm considering the incidence angle in a GMF are relatively more accurate than those achieved by other algorithms. This work provides an alternative method to generate operational wind products for GF-3 SAR without relying on ancillary data for wind direction.
wind; Gaofen-3 synthetic aperture radar; cross-polarization
1 Introduction
Sea surface wind, which transfers energy across the air-sea interface, is an essential parameter for atmospheric and oceanographic research. Scatterometer (Vogelzang, 2017) and synthetic aperture radar (SAR) (Chapron, 2001) are microwave technologies widely used for wind estimation. Scatterometer winds are useful for global wind monitoring because of their more than 500km swath coverage with a spatial resolution of up to 12.5km. SAR is capable of sea surface monitoring with a large swath coverage at a fine spatial resolution. It is especially useful in coastal waters because the operational wind product of a scatterometer is generated 15–20km offshore. In the present work, we used the first Chinese civilian C-band Gaofen-3 (GF-3) SAR with a standard pixel size of 8–25m and a swath coverage of 30–40km in quad-polarization. It features a stripmap mode (, quad-polarization strip (QPS)) that can acquire the complete scattering matrix using linearly polarized antennae, including vertical-vertical (VV), horizontal-horizontal (HH), vertical-horizontal (VH), and horizontal-vertical (HV). In particular, SAR measurements at cross-polarization channels are useful for scientific research on hurricanes (Hwang, 2012; Shao, 2018b).
In recent years, several researchers have focused on developing techniques to retrieve wind from copolarized (VVor HH) SAR images. They found that a measured normalized radar cross-section (NRCS) from the Seasat scatterometer launched in 1978 at a copolarization channel is linearly related to the wind vector (Masuko, 1986). This discovery has resulted in the development of the geophysical model function (GMF). Stoffelen and Anderson (1997) used ERS-1 SAR images and the European Center for Medium-Range Weather Forecast (ECMWF) reanalysis winds to design the GMF CMOD4, which uses the VV-polarization channel. In addition, Quilfen(1998) proposed a similar GMF (, CMOD-IFR) exploiting another dataset developed at Institut Francais de Recherche pour Exploitation de la MER. However, the training data contained only a few scatterometer images taken under high-wind conditions (up to 22ms−1). Subsequently, the GMFs CMOD5 (Hersbach, 2007) and CMOD5N for neutral winds (Hersbach, 2010) were proposed. These functions essentially redesigned the previousmodels to include high-order nonlinearity for strong winds (up to 33ms−1), and several ERS-2 SAR images under cyclonic conditions were included in the tuning process. The latest version of the CMOD family is CMOD7 for wind retrievals from intercalibrated ERS (ESCAT) and Advanced Scatterometer (ASCAT) C-band scatterometers (Stoffelen, 2017), which are calibrated well within 0.1dB (Rivas, 2017). Not many models for HH-polarization have been developed because of the lack of SAR data acquired at the HH-polarization channel. Instead, a polarization ratio (PR) model that converts an HH-polarization NRCS into a VV-polarization NRCS is generally employed to retrieve wind from HH-polarization SAR images (Thompson, 1998). To date, previous studies have proposed various models (Vachon and Dobson, 2000; Wackerman, 2002). Recently, two analytical PR models using a C-band have been developed by integrating the influence of meteorological conditions. The first, which was presented by Mouche(2005), considers the dependence of PR on wind direction by using data collected during the validation with a Polarimetric Airborne Radar of the ENVISAT ASAR over Ocean experiments, in which observations were collocated with ENVISAT ASAR images acquired at various incidence angles and polarization channels. The second model was proposed by Zhang(2011). Remarkably, a new GMF C-SARMOD was proposed by Mouche and Chapron (2015). This GMF was designed differently from the previous CMOD family functions and can be applied directly to HH-polarization SAR images without any PR model.
The accuracy of retrieved scatterometer winds using such GMFs is about 1ms−1(Vogelzang, 2011). As reported in numerous studies (Lehner, 1998; Yang, 2011; Shao, 2014; Monaldo, 2016; Lu, 2018; Corcione, 2018), the root mean square error (RMSE) of SAR-derived wind speed retrievals with respect to reliable validation sources is within 2ms−1. The applicability of GMF, however, relies on prior wind direction. Although wind streaks between 800m and 3000m (Alpers and Brummer, 1994) on SAR images can be used to retrieve the local wind direction with 180˚ ambiguity, wind streaks are invisible in the presence of the distortions of other sea surface features (Zhao, 2016). Moreover, the copolarization SAR backscattering signal encounters saturation at strong winds (probably greater than 25ms−1) (Hwang and Fois, 2015; Shao, 2017a). Under such conditions, GMF algorithms cannot be applied to wind retrieval. Cross-polarization NRCS is useful for retrieving wind speed (Fois, 2015) and significant wave height (Shao, 2018a) in cyclones. Fois(2015) reported that future ocean scatterometry will take advantage of the cross-polarization backscattering signal to observe strong winds. Recently developed methodologies use cross-polarization NRCS to estimate moderate wind (Vachon and Wolfe, 2011; Hwang, 2012; Huang, 2017) and strong wind (up to 55ms−1) from cross-polarization SAR imagery (Shen, 2014; Duan, 2017; Shao, 2018b) because cross-polarization NRCS does not saturate as easily as the copolarization backscattering signal.
The accuracy of wind retrieval using copolarization GF-3 SAR images has been assessed in several studies (Shao, 2017b; Ren, 2017; Wang, 2018; Shao, 2019). A simple wind retrieval algorithm for VH GF-3 SAR underwent preliminary tuning without consideration for the radar incidence angle (Ren, 2017; Wang, 2018), showing the effectiveness of retrieving sea surface wind speed from GF-3 SAR images using cross-polarization channels because operational wind monitoring is an important aspect of using SAR data. In this work, we studied the dependence of the cross-polarization NRCS of GF-3 SAR on wind vector and incidence angle. Then, we proposed an accurate semi-empirical algorithm for low-to-moderate wind speed retrieval from GF-3 SAR images at cross-polarization channels.
The remainder of this paper is organized as follows. Section 2 describes the available datasets. We collected more than 1000 GF-3 SAR images with visible wind streaks in the QPS mode. The streaks were collocated with ECMWF reanalysis wind data at 0.125˚ grids and treated as a tuning dataset. We treated the measurements from ASCAT onboard the Metop-A/B and buoys from the National Data Buoy Center (NDBC) buoys of the National Oceanic and Atmospheric Administration (NOAA) as our validation dataset. In Section 3, we employed the tuning dataset to study the dependence of the cross-polarization NRCS of GF-3 SAR on wind vector and incidence angle. We also showed a semi-empirical algorithm for wind speed retrieval on the basis of the analysis results. We presented the validation results in Section 4 through the validation dataset and discussed the results in Section 5. We summarized the conclusions in Section 6.
2 Description of Dataset
We acquired 1030 GF-3 SAR images in the QPS mode for our study from December 2016 to September 2017. These images are suitable for wind retrieval, in which wind streaks are visible at the copolarization channels. We employed the following equation to convert GF-3 SAR intensity images into NRCS (Shao, 2017b):

where0is the NRCS united in dB,is the pixel intensity from GF-3 SAR data,is the external calibration factor, andis the offset constant for a specific imaging mode. Recently, the updated calibration constantsandhave been officially released. They were derived from a large number of images over the Amazon rainforest to validate the feasibility of ocean calibration.
We divided all images into two subsets: one is to tune the algorithm and the other is to validate the algorithm.
2.1 Tuning Dataset
Since 1979, the ECMWF has continuously provided hind-cast wind production for investigators worldwide. It includes global atmospheric-marine reanalysis data at intervals of 6 hours per day (00:00, 06:00, 12:00, 18:00). Although the numerical weather prediction model, including NOAA Global Forecast System (GFS) winds, has a better time step with an interval of 3 hours, GFS winds have a lower spatial resolution with 0.5-degree grids than the ECMWF. In fact, previous studies have employed ECMWF winds for tuning (Hersbach, 2007; Shao, 2016) and validating (Shao, 2017b) wind retrieval algorithms from SAR images. GF-3 SAR imagery acquired in the QPS mode has a spatial resolution ranging from 16m to 50m, which is higher than that of ECMWF wind vectors (ERA-interim) in 0.125-degree grids (for both longitude and latitude directions). Thus, we divided each image into a number of subscenes with a spatial coverage of about 4km´4km. We then selected the subscenes covering the locations of the ECMWF grid data. We interpolated the ECMWF interval wind time to 1 hour using a cubic spline interpolation in a temporal scale. The time difference between SAR images and ECMWF winds was within 30 minutes. This methodology was fully described by Wang(2018) for the development of wind retrieval using GF-3 SAR data. This method is applied only when the difference between the ECMWF samples and GF-3 SAR acquisitions is smaller than a few hours. We collected matchup samples as the tuning dataset, which we then used to study the dependence of the GF-3 SAR NRCS at the cross-polarization channels on wind vector and incidence angle.
As an example, Figs.1a and 1b show a quick view of the calibrated images at the HV- and VH-polarization channels, respectively. The images were taken at 22:46 UTC on May 24, 2017 around the Bohai Sea; the colored arrows represent the ECMWF sea surface wind vectors at 00:00 UTC on July 13, 2012.
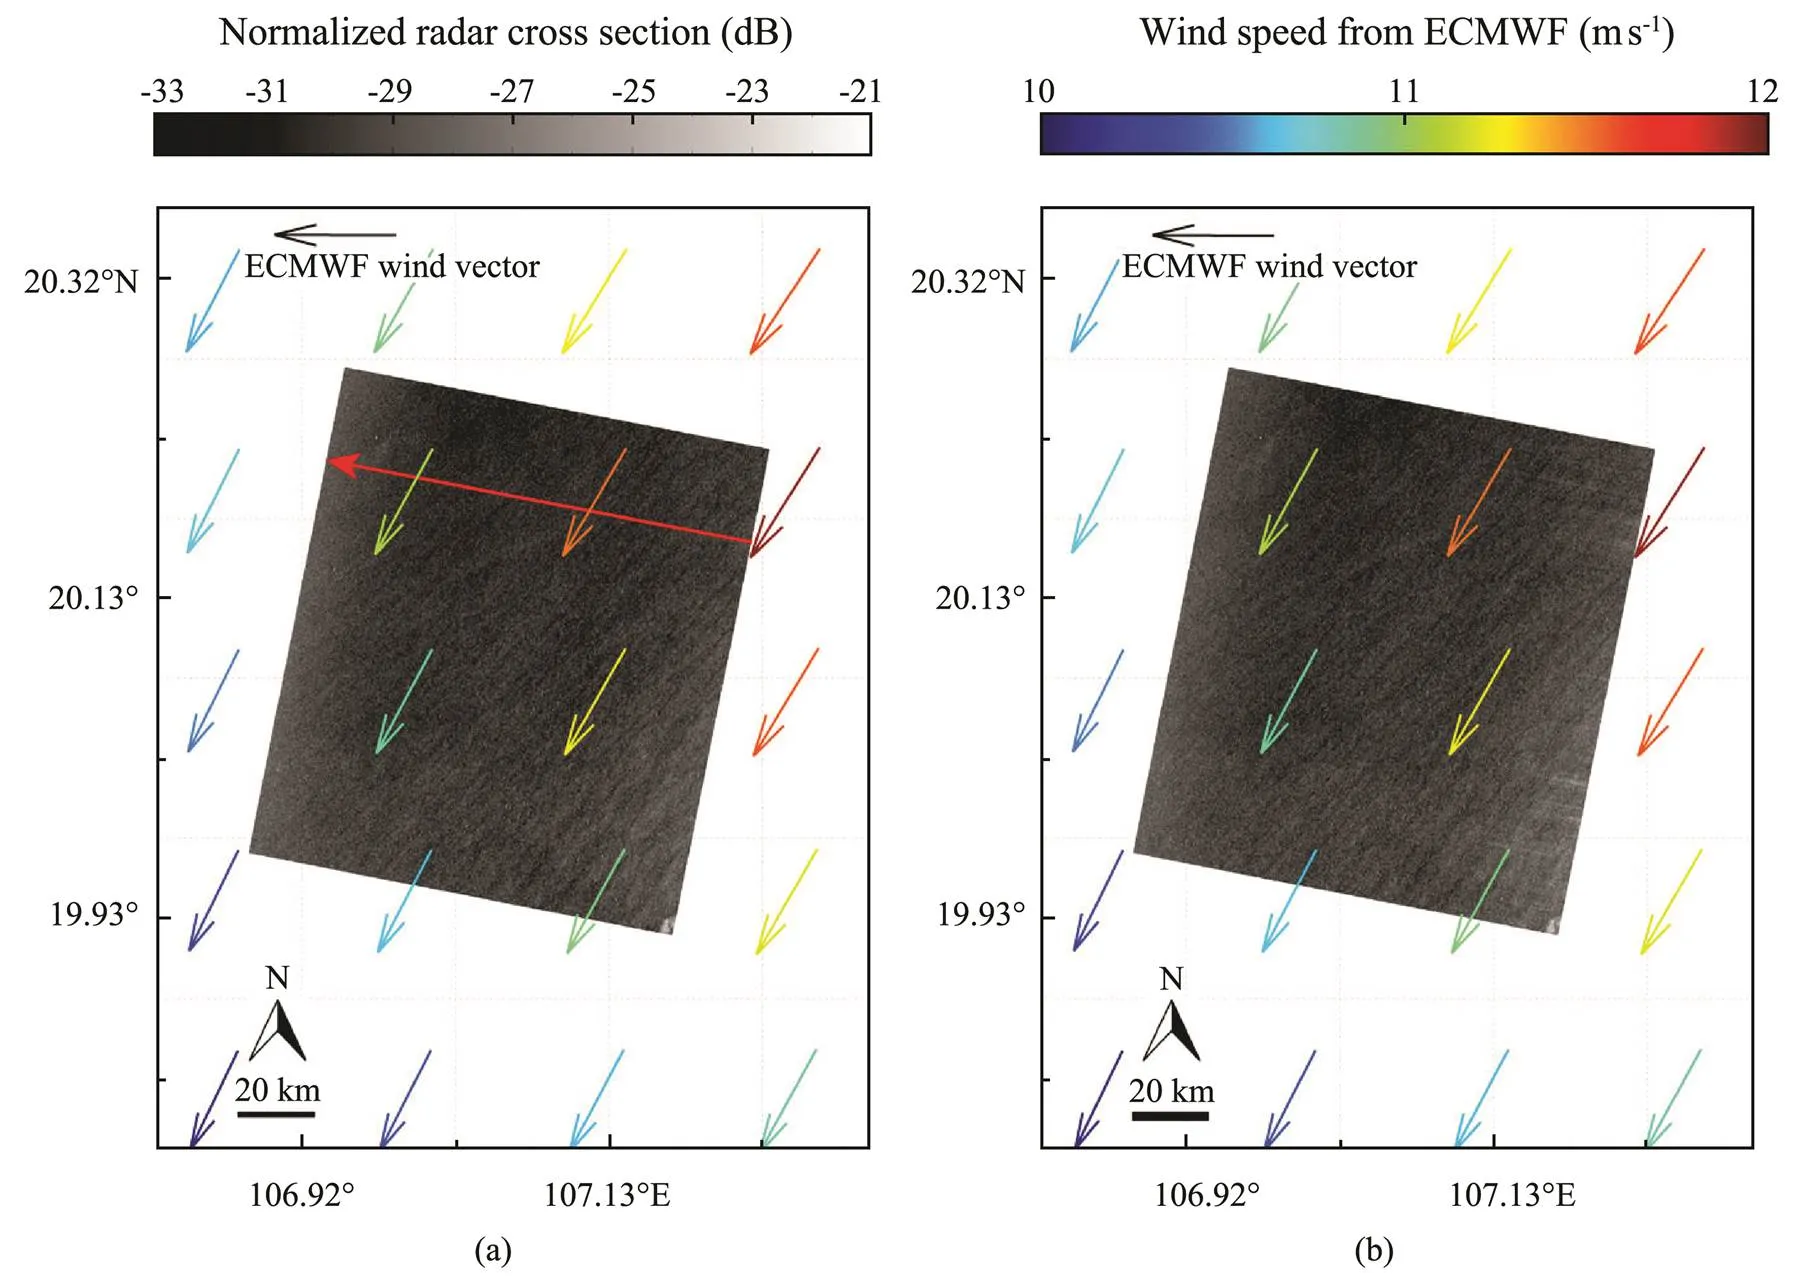
Fig.1 Case of HV-polarization Gaofen-3 (GF-3) SAR image taken at 22:46 UTC on May 24, 2017 around the Bohai Sea after calibration, in which colored arrows represent the European Centre for Medium-Range Weather Forecasts (ECMWF) wind vectors: (a) HV polarization and (b) VH polarization.
2.2 Validation Dataset
To validate the proposed algorithm, we used the wind products from ASCAT. The new-generation all-weather European active microwave scatterometer Metop-A/B was onboard this satellite and was initially released in February 2007. Vogelzang(2011) determined ASCAT windaccuracy to be below 1ms−1, rendering ASCAT winds reliable for surface wind vector retrieval with an 1800km-wide swath. Therefore, ASCAT winds are a valuable source of information for studying the accuracy of SAR-derived wind (Monaldo, 2016). The ASCAT winds herein had a 25km spatial resolution. The time difference between the exploited ASCAT and SAR products was within 2 hours. Similar to data processing for the tuning dataset, we selected the subscenes of each GF-3 SAR image covering the locations of ASCAT grid data. We also collected seven GF-3 SAR images covering the locations of NDBC buoys in U.S. western coastal waters. The location of available NDBC buoys and the coverage of the GF-3 SAR images are shown in Fig.2. We treated the matchups, including ASCAT winds, and the measurements of the NDBC buoys as the validation dataset.
The winds from the NDBC buoys were measured at 5m height above sea surface, whereas the traditional SAR-derived wind was assumed to be at a 10m height above the sea surface. We used the following function to convert to 10m height values using the logarithmically variable wind profile:
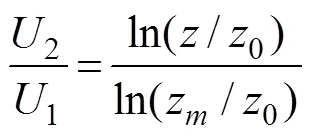
where2is the wind speed at height,1is the wind speed at the already known heightzmeasured from the NDBC buoy, and0is the roughness length taken as a constant 0.000152 as employed in our previous study (Shao, 2017b).
Figs.3a and 3b show examples of HV- and VH-polarizationchannels. The images were taken at 09:27 UTC on January 1, 2017. These cases were located around the Yellow Sea and were collocated with ASCAT winds indicated by the colored arrows.
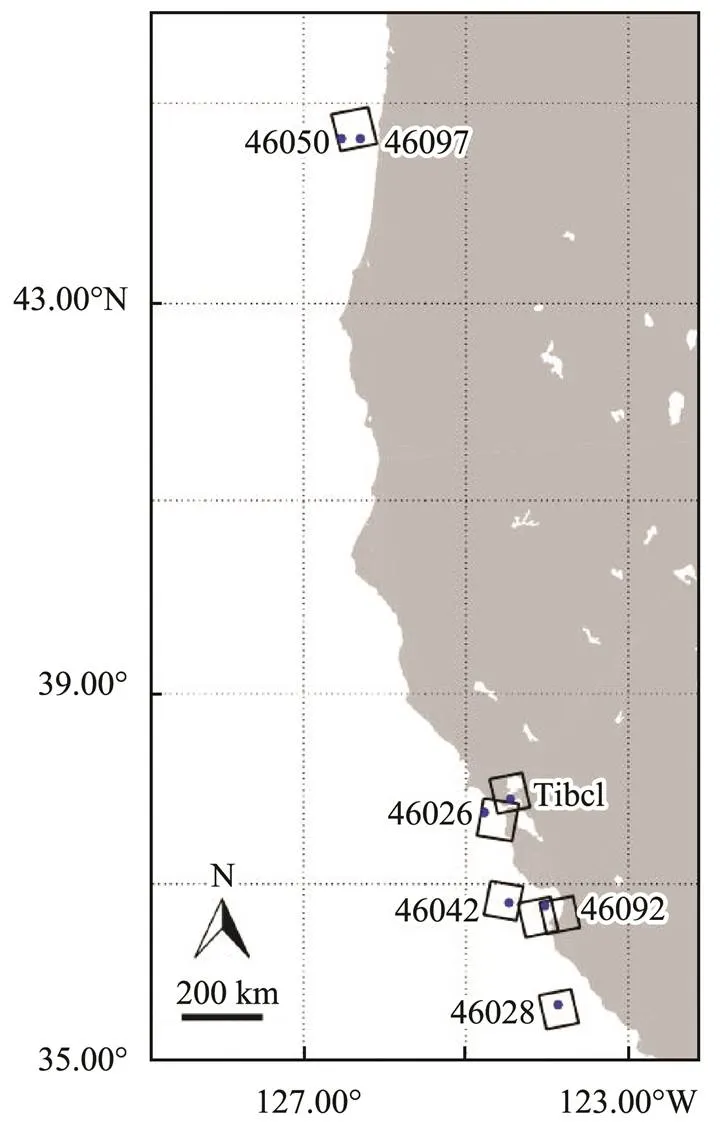
Fig.2 Information of NDBC buoys and corresponding GF-3 SAR images; rectangles represent the spatial coverage.
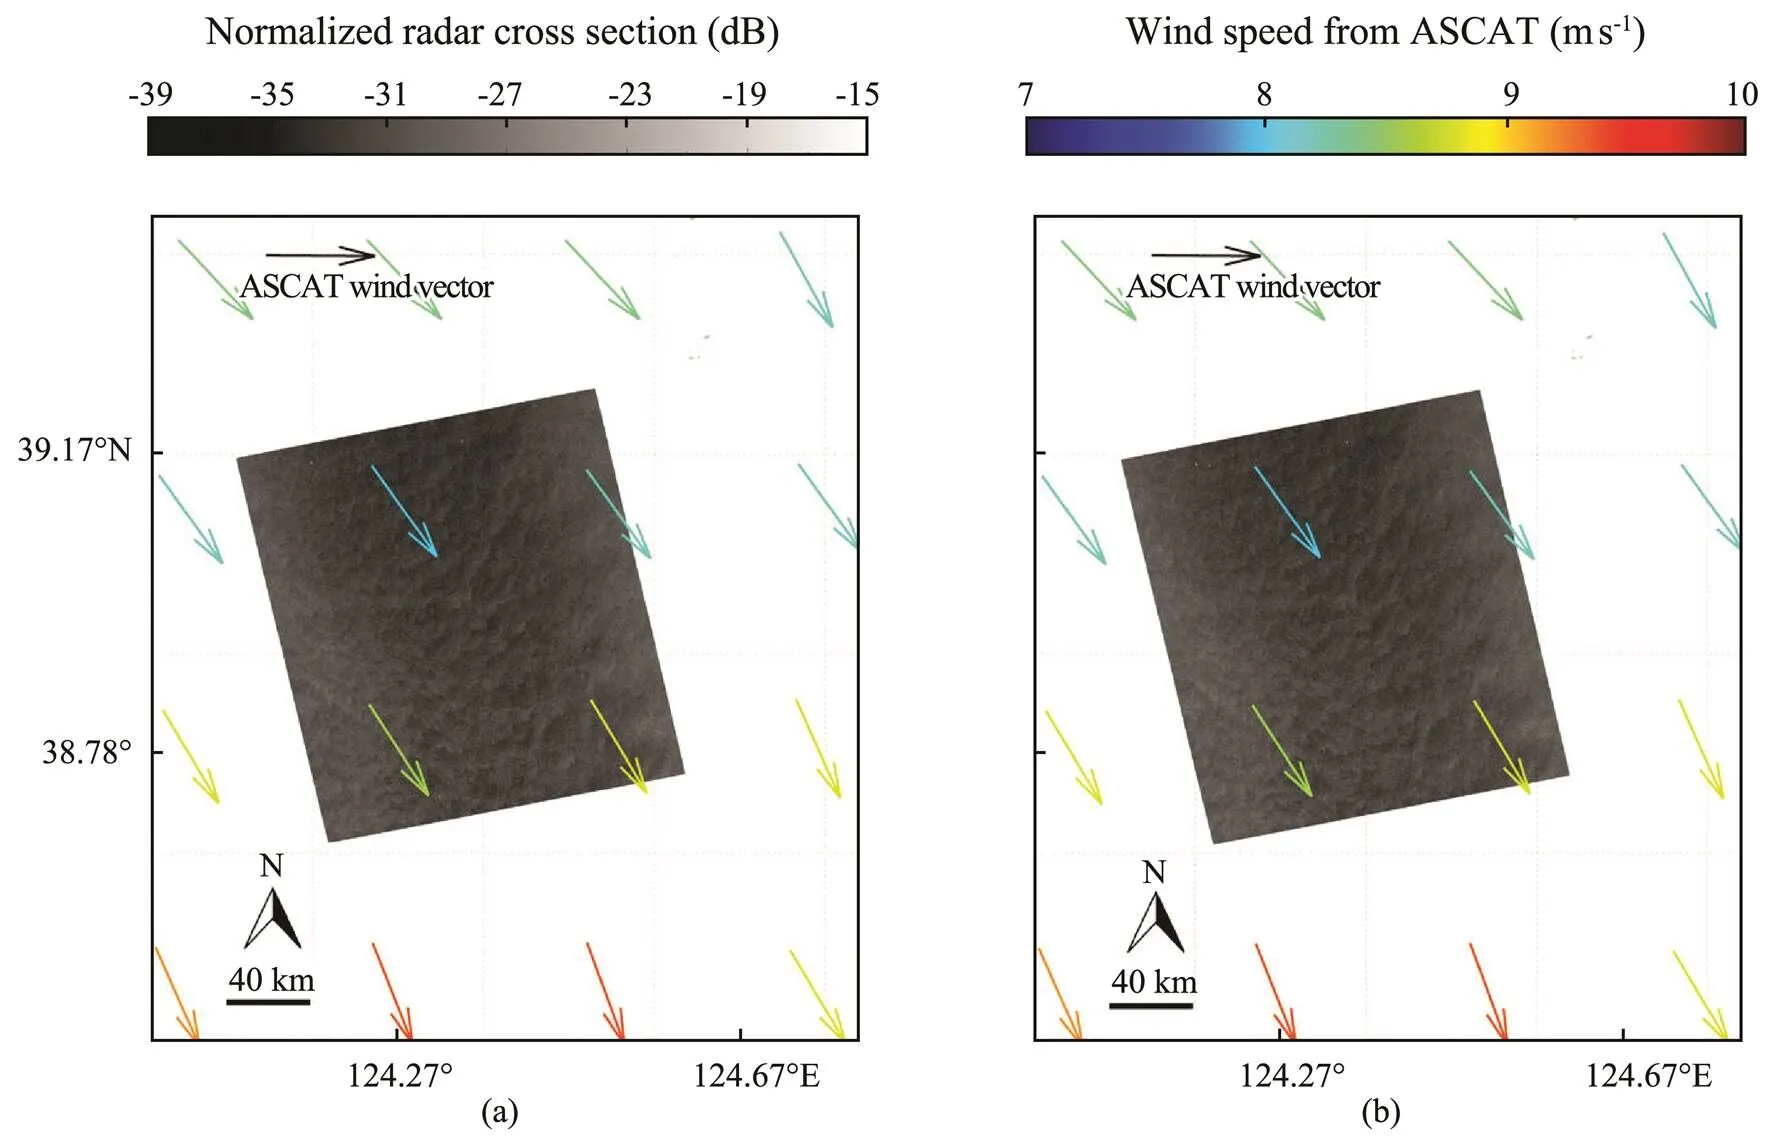
Fig.3 GF-3 SAR image taken at 09:27 UTC on January 1, 2017 around the Yellow Sea after calibration; the colored arrows represent ASCAT wind vectors. (a) HV polarization. (b) VH polarization.
3 Methodology
In this section, based on the tuning dataset, we studied the dependence of cross-polarization NRCS of GF-3 SAR on wind vector and incidence angle and then developed a semi-empirical wind retrieval algorithm.
3.1 Dependence of Cross-Polarization NRCS of GF-3 SAR on Incidence Angle
The information of noise-equivalent sigma zero (NESZ) was not annotated with GF-3 raw data, and the NESZ of GF-3 SAR at the cross-polarization channels had been roughly analyzed by Ren(2017) and Wang(2018). As raised by Wang(2018), the information of system noise floor was privately provided for GF-3 SAR acquired in the present wave mode data, and the NESZ of the QPS mode has not been officially released. Therefore, we discussed the NESZ correction for the case study shown in Fig.1, which was provided by the Institute of Electronics, Chinese Academy of Sciences. We showed the denoised results following the red arrow in Fig.4. We found that the dependency on the range coordinate improved after NESZ correction. We employed the following equations to obtain the denoised results:


Fig.5a shows the NRCS at the cross-polarization channelsthe incidence angle through our data collection. We also empirically tuned the function of NESZ in terms of incidence angle to obtain the denoised NRCS at the cross-polarization channels (see the red lines in Fig.5a). Fig.5b shows that the coefficient was 0.98 between the NRCS at the HV- and VH-polarization channels. Thus, we show only the dependence of NRCS from the HV-polarization GF-3 SAR image on wind vector. Fig.5c illustrates the comparison between the NRCS at the VV- and VH-polarization channels, showing that the VV NRCS was related linearly to the VH NRCS because the VV NRCS was greater than −20dB.

Fig.4 Denoised NRCS from the HV-polarization GF-3 SAR image with NESZ correction versus the incidence angle following the red arrow in Fig.1.

Fig.5 (a) NRCS from the HV-polarization GF-3 SAR image versus the incidence angle, in which the red liens represent the fitted NESZ in term of incidence angle. (b) NRCS at the HV-polarization channel versus the NRCS at the VH-polarization channel. (c) NRCS at the VV-polarization channel versus the NRCS at the VH-polarization channel.
3.2 Dependence of Cross-Polarization NRCS of GF-3 SAR on Wind Vector
Fig.6 shows the denoised cross-polarization NRCSwind speed from ECMWF. The color represents the radar incidence angle. We observed a linear relationship between the NRCS and wind speed at a 10m height above sea surface10.
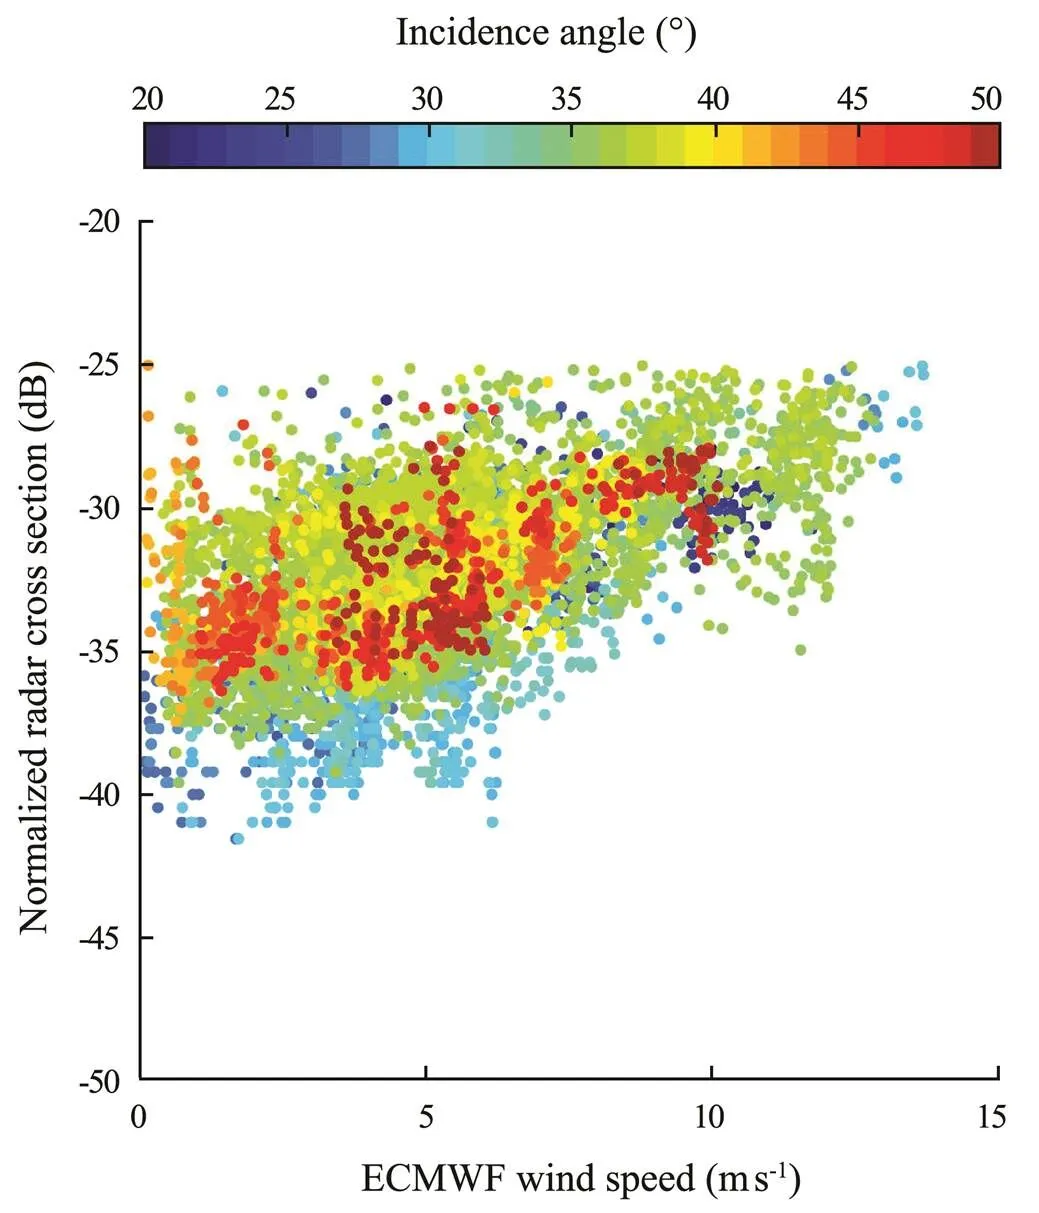
Fig.6 Denoised NRCS at the HV-polarization channel versus ECMWF wind speed for GF-3 SAR; colors represent incidence angles.
Fig.7 displays the average HV-polarization NRCS after NESZ correctionwind speeds at various incidence angles, where the wind is between 0 and 15ms−1with a 1ms−1bin, and the error bar represents the standard deviation at each bin. We observed that the HV-polarization NRCS had a linear relationship with wind speed at various radar incidence angles and that this relationship tends to be strong because the correlations (COR) were around 0.6 at the selected intervals. However, the HV-polarization NRCS had a slightly decreasing trend with wind speed for speeds slower than a specific value (that we assumed to be 2–5ms−1). This finding is consistent with the conclusions of previous studies for Rardarsat-2 (Hwang and Fois, 2015) and Sentinel-1 SAR (Shao, 2017a) at the two cross-polarization channels. This behavior is somewhat different from the results presented by Hwang and Fois (2015), Fois(2015), Shao(2017a), and Shao(2018b). These studies explored the relationship between NRCSs of Radarsat-2 SAR fine quad (FQ) mode and moored wind speeds. The difference in these results was due to the fact that the noise floor for the Radarsat-2 FQ images was evaluated carefully using the annotation file, whereas the process was only performed in the present study using an empirical NESZ correction. Wind speed must be great enough to obtain a useful cross-polarization backscattering signal. If the wind speed is too low, the cross-polarization channels become strongly affected by the presence of noise, resulting in a decreasing trend for wind speeds slower than a specific value. This phenomenon may explain why the relationship between GF-3 NRCS at the cross-polarization channels and wind speed is not simply linear at any incidence angle. We proposed, however, a more convincing physics after removing the noise effect of cross-polarization in the GF-3 SAR data. Under this circumstance, we anticipated that the performance of the calibration quality of GF-3 SAR at low wind speed would be improved.

Fig.7 Denoised NRCS of the HV-polarization GF-3 SAR versus ECMWF average wind speed for incidence angles between 20 and 50 degrees and 1ms−1 of wind speed bins between 0ms−1 and 15ms−1; error bar represents the standard deviation at each bin.
We also investigated the dependence of denoised NRCS at a cross-polarization channel on wind direction. The analysis of the HV-polarization channel is presented in Fig.8 (the red lines represent the tendency at each wind speed bin). We observed that the cross-polarization of the NRCS was modulated by wind direction at wind speeds greater than 8ms−1. The dependence of the wind direction, however, was relatively weak compared with the dependence of wind speed on the cross-polarization of the NRCS. This is why most cross-polarization GMFs do not consider wind direction modulation (Vachon and Wolfe, 2011; Hwang, 2012; Duan, 2017; Ren, 2017). In this study, therefore, we excluded wind direction modulation in the wind retrieval algorithm at a cross-polarization channel.
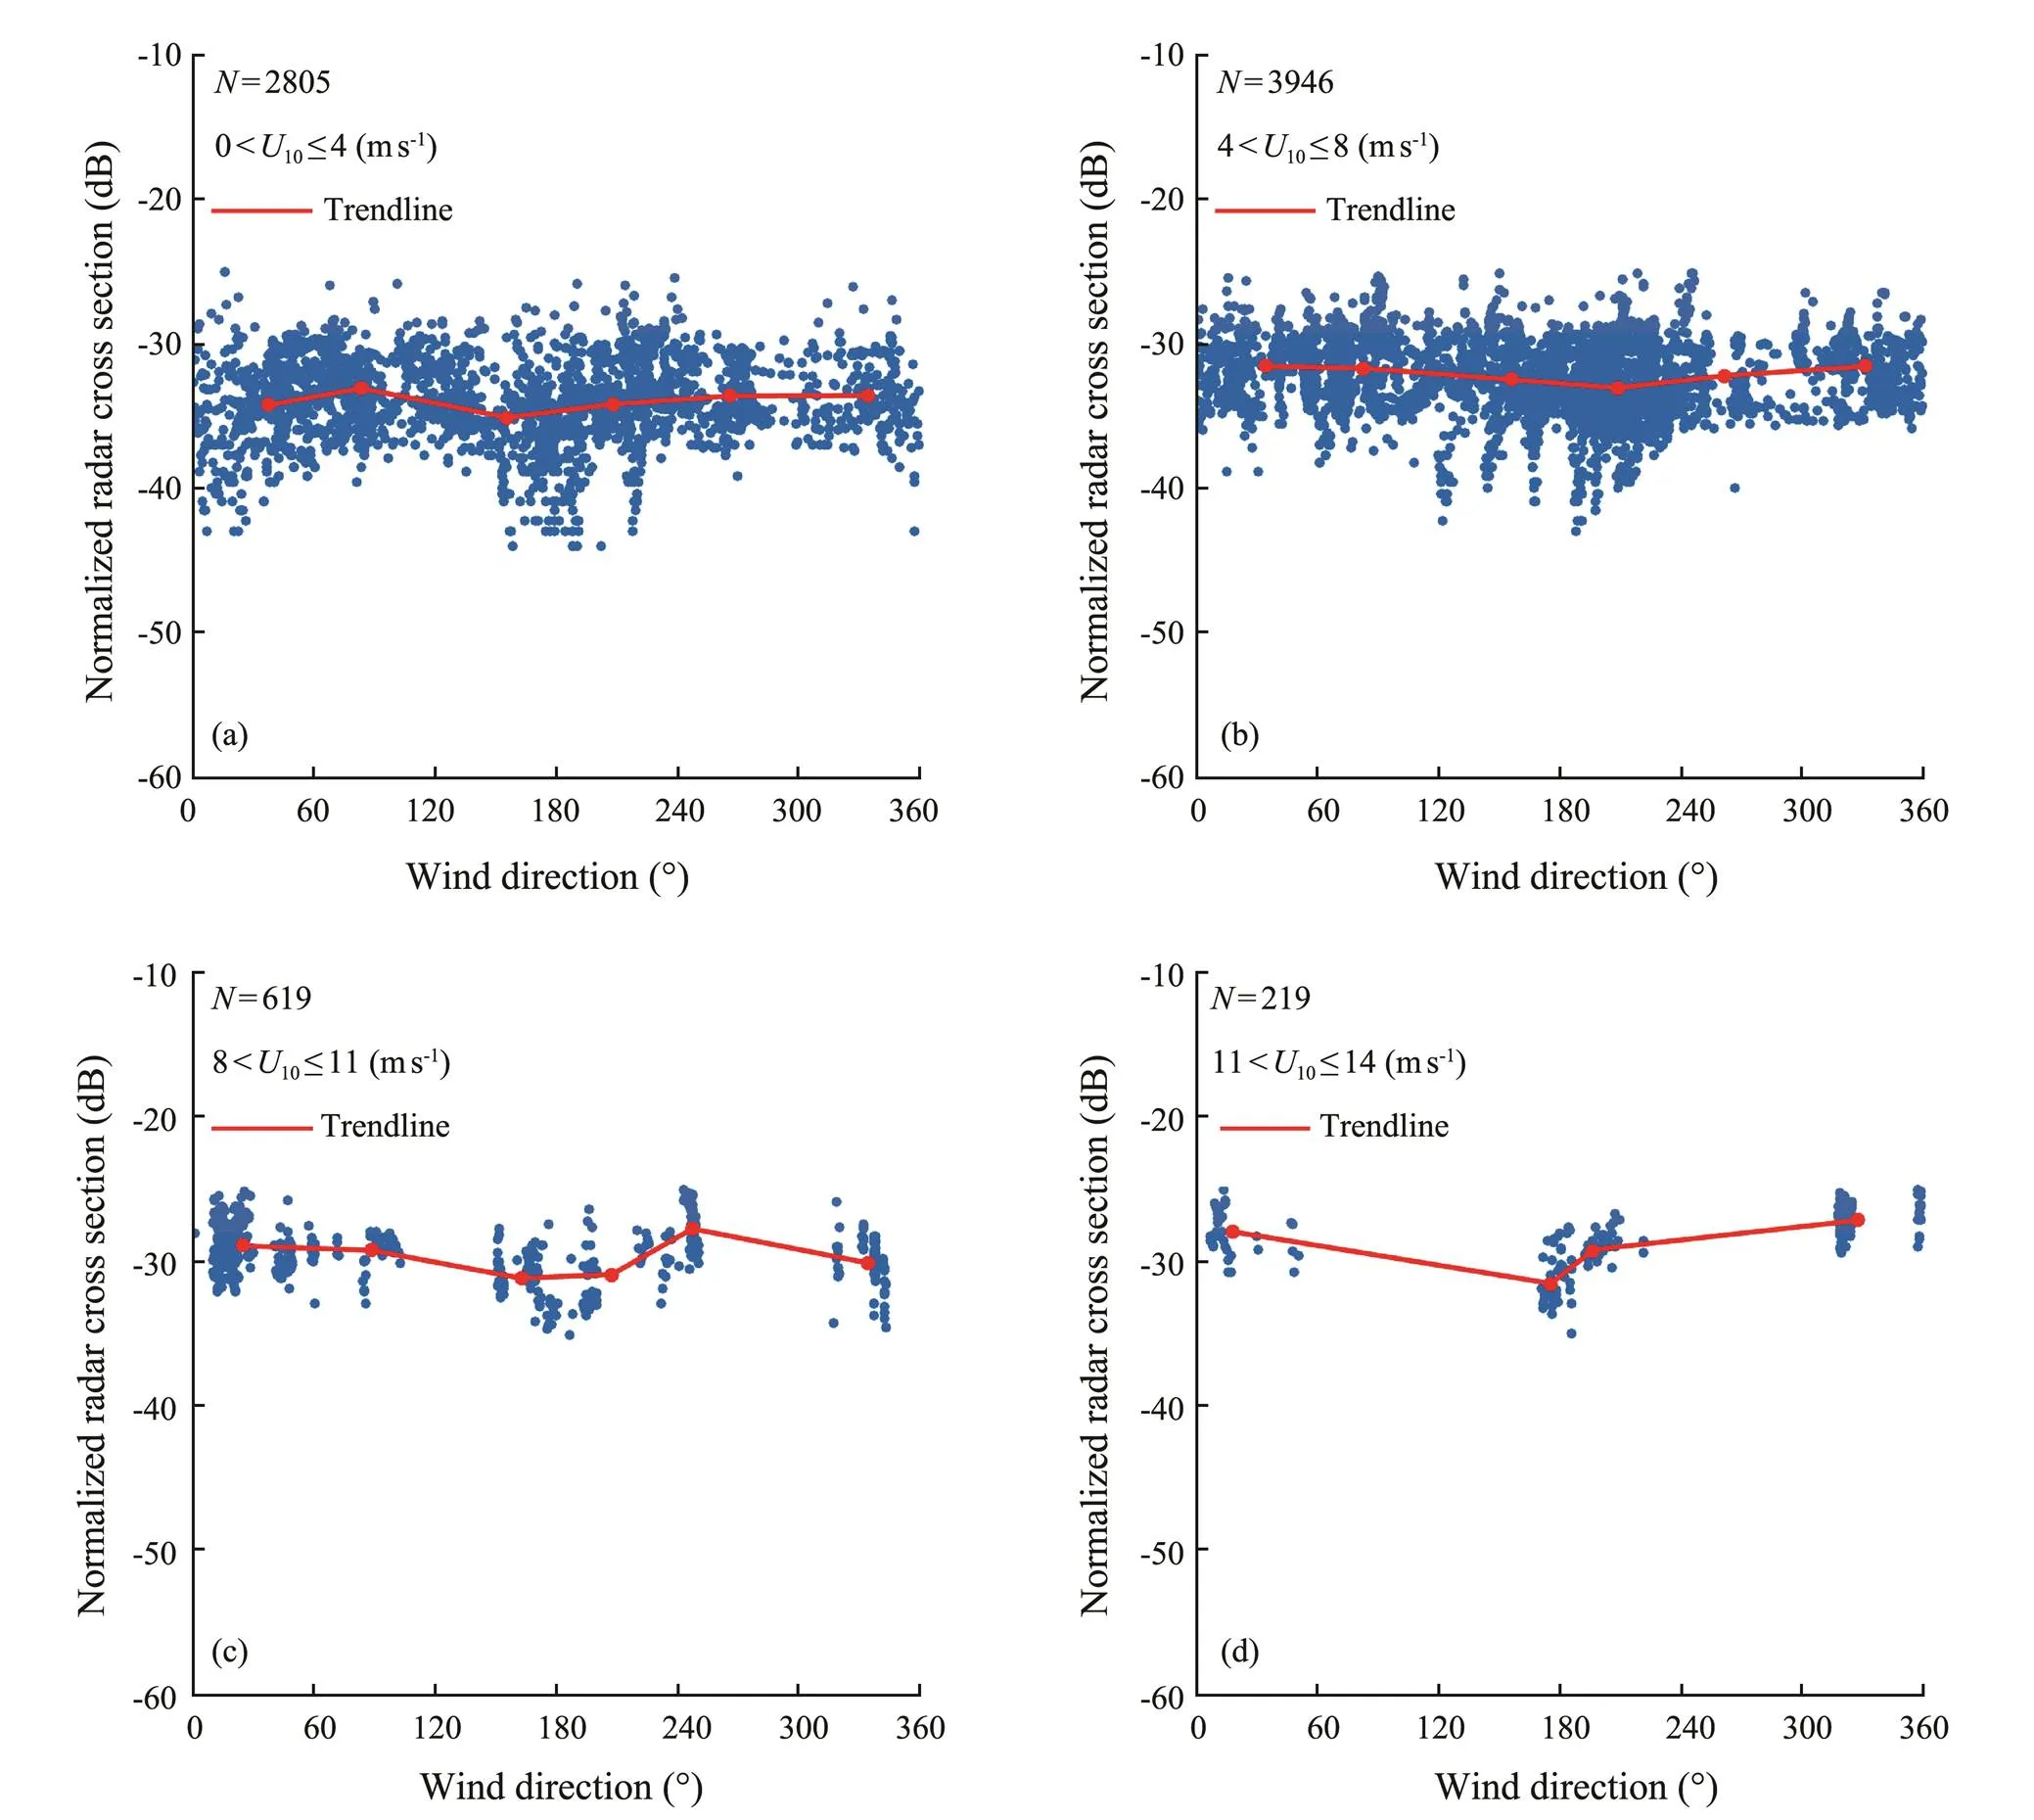
Fig.8 Denoised NRCS at the HV-polarization channel versus wind direction for the GF-3 SAR at each wind speed bin. Red lines present the tendency. Wind speed ranges from (a) 0ms−1 to 4ms−1, (b) 4ms−1 to 8ms−1, 8ms−1 to 11ms−1, and 11ms−1 to 15ms−1.
3.3 Tuning the Semi-Empirical Algorithm
To obtain accurate results, we tuned the semi-empirical wind retrieval algorithmfor HV and VH polarization through our dataset.
We followed the methodology established in Vachon and Wolfe (2011) to derive a semi-empirical expression for wind speed retrieval from the cross-polarization GF-3 SAR images. The procedure is briefly summarized as follows:
Step 1: Divide the data into a few finite numbers of bins for incidence angles at intervals of 20˚–26˚, 26˚–35˚, and 35˚–50˚.
Step 2: For each incidence angle bin, remove the appropriate data from the whole dataset.
Step 3: Fit the selected data using the-degree (£4) polynomial function of wind speed and incidence angle based on regression. In the meantime, the standard deviation of measurement error is recorded for each degree of the polynomial function to fit.
Step 4: The coefficients in theth polynomial function corresponding to the minimum standard deviation are the best fit results, and attempt to satisfy the performance at low wind.
Through this analysis, the formula for the proposed semi-empirical algorithm is described as follows:

in which


where0is the denoised NRCS of the cross-polarization GF-3 SAR united in dB,10is the wind speed at 10m above sea surface united inms−1,is the incidence angle united degree,is taken as 2,is taken as 1, and matrixaandbare the polynomial fitted results based on regression using the tuning dataset, as shown in Table 1. Although the semi-empirical algorithm takes a unique formulation, the tuned constants are somewhat different for HV and VH polarization.
This function is different from that proposed by Hwang(2012), who used the GF-3 SAR images acquired in Global Observation and Wide ScanSAR modes in typhoons, for which the retrieved wind speeds exceeded 10ms−1. The cross-polarization NRCS does not always increase with increasing wind speed at low wind. The COR between the fitted results and those observed for NRCS were 0.62 for HV and VH polarization, respectively, as shown in Fig.9. COR can be improved after using additional data. We anticipate that more data will be available in the continuation of the GF-3 SAR mission. As a preliminary result, however, we believe the proposed algorithm is suitable for wind retrieval with the available dataset, which shows the effectiveness of including the incidence angle in a cross-polarization GMF.

Table 1 Coefficients tuned for the wind speed retrieval algorithm in cross-polarization
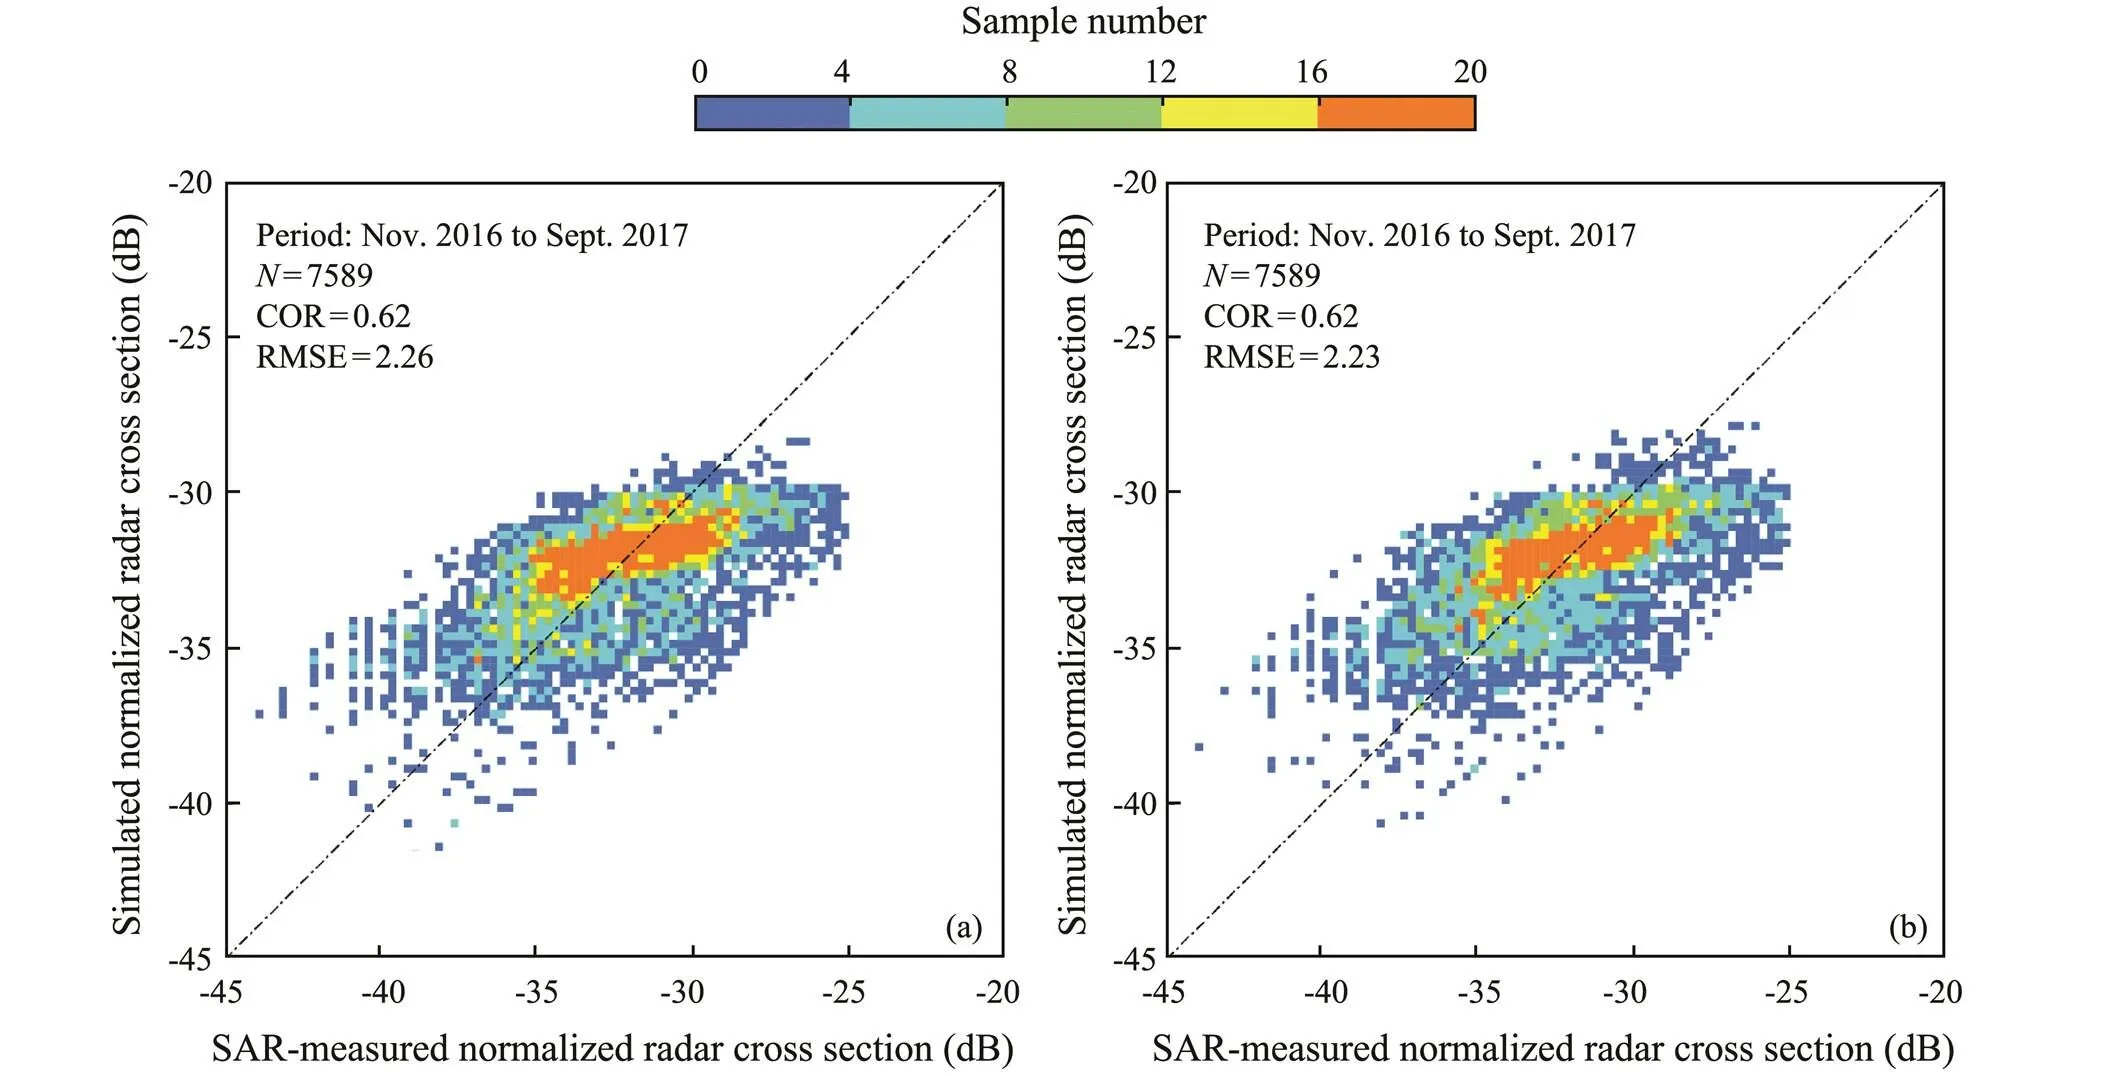
Fig.9 Denoised SAR-measured NRCS of the cross-polarization GF-3 SAR versus simulated results using Eq. (3). (a) HV polarization. (b) VH polarization.
4 Results
Fig.10 shows an example of a SAR-derived wind map for the region previously shown in Fig.3 at the HV-polarization channel. The comparison of wind speed with ASCAT wind speed is listed in Table 2 for HV and VH polarization. Results showed that the maximum difference for the four matchups was 2.80ms−1for HV polarization and 2.75ms−1for VH polarization, indicating that the algorithm is applicable for wind retrieval. Fig.11 presents another retrieval case using an acquisition taken at 09:51 UTC on May 25, 2017. The results for this case showed the details in the SAR-derived wind map. Although we propose an empirical method to remove the noise at cross-polarization, the SAR-derived wind speeds at both sides of this image are greater than these in the middle. Therefore, we believe the denoise issue still warrants further study.

Table 2 Comparisons of wind speed with ASCAT for the case taken at 09:27 UTC on January 1, 2017
In this study, we collected around 500 GF-3 SAR images acquired in the QPS mode and covering the ASCAT footprint. In total, we used 801 matchups to validate the empirical cross-polarization wind speed retrieval algorithm. As shown in Figs.12a and 12b, the RMSEs of wind speed for VH and HV polarization were 2.16 and 2.12 ms−1, respectively. In addition, we obtained eight matchups with measurements for the NDBC buoys. The RMSE of wind speed was 2.02 for HV polarization and 1.94ms−1for VH polarization, as shown in Figs.13a and 13b.
As mentioned in the introduction, the standard error of SAR-derived wind speed was about 2ms−1for copolarization channels. If less accurate wind directions with low spatial and temporal resolution were exploited (, derived from numeric prediction and scatterometer observation), the statistical error would become larger. Although the observed RMSE for retrieved wind speed in cross-polarization (, 2.12ms−1against ASCAT wind) was slightly worse than that in copolarization, the advantage of the proposed cross-polarization wind retrieval algorithm is that it worked without prior information on wind direction.
To systematically evaluate retrieval accuracy, we compared the results of winds derived from ASCAT using the existing five VH-polarization algorithms developed for Radarsat-2 (Vachon and wolfe, 2011; Hwang and Fois, 2015; Huang, 2017) and GF-3 SAR (Ren, 2017; Wang, 2018) at low-to-moderate wind speeds. Fig.14 shows that the RMSEs of the wind speed were 2.45, 4.71, 2.90, and 2.46ms−1using the algorithms provided by Vachon and wolfe (2011), Hwang and Fois (2015), Wang(2018), and Ren(2017), respectively. This analysis showed that using the GF-3 SAR QPS data, the proposed semi-empirical algorithm performed better than other algorithms.

Fig.10 SAR-derived wind map of HV-polarization GF-3 SAR image taken at 09:27 UTC on January 1, 2017 using the proposed algorithm.
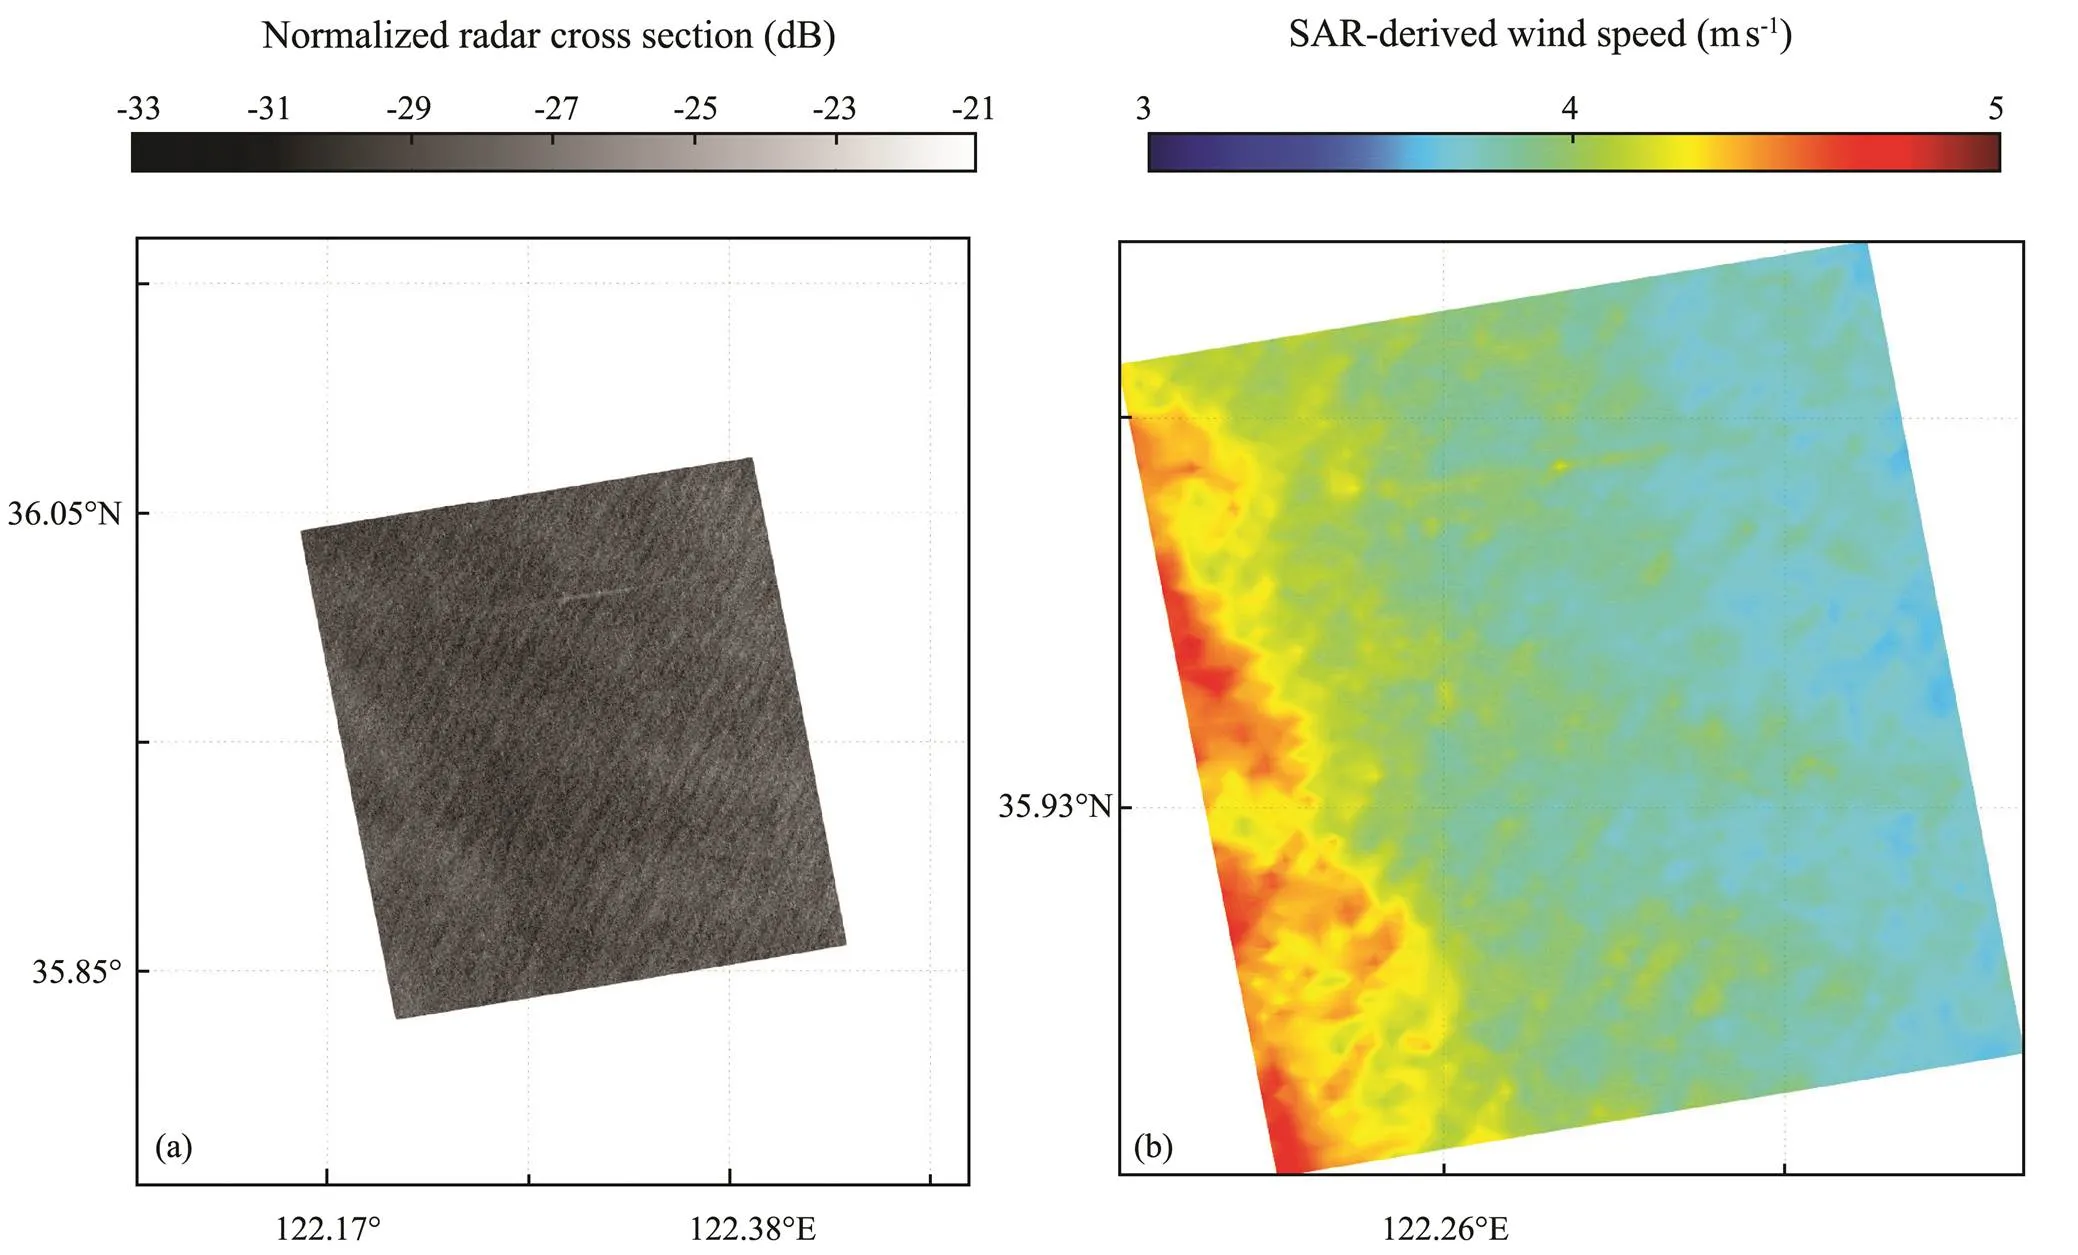
Fig.11 Quick-look image and SAR-derived wind map of the cross-polarization GF-3 SAR image taken at 09:51 UTC on May 25, 2017 using the proposed algorithm. (a) Quick-look image for HV polarization. (b) SAR-derived wind map for HV polarization.
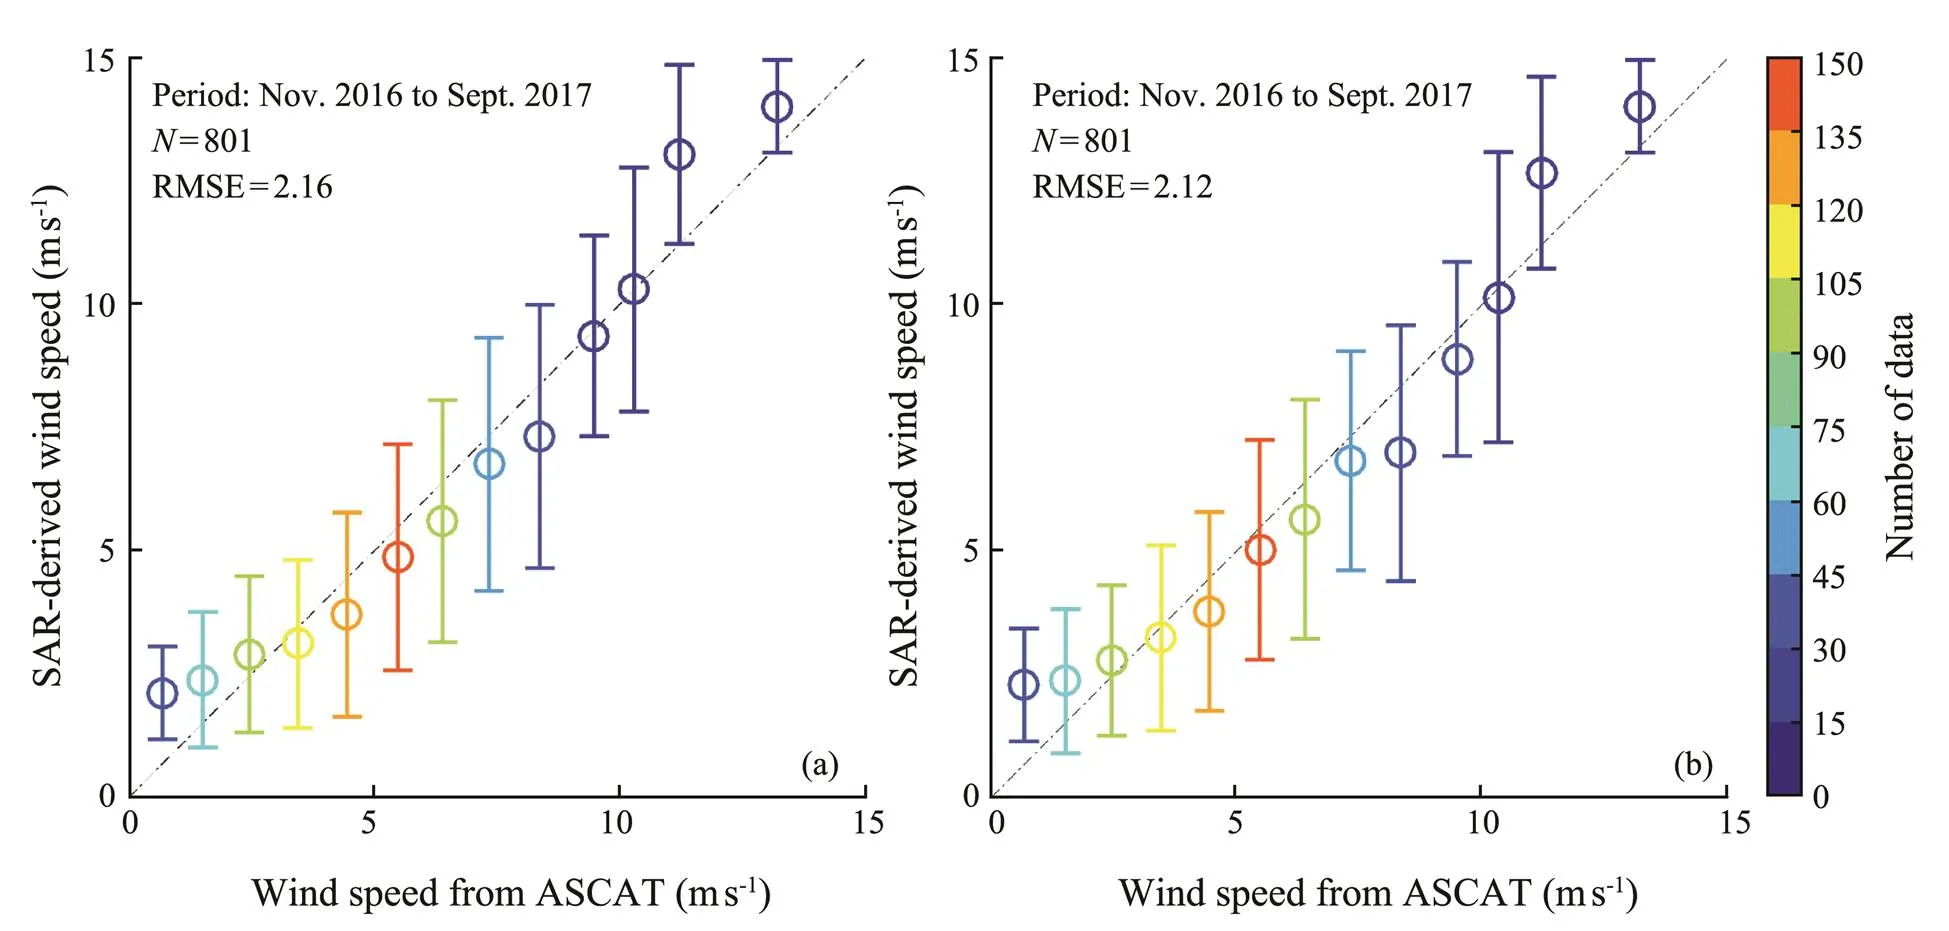
Fig.12 Comparison between measurements from ASCAT and retrieved wind speeds for 1ms−1 of wind speed bins, in which error bars represent the standard deviation of each bin.
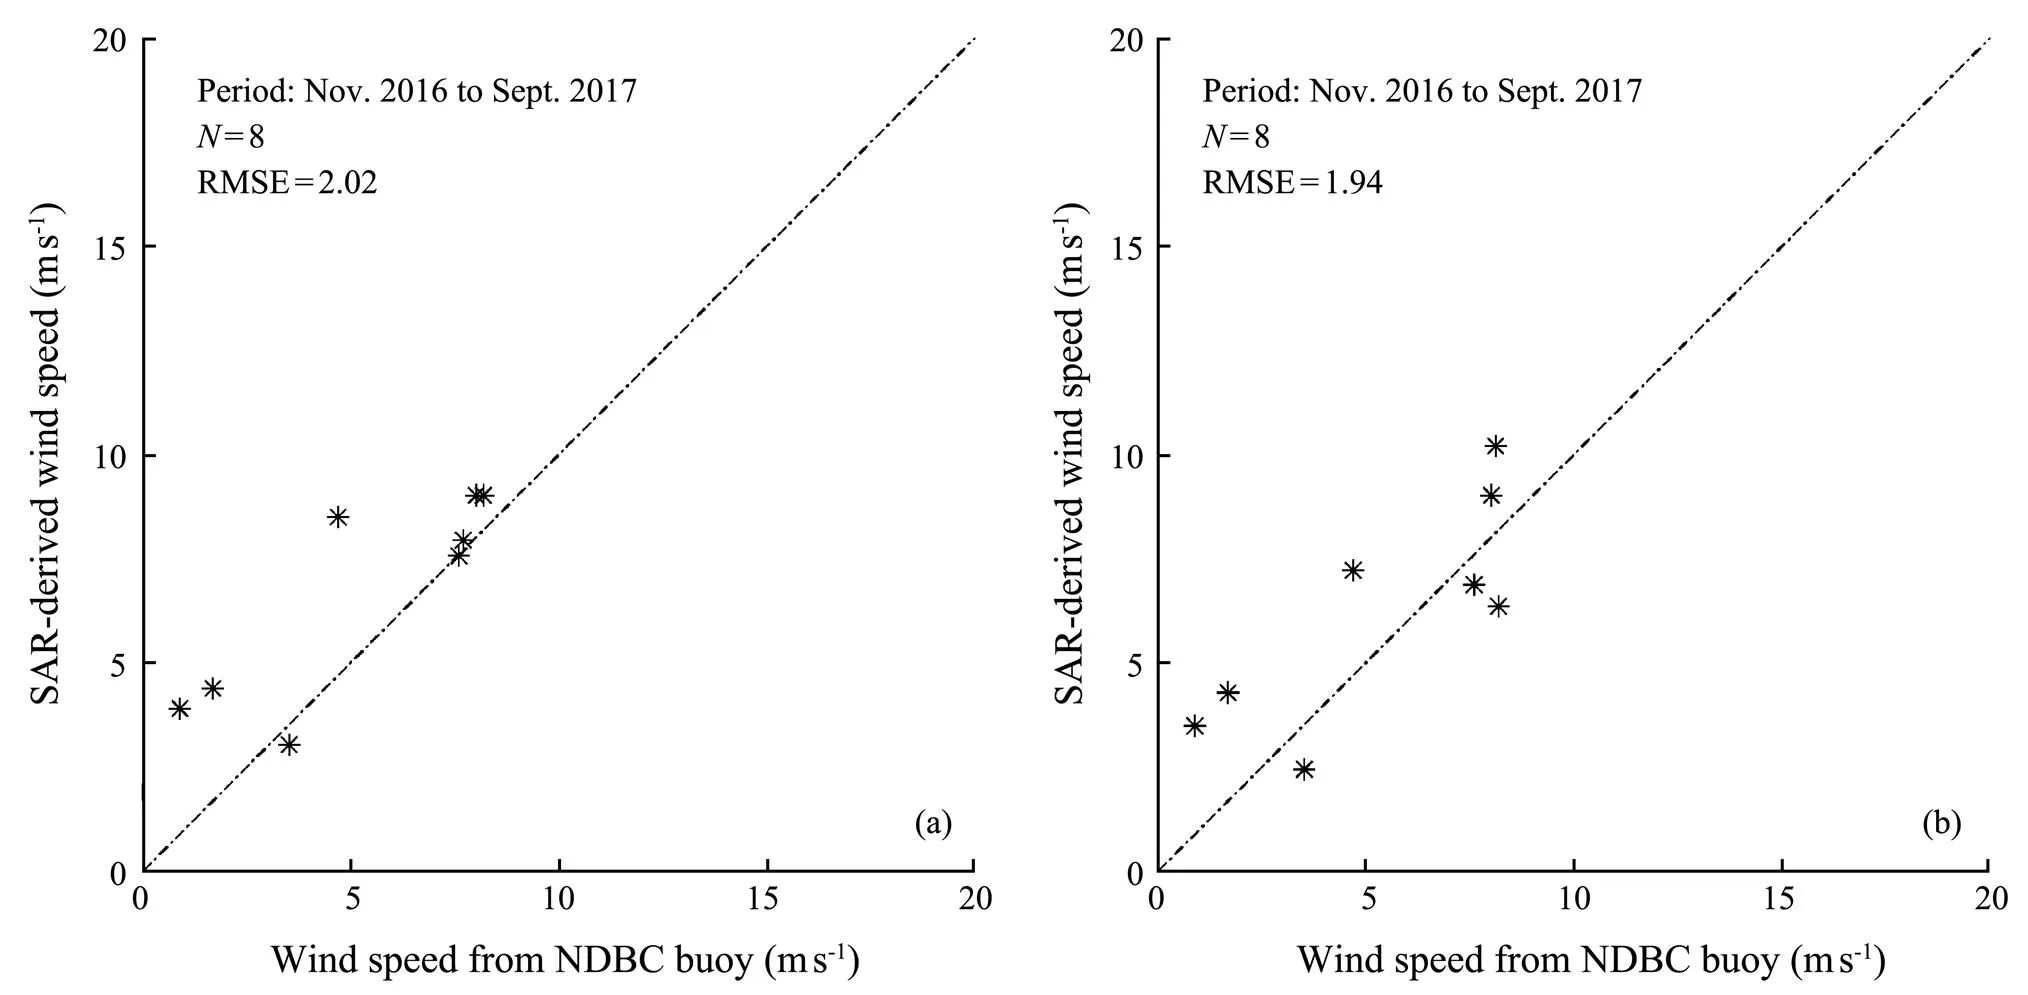
Fig.13 Comparison between measurements from NDBC buoys and retrieved wind speeds. (a) HV polarization. (b) VH polarization.
5 Discussion
The bias (SAR-derived wind speed minus ASCAT wind) analysis of the semi-empirical algorithm at HV-polarization channel is presented in Fig.15. We used a bin size of 2˚ for the incidence angle and 1ms−1for wind speed to group data pairs, and the error bars represent the standard deviation of each bin. The variation of bias frustrated the incidence angle. We believe this wavy behavior caused this issue: the polynomial function was employed to include the incidence angle in the semi-empirical algorithm. The error appeared acceptable at low wind speed (probably up to 4ms−1). The variation of bias significantly increased with increasing wind speed, although an ASCAT wind also has inherent potential errors at low wind speed. This performance generally revealed an area that could be improvedintheaccuracyofGF-3SAR-derivedwindspeed at low wind. The variation of bias remained at around 1.5ms−1as wind speeds exceeded 4ms−1, indicating that the proposed semi-empirical algorithm was stable. Therefore, ECMWFdatagenerallyunderestimatethewinddata(Stopa and Cheung, 2014) used for tuning the proposed algorithm. The probable explanation is the observed underestimation of retrieved results comparing with the ASCAT winds.
6 Conclusions
We investigated the potential ofa semi-empirical algorithm that considers wind speed and incidence angle for wind sp eed retrieval using noisy cross-polarization GF-3 SAR images. To study the dependence of the cross-polarization NRCS on wind vector and incidence angle, we used GF-3 SAR images acquired in the QPS mode and collocated with ECMWF wind data at a 0.125˚´0.125˚ grid, herein called the tuning dataset. The cross-polarization NRCS had a linearly increasing trend with wind speed; however, linearity was lost at low wind speeds. This behavior was caused by a low signal-to-noise ratio, although the empirical NESZ correction in terms of incidence angle was included in the data process. Our work also confirmed the weak dependence on wind direction. Therefore, we could exclude this parameter in retrieving wind speed at the cross-polarization channels.

Fig.14 Comparison between SAR-derived wind speeds using the existing five algorithms and average ASCAT winds for 1ms−1 of wind speed bin, in which error bars represent the standard deviation of each bin: (a) using the algorithm proposed in Vachon and Wolfe (2011), (b) using the algorithm proposed in Hwang and Fois (2015), (c) using the algorithm proposed in Wang et al. (2018), and (d) using the algorithm proposed in Ren et al. (2017).
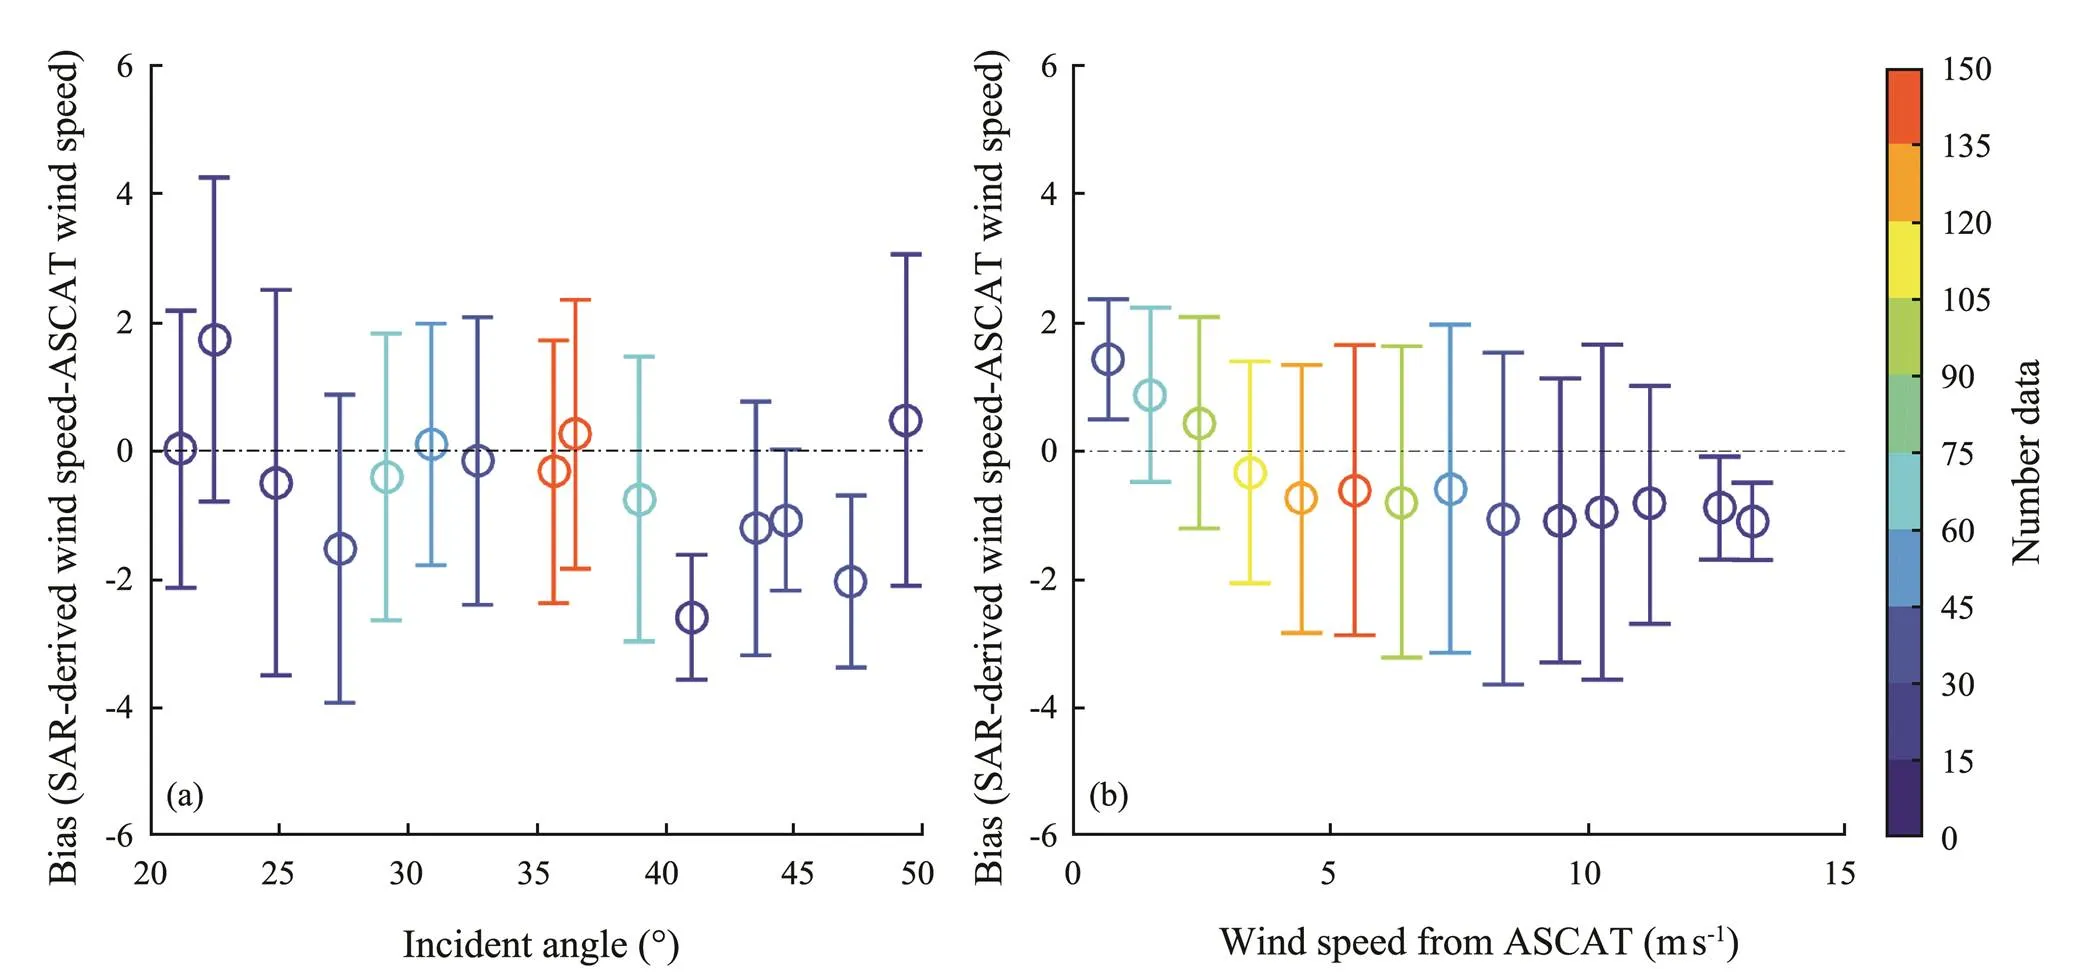
Fig.15 (a) Bias (SAR-derived wind speed minus ASCAT wind speed) versus incidence angle for 2˚ of incidence angle bin. (b) Bias versus ASCAT winds for 1ms−1 of wind speed bin. Error bars represent the standard deviation of each bin.
We divided the collocated tuning dataset into three classes of incidence angles between 20˚ and 50˚. As for each class, NRCS was related to wind speed and incidence angle through a polynomial function, in which the coefficients were fitted based on regression. In particular, we tuned the coefficients for HV and VH polarization. We used another validation dataset that includes GF-3 SAR images collocated with ASCAT winds and NDBC buoys to verify the applicability of the semi-empirical algorithm. The retrieval results showed around 2.10ms−1RMSE of wind speed using the proposed algorithm in cross-polarization. This value is less than the 2.45ms−1RMSE of wind speed obtained by the best of the five other algorithms we compared. This error analysis also indicated that the variation of bias was about 1.50ms−1with increasing wind speed at values greater than 4ms−1. Although we did not use a priori knowledge of wind direction, this validation showed that the retrieval results of the proposed algorithm were better than those of other existing algorithms. The proposed algorithm showed efficiency for operational wind monitoring using GF-3 SAR images acquired in the QPS mode.
In the near future, we plan to collect more data acquired in the QPS mode, including images taken at wind speeds up to 20ms−1and images at low wind covering moored buoys. Currently, NESZ information is not stored with GF-3 SAR images, and we only illustrate the denoised results using an empirical method based on the limited data collection. Thus, noise data must be anticipated released with GF-3 SAR data in the future. This work will be extended to other image modes, such as Spotlight Mode, Standard Stripmap, and Ultra Fine Stripmap, in the future.
Acknowledgements
GF-3 SAR images were accessed from http://dds.nsoas.org.cn as an authorized account issued by NSOAS. The updated calibration constants were collected from http://dds.nsoas.org.cn/business/document (in Chinese). We alsothank ECMWF for providing wind data, which were down- loaded from http://www.ecmwf.int. ASCAT winds were downloaded online from http://archive.eumetsat.int using an authorized account. Buoy data were downloaded fromhttp://www.ndbc.noaa.gov.
The research is partly supported by the Fundamental Research Funds for Zhejiang Provincial Universities and Research Institutes (No. 2019J00010), the National Key Research and Development Program of China (No. 2017YFA0604901), the National Natural Science Foundation of China (Nos. 41806005 and 41776183), the Public Welfare Technical Applied Research Project of Zhejiang Province of China (No. LGF19D060003), the New-Shoot Talented Man Plan Project of Zhejiang Province (No. 2018R411065), and the Science and Technology Project of Zhou- shan City (No. 2019C21008).
Alpers, W., and Brummer, B., 1994. Atmospheric boundary layer rolls observed by the synthetic aperture radar aboard the ERS-1 satellite., 99 (C6): 12613-12621.
Chapron, B., Johnsen, H., and Garello, R., 2001. Wave and wind retrieval from SAR images of the ocean., 56 (11): 682-699.
Corcione, V., Grieco, G., Portabella, M., Nunziata, F., and Migliaccio, M., 2018. A novel azimuth cutoff implementation to retrieve sea surface wind speed from SAR imagery., 57 (6): 3331-3340, DOI: 10.1109/TGRS.2018.2883364.
Duan, B. H., Zhang, W. M., Yang, X. F., Dai, H. J., and Yu, Y., 2017. Assimilation of typhoon wind field retrieved from scatterometer and SAR based on the Huber norm quality control., 9: 987.
Fois, F., Hoogeboom, P., Chevalier, F. L., and Stoffelen, A., 2015. Future ocean scatterometry: On the use of cross-polar scattering to observe very high winds., 53: 5009-5020.
Hersbach, H., 2010. Comparison of C-Band scatterometer CMOD5.N equivalent neutral winds with ECMWF., 27: 721-736.
Hersbach, H., Stoffelen, A., and Haan, S. D., 2007. An improved C-band scatterometer ocean geophysical model function: CMOD5., 112: 225-237.
Huang, L. Q., Liu, B., Li, X. F., Zhang, Z. H., and Yu, W. X., 2017. Technical evaluation of Sentinel-1 IW mode cross-pol radar backscattering from the ocean surface in moderate wind condition., 9: 854.
Hwang, P. A., and Fois, F., 2015. Surface roughness and breaking wave properties retrieved from polarimetric microwave radar backscattering., 120: 3640-3657.
Hwang, P. A., Stoffelen, A., Van Zadelhoff, G. J., Perrie, W., Zhang, B., Li, H., and Shen, H., 2012. Cross-polarization geophysical model function for C-band radar backscattering from the ocean surface and wind speed retrieval., 120: 893-909.
Lehner, S., Horstmann, J., Koch, W., and Rosenthal, W., 1998. Mesoscale wind measurements using recalibrated ERS SAR images., 103: 7847-7856.
Lu, Y., Zhang, B., Perrie, W., Mouche, A. A., Li, X. F., and Wang, H., 2018. A C-band geophysical model function for determining coastal wind speed using synthetic aperture radar., 11: 2417-2428.
Masuko, H., Okamoto, K., Shimada, M., and Niwa, S., 1986. Measurement of microwave backscattering signatures of the ocean surface using X band and Ka band airborne scatterometers., 91: 13065-13083.
Monaldo, F., Jackson, C., Li, X. F., and Pichel, W. G., 2016. Preliminary evaluation of Sentinel-1A wind speed retrievals., 9: 2638-2642.
Mouche, A. A., and Chapron, B., 2015. Global C-Band Envisat, RADARSAT-2 and Sentinel-1 SAR measurements in copolarization and cross-polarization., 120: 7195-7207.
Mouche, A. A., Hauser, D., Daloze, J. F., and Guerin, C., 2005. Dual polarization measurements at C-Band over the ocean: Results from airborne radar observations and comparison with ENVISAT ASAR data., 43: 753-769.
Quilfen, Y., Bentamy, A., Elfouhaily, T., Katsaros, K., and Tournadre, J., 1998. Observation of tropical cyclones by high-resolution scatterometry., 103: 7767-7786.
Ren, L., Yang, J. S., Mouche, A. A., Wang, H., Wang, J., Zheng, G., and Zhang, H., 2017. Preliminary analysis of Chinese GF-3 SAR quad-polarization measurements to extract winds in each polarization., 9: 1215.
Rivas, M. B., Stoffelen, A., Verspeek, J., Verhoef, A., Neyt, X., and Anderson, C., 2017. Cone metrics: A new tool for the intercomparison of scatterometer records., 10: 2195-2204.
Shao, W. Z., Hu, Y. Y., Yang, J. S., Nunziata, F., Sun, J., Li, H., and Zuo, J. C., 2018a. An empirical algorithm to retrieve significant wave height from Sentinel-1 synthetic aperture radar imagery collected under cyclonic conditions., 10: 1367.
Shao, W. Z., Li, X. F., Hwang, P. A., Zhang, B., and Yang, X. F., 2017a. Bridging the gap between cyclone wind and wave by C-band SAR measurements.,122: 6714-6724.
Shao, W. Z., Sheng, Y. X., and Sun, J., 2017b. Preliminary assessment of wind and wave retrieval from Chinese Gaofen-3 SAR imagery., 17: 1705.
Shao, W. Z., Sun, J., Guan, C. L., and Sun, Z. F., 2014. A method for sea surface wind field retrieval from SAR image mode data., 13: 198-204.
Shao, W. Z., Yuan, X. Z., Sheng, Y., Sun, J., Zhou, W., and Zhang,Q. J., 2018b. Development of wind speed retrieval from cross-polarization Chinese Gaofen-3 synthetic aperture radar in typhoons., 18: 412.
Shao, W. Z., Zhang, Z., Li, X. M., and Wang, W. L., 2016. Sea surface wind speed retrieval from TerraSAR-X HH-polarization data using an improved polarization ratio model., 9: 4991-4997.
Shao, W. Z., Zhu, S., Sun, J., Yuan, X. Z., Sheng, Y. X., Zhang, Q. J., and Ji, Q. Y., 2019. Evaluation of wind retrieval from co-polarization Gaofen-3 SAR imagery around China seas., 18: 80-92.
Shen, H., Perrie, W., He, Y. J., and Liu, G., 2014. Wind speed retrieval from VH dual-polarization RADARSAT-2 SAR images., 52: 5820-5826.
Stoffelen, A., and Anderson, D., 1997. Scatterometer data interpretation: Estimation and validation of the transfer function: CMOD4., 102: 5767-5780.
Stoffelen, A., Verspeek, J. A., Vogelzang, J., and Verhoef, A., 2017. The CMOD7 geophysical model function for ASCAT and ERS wind retrievals., 10: 2123-2134.
Stopa, J. E., and Cheung, K. F., 2014. Intercomparison of wind and wave data from the ECMWF reanalysis interim and the NCEP climate forecast system reanalysis., 75: 65-83.
Thompson, D. R., Elfouhaily, T. M., and Chapron, B., 1998. Polarization ratio for microwave backscattering from the ocean surface at low to moderate incidence angles., 3: 1671-1673.
Vachon, P. W., and Dobson, F. W., 2000. Wind retrieval from RADARSAT SAR images selection of a suitable C-band HH-polarization wind retrieval model., 26: 306-313.
Vachon, P. W., and Wolfe, J., 2011. C-band cross-polarization wind speed retrieval., 3: 456-459.
Vogelzang, J., and Stoffelen, A., 2017. ASCAT Ultrahigh-resolution wind products on optimized grids., 10: 2332-2339.
Vogelzang, J., Stoffelen, A., Verhoef, A., and Figa-Saldana, J., 2011. On the quality of high-resolution scatterometer winds., 116: C10033.
Wackerman, C. C., Clemente-Colon, P., Pichel, W. G., and Li, X. F., 2002. A two-scale model to predict C-band VV and HH normalized radar cross section values over the ocean., 28: 367-384.
Wang, L., Han, B., Yuan, X. Z., Lei, B., Ding, C. B., Yao, Y. L., and Chen, Q., 2018. A preliminary analysis of wind retrieval, based on GF-3 wave mode data., 18: 1004.
Yang, X. F., Li, X. F., Zheng, Q. A., Gu, X., Pichel, W. G., and Li, Z. W., 2011. Comparison of ocean-surface winds retrieved from Quikscat scatterometer and Radarsat-1 SAR in offshore waters of the U.S. West Coast., 8: 163-167.
Zhang, B., Perrie, W., and He, Y. J., 2011. Wind speed retrieval from RADARSAT-2 quad-polarization images using a new polarization ratio model., 116: 1318-1323.
Zhao, Y., Li, X. M., and Sha, J., 2016. Sea surface wind streaks in spaceborne synthetic aperture radar imagery., 121: 6731-6741.
April 26, 2019;
June 21, 2019;
July 1, 2019
© Ocean University of China, Science Press and Springer-Verlag GmbH Germany 2019
. E-mail: shaoweizeng@zjou.edu.cn
(Edited by Xie Jun)
 Journal of Ocean University of China2020年1期
- Journal of Ocean University of China的其它文章
- Screening and Characterization of Nitrite-Degrading Bacterial Isolates Using a Novel Culture Medium
- Purification and Characterization of a Novel Lipase from Antarctic Krill
- Quality Assessment of Frozen Solenocera crassicornis Treated with Sodium Metabisulphite by Soaking or Spraying
- Contribution of Mesoscale Eddies to the Subduction and Transport of North Pacific Eastern Subtropical Mode Water
- An Effective Method of Prompting Juvenile Rainbow Trout (Oncorhynchus mykiss) to Cope with Heat Stress
- Half Smooth Tongue Sole (Cynoglossus semilaevis) Under Low Salinity Stress Can Change Hepatic igf2 Expression Through DNA Methylation
