Biofloc technology(BFT):Adjusting the levels of digestible protein and digestible energy in diets of Nile tilapia juveniles raised in brackish water
Emerson Giuliani Durigon,Rafael Lazzari,Juliano Uzay,Diogo Luis e Alântara Lopes,Gabriela Tomas Jerônimo,Tayna Sgnaulin,Mauríio Gustavo Coelho Emereniano,∗,1
a Santa Catarina State University(UDESC),Animal Science Postgraduate Program(PPGZOO/UDESC),Chapecó88035,Brazil
b Santa Catarina State University(UDESC),Nutrition Laboratory of Aquatic Organisms(LANOA/UDESC),Laguna 88035,Brazil
c Santa Maria Federal University(UFSM),Animal Science and Biological Sciences Department,Palmeira Das Missões,Palmeira Das Missões 88035,Brazil
d Santa Catarina Federal University(UFSC),Aquatic Organisms Health Laboratory(AQUOS),Aquaculture Department,Florianópolis 88035,Brazil
Keywords:
ABSTRACT
1.Introduction
Aquaculture is one of the agribusiness activities that has shown the highest growth rate in recent years and presents great potential to meet the growing demand for food specially animal protein(FAO,2016).Nowadays,most of aquaculture production comes from semi-intensive systems that need continuous water renewal,increasing the risks of pathogen spread and adverse effects on farm surrounding environment.In this sense,new technologies have been proposed to focus on crop intensification with minimal water discharge.Among these new approaches,biofloc technology(BFT)has been proposed as an alternative system which operates intensively with minimum or zero water exchange(Sgnaulin et al.,2018).The continuous aeration and water movement as well as the balance of nutrients(e.g.C:N and N:P ratio in water)enable the microbial aggregate's formation that helps in the(i)control of toxic nitrogen compounds;(ii)nutrition in a form of natural live food constinuosly available;and(iii)pathogen competition(Emerenciano,Martínez-Córdova,Martínez-Porchas & Miranda-Baeza et al.,2017,pp.92-109).
In addition,water can be reused(Krummenauer,Samocha,Poersch,Lara,&Wasielesky,2014),and nutrients in a form of uneaten feed and feces are recycled by the microbial community and reingested by cultured animals(Emerenciano,Ballester,Cavalli,&Wasielesky,2011).As a result,expenses in feed can be reduced by the ingestion of bioflocs(Azim & Little,2008)representing values around 20%-30%(Avnimelech,2007;Burford,Thompson,McIntosh,Bauman,&Pearson,2003).Furthermore,such reduction leads to reduction of environmental impact on fish/shrimp farm surroundings(Hargreaves,2013).
The microbial aggregates or bioflocs are formed by an inert fraction(feed remnants,feces and organic material)(Crab,Kochva,Verstraete&Avnimelech,2007)and live fraction composed by heterotrophic bacteria,chemoautotrophic bacteria,phytoplankton,protozoa,nematodes,rotifers,copepods and other microorganisms(Martínez-Cordoba,Emerenciano,Miranda-Baeza & Martínez-Porchas,2015).These bioflocs serve as natural rich food available 24 h a day;and helps on fish production(Hu et al.,2015),and dietary protein supplement as reported by Wasielesky,Atwood,Stokes,and Browdy(2006),Azim and Little(2008)and Xu and Pan(2014).
Tilapia(Oreochromis niloticus)is a species that is well accepted by worldwide consumers mainly because its white meat with firm texture and absence of intramuscular spines(Simões et al.,2007).This species present a rapid growth(El-Sayed,2006),resistance to different environments including culture on backwish water(Likongwe,Stecko,Stauffer,& Carline,1996),and can be easily adapted to intensive production systems(Avnimelech,2007).In addition,tilapia posses omnivorous and filtering feeding habit which contributes to adaptation to natural food-rich environments(Fitzsimmons,Martinez-Garcia,&Gonzales-Alanis,2011).
Although well domesticated and production expanding globally(FAO,2016),tilapia aquaculture still faces technological challenges.One example is the nursery phase which normally faces high levels of mortality and slow growth when raised in high densities.In this sense,the application of BFT in such critical phase might represent(i)an increase in number of cycles per year;(ii)improvement on biosecurity;and(iii)better control on feeding management(Avnimelech,2007).A second issue is related to juveniles diets with proper dietary protein and energy levels(Furuya et al.,2005).Although many studies evaluated the ideal levels of digestible protein and digestible energy in tilapia juveniles in clear-water systems(Furuya,2010;Furuya et al.,2005;Furuya,Hayashi,Furuya,& Soares,2000;Gonçalves,Pezzato,Barros,Julia,&Rosa,2009),commercial diets still contain high levels of crude protein which could compromise water quality and consequently fish performance.
The application of biofloc technology in tilapia culture has demonstrated great potential as observed with different tilapia species and stocking densities(Brol et al.,2017;Ekasari & Maryam,2012;Haridas,Verma,Rathore,Prakash,& Banerjee,2017;Lima,Souza,Wambach,Silva,& Correa,2015),performance on grow-out and overwintering(Avnimelech,2007;Crab,Kochva,Verstraete,&Avnimelech,2009),larval phase(Ekasari et al.,2015),fingerlings production(García-Ríos,Miranda-Baeza,Coelho-Emerenciano,Huerta-Rábago,&Osuna-Amarillas,2019),broodstock formation(Ekasari et al.,2015),carbon-nitrogen ratio and carbon sources(Pérez-Fuentes,Hernández-Vergara,Pérez-Rostro,& Fogel,2016;Zhang,Luo,Tan,Liu,& Hou,2016),and even integrated with aquaponics(Pinho,Molinari,de Mello,Fitzsimmons,& Emerenciano,2017).Although some studies also evaluated different crude protein levels in BFT in freshwater(Abdel-Tawwab,Ahmad,Khattab,& Shalaby,2010;Azim & Little,2008;Silva et al.,2018),none of them identified the ideal digestible protein and digestible energy levels in backwish water.Thus,the objective of the present study was to evaluate levels of digestible protein and digestible energy(22%,26%and 30%PD and 3000,3150 and 3300 kcal ED/kg,respectively)on the zootechnical performance,hematological aspects and carcass composition of Nile tilapia juveniles(Oreochromis niloticus,GIFT strain)in biofloc backwish water(10).
2.Material and methods
The experiment was carried-out at the Aquaculture Laboratory(LAQ),Santa Catarina State University(UDESC),Laguna,Santa Catarina,Brazil.Nile tilapia fingerlingsOreochromis niloticus(GIFT strain)were obtained from a commercial hatchery.The animals were transported in specific plastic bags and acclimated for one week until the beginning of the experiment.
2.1.Experimental design
A total of 540 all-male fingerlings(1.25±0.15 g initial weight)were stocked in 36 experimental units(circular polyethylene tanks with a useful volume of 75L)equally distributed in three benches(12 units each bench).The experiment had a factorial design(digestible protein and digestible energy as factors)constituted with different combinations of digestible protein levels(22%,26% and 30% of PD)and three different digestible energy levels(3000,3150 and 3300 kcal/kg of DE),totaling nine treatments with four replicates.
The experimental units were disposed in a“macrocosm-microcosms”system(Emerenciano,Cuzon,Arévalo,Miquelajauregui,&Gaxiola,2013;Sgnaulin et al.,2018;Wasielesky et al.,2006)in which each bench contained a matrix tank(1000L circular polyethylene tanks called macrocosm)connected to the experimental units(microcosm).In addition,the macrocosms were also to connected each other aiming to maintain water homogeneity between the experimental units and benchs;and to keep the same qualitative-quantitative profile of microorganisms(Emerenciano et al.,2007;Neto et al.,2019).
Each bench received an initial biofloc inoculum(300L)from a previous BFT tilapia culture(normally kept with 10-30 mL/L of setling solids),~700L of tap water(dechlorine)and 300L of 35 sea water,resulting a final salinity of 10.During the acclimation process the salinity was gradually increased until it reached 10(1-1.5 per day).For formation and maintenance of the microbial community(bioflocs),a fish biomass of 2.5 kg/m3(tilapia juveniles of~70 g)was maintained in each macrocosm tank;and fed with commercial feed(32%CP)twice per day(8:00 a.m.and 6:00 p.m.)and a C:N ratio of 15:1(Emerenciano,Martínez-Córdova,Martínez-Porchas,& Miranda-Baeza,2017,pp.92-109)where sugar cane molasses(powder)was daily added as an external carbon source.
Regarding to aeration and water movement,the experimental units had one porous air stone diffuser(20 mm of diameter and 30 mm of height)and on each macrocosm the aeration was achieved by a ring of micro-perforated hose(Aerotube® 70 cm of perimeter),located centrally at the bottom of the tank.Each macrocosm tank had two 200 W heaters(control of water temperature)and a submerged pump(80 W,3.500 L/h1)which pumped water into the respective bench,returning by gravity.
2.2.Food management and preparation of diets
All diets were formulated and processed at the Nutrition Laboratory of Aquatic Organisms(LANOA/UDESC),based on ideal protein concept(Furuya et al.,2005).The formulations(isophosphoric and isocalcitic)maintained the established levels of digestive protein(DP,%)and digestible energy(DE,kcal/kg)as followed 22:3000,22:3150,22:3300,26:3000,26:3150,26:3300,30:3000,30:3150 and 30:3300,respectively.The feedstuffvalues of digestible protein and digestible energy were based on values described by Furuya(2010).The feed manufacturing,ingredients composition and nutritional characteristics are described in Durigon,Almeida,Jerônimo,Baldisserotto and Emerenciano(2019).
The fish were fed three times per day(8:00 a.m.,1:30 p.m.,and 6:00 p.m.)with 8%of the biomass in the first two weeks and after 5%of the biomass.At the end,the following performance parameters were analyzed:final weight(g),survival(%),specific growth rate(%/day),yield(kg/m3),feed conversion ratio(FCR)and protein efficiency ratio.
2.3.Water quality parameters
Water quality parameters,such as dissolved oxygen,temperature(both measured with an oximeter YSI-55,Yellow Springs Instruments,OH,USA)and pH(Tecnopon®-Mpa-210,SP,Brazil)were monitored daily(macrocosms and microcosms).Total ammonia nitrogen(TAN),nitrite(N-NO2),nitrate(N-NO3),orthophosphate(PO43-)and totalalkalinity(CaCO3)were analyzed twice a week(macrocosms).Nitrogen compounds were analyzed using a photocolorimeter(AT 100P,ALFAKIT,Florianópolis,SC,Brazil).Total alkalinity was determined by means of a method of volumetric titration,with a commercial kit(ALFAKIT cod.2058 and 2460).The settling solids(biofloc volume)was measured daily using an 1000 mL Imhoffcone by means of sedimentation of a 1 L water sample for 20 min according to the methodology described by Eaton,Cleserci,and Greenberg(1995).

Table 1 Water quality descriptive statistics(average,standard deviation,maximum and minimum values)of tilapia Oreochromis niloticus juveniles fed with different levels of digestible protein(%)and digestible energy(kcal/kg)raised in biofloc system with 10 ppt of salinity during 42 d.
2.4.Hematological analyzes and somatic indexes
At the end of the experiment,ten fish per treatment were anesthetized with eugenol(1 mg/L)for blood sampling by caudal vein puncture,with the aid of syringes containing EDTA 10%.The percentage of hematocrit(Goldenfarb,Bowyer,Hall,& Brosious,1971)and hemoglobin concentration(Collier,1944)were performed;and the total erythrocytes count was evaluated on a Neubauer chamber after dilution(1:200)on a formaldehyde-citrate solution(Ranzani-Paiva,Pádua,Tavares-Dias,& Egami,2013).For total plasma protein(TPP)analyzes,blood samples were separated into microtubes and centrifuged at 1465gfor 10 min and determined by colorimetric methodology(Analisa® kit).Total leukocytes(LEU)count and differential counting of leukocytes were obtained from the smears stained with May-Grunwald/Giemsa(Rosenfeld,1947)by the indirect method(Ishikawa,Ranzani-Paiva,& Lombardi,2008).Mean corpuscular volume(MCV)and mean corpuscular hemoglobin(HCM)were also calculated.
After blood sampling,fish were euthanized by approved methods of the CONCEA-Brazil(National Council of Animal Experimentation Control)and somatic indexes were performed as followed:standard length(cm),condition factor,viscerossomatic index(VSI=viscera weight(g)×final weight(g)-1×100)and hepatossomatic index(HSI=liver weight(g)×final weight(g)-1×100)and carcass yield(%).
2.5.Proximate analyzes of fish carcasses and biofloc
The dry matter,crude protein,crude lipid and ash content from biofloc and fish carcass(from hematological analyzes and storaged in-20℃)were analyzed according to methodology proposed by AOAC(1999).To determine the lipid content,Bligh and Dyer(1959)technique was applied.For the bioflocs,~400 L of biofloc-rich macrocosms water was settled(~60 min)and the supernatant discharged.This operation was repeated several times until a biofloc biomass of approximately 100 g was reached with minimum amount of water.This biomass was dried(oven drying at 55℃ for 72 h)and stored(-20℃)for further analysis.
2.6.Counting and identification of planktonic community
In order to characterize the profile of planktonic communities in the biofloc,weekly water samplings were performed in each macrocosm,totaling three samples per collection.Each sample(50 mL)was fixed in 4% formalin and stained with 1% Rose bengal for later counting and identification.Metazoa were counted and identified under a stereomicroscope(Bioptika,model L20T,Bioptika,Colombo,PR,Brazil)in a reticulated Petri dish.For the other groups of microorganisms,(microzooplancton),two 1mL homogenized aliquots were taken and screened using a Sedgewick-Rafter chamber under a microscope(20×)(Azim & Little,2008;Emerenciano et al.,2013).Fifty chamber spaces were counted for each sample and identified to the lowest taxonomic level according to Barnes(1990).
2.7.Statistical analysis
Once the assumptions of normality(Shapiro Wilk's test)and homogeneity(Leven's test)of variances were met(Sokal & Rohlf,1995),two-way ANOVA was applied to zootechnical parameters and one-way ANOVA for water quality parameters(over time)and planktonic community.Significant differences were verified by the Tukey test(Sokal & Rohlf,1995),considering a 5% significance level.The percentage values were transformed(arcosene of square root)before the analysis(Zar,1996),although original data were presented.
3.Results
3.1.Water quality parameters
Descriptive statistics of water quality parameters(means,SD,maximum and minimum values)are presented in Table 1.Dissolved oxygen(~6.1 mg/L),temperature(~26.3℃)and pH(~7.5)were similar between treatments and macrocosms.The fluctuation over time of nitrogen compounds,orthophosphate,alkalinity,and biofloc volume are shown in Fig.1.Although differences were not detected over time(P>0.05)ammonia(~0.3 mg/L)and nitrate(~0.3 mg/L)were stable until week 4 and then dropped to~0.1 mg/L.Orthophosphate(~17 mg/L)and settling solids(~10 mL/L)significantly increased over time.Nitrite and alkalinity reached a peak in the week 4 with values of 0.06 and 100 mg/L respectively,and then dropped over time.
3.2.Zootechnical performance and somatic indexes
There was no interaction(protein×energy)for the variables of zootechnical performance(Table 2).No effect was observed according to different digestible energy(P>0.05).For final weight,specific growth rate(SGR),yield and protein efficiency ratio(PER)were affected by digestible protein levels(P<0.05).The fish fed with 22%DP was lower than 26 and 30% DP for final weight and SGR.Higher PER was observed in 22 and 26% DE(P<0.05)and yield was statiscally higher in 26%as compared to 22%DP while 30%did not differ from the previous ones.
There was no interaction(protein×energy)for the parametersanalyzed.For the standard length(SL),the two lowest energy levels(3000 and 3150 kcal DE)presented higher values.At levels of 26%DP,SL was significantly higher compared to 22%(P<0.05).HSI was higher in treatments containing 22% DP whereas CF was lower at the 22% level of DP(Table 3).
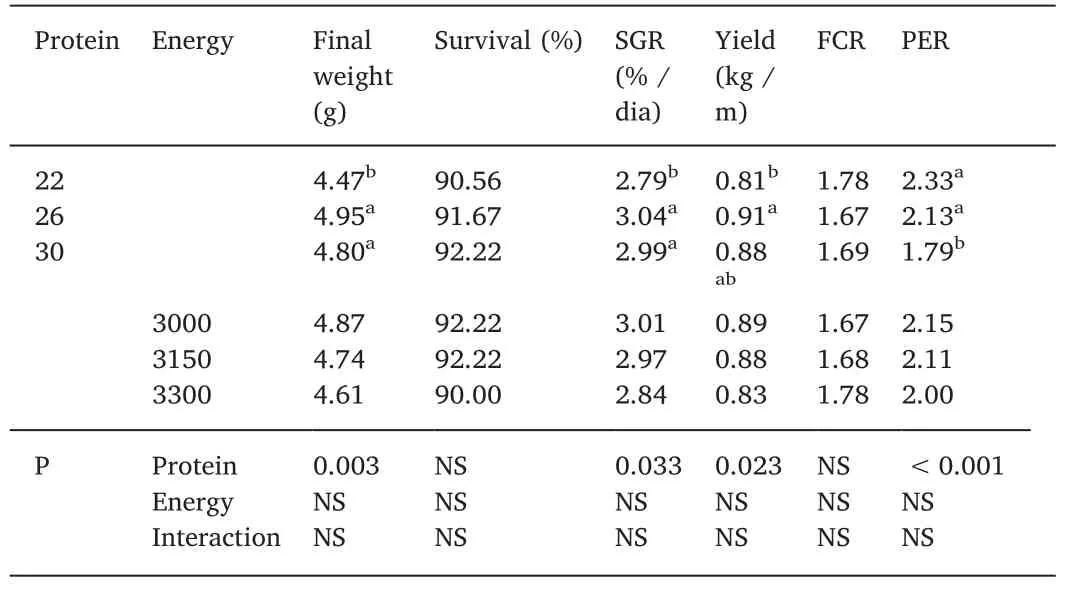
Table 2 Zootechnical performance(average±SD)of tilapia Oreochromis niloticus juveniles fed with different levels of digestible protein(%)and digestible energy(kcal/kg)raised in biofloc system with 10 of salinity after 42 d.
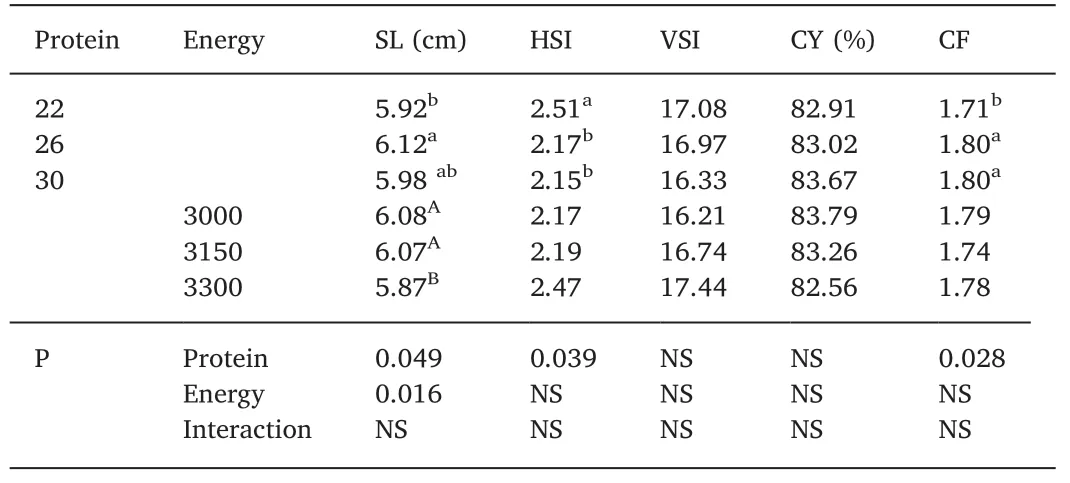
Table 3 Somatic indexes(average±SD)of tilapia Oreochromis niloticus juveniles fed with different levels of digestible protein(%)and digestible energy(kcal/kg)raised in biofloc system with 10 of salinity after 42 d.
3.3.Proximate composition
In Table 4 is presented the results of proximate composition of biofloc biomass and fish carcass.Regarding to biofloc biomass,the proximate analysis(basis on dry matter)showed 1.22%±0.09% for crude lipid,17.39%±0.20% for crude protein and 28.84%±0.67%for ash content.Related to fish composition(carcass),interaction was detected in crude protein and crude lipid,and were tested in Fig.2.The results demonstrated at 22%DP level as the energy increased there was an increase in the lipid content in the carcass;the same was not observed at the DP 26%level where the level of 3300 kcal DE was equal to the others levels.The dry and mineral matter contents were not influenced by the treatments.The crude protein content(carcass)increased as the increase of DP in the diet.In addition,crude lipid in the carcass increased as the DE increase in the diet.
3.4.Hematological parameters
There were no differences in hemoglobin concentration,MCH,leukocytes and lymphocytes(Table 5).For erythrocytes and MCV there were difference only on energy levels.There was an increase in the number of monocytes in fish fed diets containing 26% DP as compared to 30% DP.The number of neutrophils was influenced by digestible protein levels,where animals fed with 26% DP showed higher values(P<0.05).For hematocrits and TPP,there was interaction between protein and energy levels as presented in Fig.3.High percentage of hematocrit was found in 22%DP and 3000 kcal DE.The overall results demonstrated that 3150 kcal DE with a same level of DP increased the TPP;and high levels of dietary DP did not cause an increased of TPP.
3.5.Characterization of planktonic community
During the six weeks,protozoa,nematodes,rotifers,copepods,dinoflagellates and microalgae were identified.The most frequent groups are shown in Fig.4.The number of rotifers and dinoflagellates increased over time,with a decrease of rotifer community at the end.The protozoa community showed a decrease in the third week,with a significant increase in the sixth week.On the other hand,the microalgae had greater variation over time decreasing in number at the end.
4.Discussion
4.1.Water quality
The water quality parameters remained within recommended levels for the species(El-Sayed,2006),and similar to those found by Azim and Little(2008)withO.niloticusin BFT system.As expected no high oscillation over the six weeks in the ammonia levels was observed and demonstrates the advantage of the biofloc system since the microorganisms present in the water can control this toxic compound(Kishida,Tsuneda,Sakakibara,Kim,& Sudo,2008).In addition,the inoculation of mature biofloc water before the experiment began guaranteed low levels of nitrite(one of the most harmful compounds presented in closed systems)as observed by Krummenauer et al.(2014).
Regarding to alkalinity this parameter decreased in the sixth week compared to the fourth one,this can be explained by chemical reaction of heterotrophic assimilation and significant increase of biofloc volume after the third week.In addition,the growth of nitrifying bacteria also contribute to the alkalinity decrease(Ebeling,Timmons,& Bisogni,2006).Although a decrease in alkalinity levels was observed,the high concentration of dissolved oxygen(>6.0 mg/L)as well as stable pH(~7.6)migh guaranteed low levels of toxic N-compounds over time(Emerenciano et al.,2017,pp.92-109).
An increase of settling solids after the second week was also found by Brol et al.(2017)and Sousa,Pinho,Rombenso,de Mello,and Emerenciano(2019)both with tilapia juveniles.After this stage,a higher production of bioflocs was observed probably due to continuous carbon source addition(powder molasses)and feed input;although limit levels was not exceeded(50 mL/L according to Hargreaeves,2013).The accumulation over time of nitrate and orthophosphate were expected and remains in normal levels for biofloc technology systems(Emerenciano et al.,2017,pp.92-109).
4.2.Zootechnical performance and somatic indexes
Previous studies on protein requirement of tilapia carried-out in clear-water systems demonstrated ideal values ranging from 27% to 29% DP(Furuya et al.,2005;Furuya et al.,2000;Gonçalves et al.,2009;Junior et al.,2016).Our study showed that is possible to cultivate tilapia in brackish biofloc systems using dietary digestible protein of 26% and low levels of energy(in our case 3000 kcal DE/kg)without losses in performance.Furuya(2010)suggested an energy to protein ratio of 10:1.In our study,a ratio of 11.5:1 was achieved using 26%DP and the lowest DE level.Although it was not evaluated,the authors believe that even a lower DE level could be applied in similar conditionsas biofloc represented a continuous source of natural food that contribute to nutrition of tilapia.In the present study,proximate analysis performed in biofloc biomass revealed values of 17.39%±0.20% of crude protein,and 1.22%±0.09% of crude lipid,similar to other biofloc studies(Emerenciano et al.,2013).

Table 4 Proximate composition(average±SD)of biofloc biomass and tilapia Oreochromis niloticus juveniles(carcass)fed with different levels of digestible protein(%)and digestible energy(kcal/kg)raised in biofloc system with 10 of salinity after 42 d.
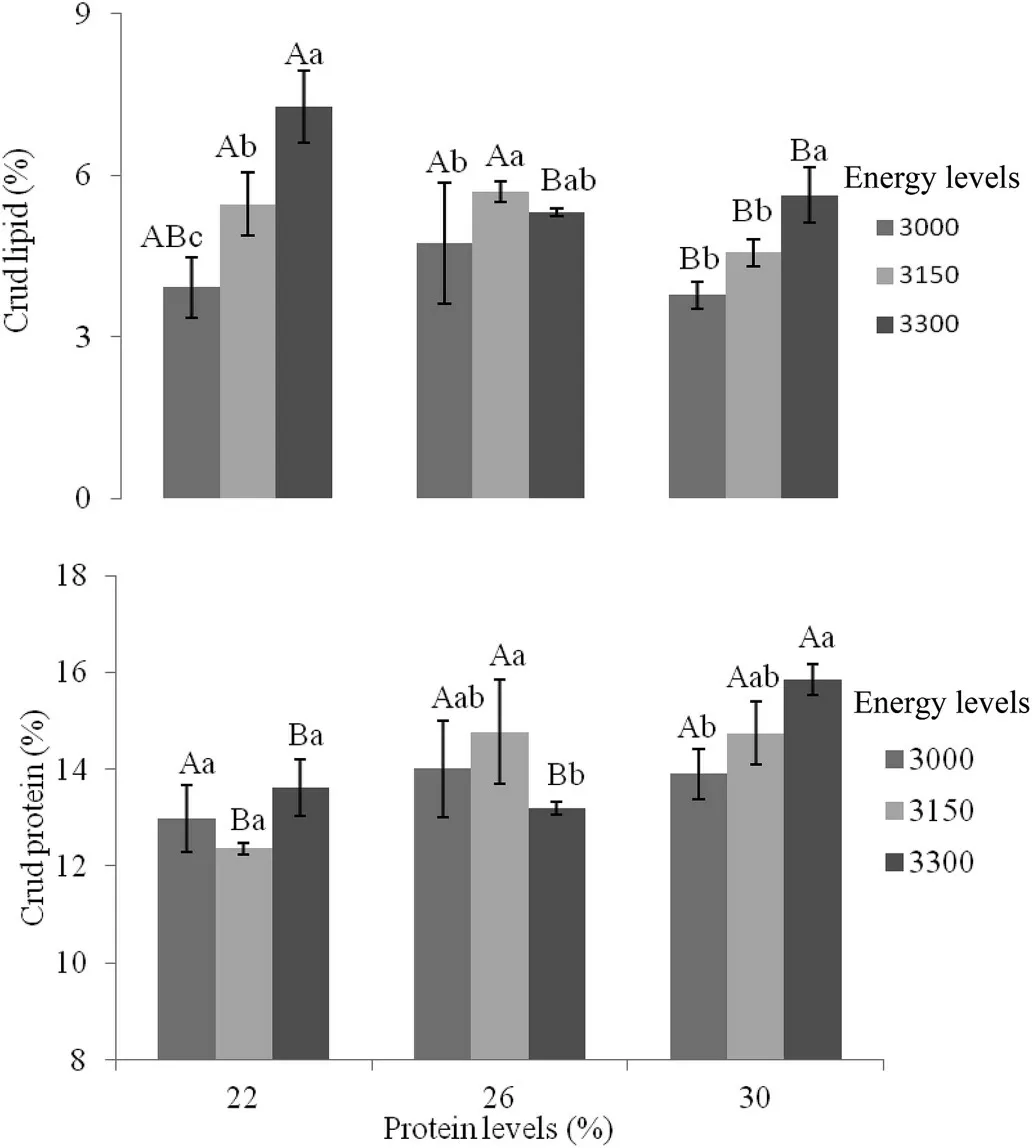
Fig.2.Average±SD of crude lipid(%)and crude protein(%)of tilapia Oreochromis niloticus juveniles(carcass)fed with different levels of digestible protein(%)and digestible energy(kcal/kg)raised in biofloc system with 10 of salinity after 42 d.Lowercase letters indicate differences in energy levels within the same protein level;capital letters indicate differences in protein levels within the same energy level(P<0.05).
The reduction of crude protein levels for tilapia in biofloc systems has also been demonstrated by Azim and Little(2008)with~100 g juveniles and reduction from 35% to 24% CP;and Silva et al.(2018)evaluating two phases of tilapia cultivation 10-60 g and 60-230 g.The authors observed that fish can be fed on diets with 28%of CP and 22%CP,respectively,without compromising the fish growth.On the other hand,literature evaluating the effect of digestible protein in combination with digestible energy in BFT is scarce.Low energy levels can cause serious metabolism issues since protein will be used as an energy source increasing feed conversion ratio,ammonia excretion and limiting the somatic growth(Furuya et al.,2005;Pezzato et al.,2002).In contrast,high energy levels may limit the consumption of macronutrients and affects the overall fish performance(Boscolo et al.,2005;Gonçalves et al.,2009).
Studies on the protein-energy ratio for tilapia present results with large changes.Generally,these studies are performed with feed until satiation feeding.When a reduction of the protein:energy ratio occurs,an increase in consumption is expected(Haidar,Bleeker,Heinsbroek,&Schrama,2018).In BFT system,it is not possible to accurately measure food consumption.However,due to the performance of the fish with lower protein(22% and 26% DP),it is possible to reduce feed costs in this system.In rearing semi-intensive ponds,tilapia fed with low P:E diet,consumed more natural foods to compensate for the lower nutrient input through the formulated feed(Haidar et al.,2018).
Future studies should also take into account the diet composition,especially in relation to dietary lipids and carbohydrates.Recent study(Boonanuntanasarn et al.,2018)showed that omnivorous fish as tilapia features differences in the regulation of the gluconeogenic and lipogenic pathways by the effect of dietary carbohydrates levels.
The hepatosomatic index(HSI)was influenced by the protein level,in which lowest level of digestible protein presented the highest HSI.The same trend was found by Gallagher(1999)and it can be explained due to a form of compensation.In a situation of lower availability of dietary protein the body need to adapt increasing the liver size to metabolize as much protein as possible.Santos et al.(2018)observed similar results evaluating protein levels forProchilodus argenteus.In addition,the higher digestible protein levels(26% and 30% DP)also positively influenced the condition factor(FC).The FC provides important information about the physiological state of the animals(Limajunior,Cardone,& Goitein,2002).Regarding to protein efficiency,as expected the lower levels of 22 and 26 were more efficient promoting less protein waste.It is important to note that feed frequency(Furuya et al.,2005)and the presence of“biofloc”as continuous natural food(Martínez-Córdova,Emerenciano,Miranda-Baeza,& Martínez-Porchas,2015)certainly contributed to this result.
4.3.Proximate composition of fish
A higher content of lipid in the fish carcasses fed with high dietary protein(30% DE)and high energy(3300 kcal DE)was observed.This fact can be explained due to greater amount of amino acids forcatabolism,which may result in a higher caloric increment and fat deposition(Dabrowski&Guderley,2002).The exceed dietary protein is broken and destined to gluconeogenesis leading to greater accumulation of fat.In addition,diets with high amount of energy is also related to fat accumulation and production of adipose tissue(NRC,2011).Sousa et al.(2019)observed that high dietary levels of pizzeria carbohydrates-rich by-product decrease the body protein content of fish.Yamamoto,Sugita,and Furuita(2005)observed a high protein content with low body fat of fish fed with low protein level(lower DCP:DE ratio)in trout(Oncorhinchus mykiss).Meyer and Fracalossi(2005)observed that body fat was higher(P<0.05)in fish which were fed with higher energy diet.Body fat was also higher in blue tilapiaOreochromis aureus(Wille,McLean,Goddard,& Byatt,2002)and surubinsPseudoplatystoma coruscans(Martino,Cyrino,Portz,& Trugo,2002)fed with high dietary energy levels.In the present study,a clear interaction between dietary digestible protein to digestible energy levels was observed modulating the lipid and protein carcass deposition.The biofloc composition may also have interfered in the composition of the fish carcass since biofloc is a protein/lipid-rich food item(Emerenciano et al.,2013).The fatty acid composition of biofloc has already been studied by Azim and Little(2008)detecting a great quantity of polyunsaturated fatty acids(PUFAs)n-3 andn-6,the last one crucial in tilapia nutrition.More studies are needed to clarify the importance of biofloc as energy and protein sources in tilapia nutrition.

Table 5 Hematological parameters(average±SD)of tilapia Oreochromis niloticus juveniles fed with different levels of digestible protein(%)and digestible energy(kcal/kg)raised in biofloc system with 10 of salinity after 42 d.
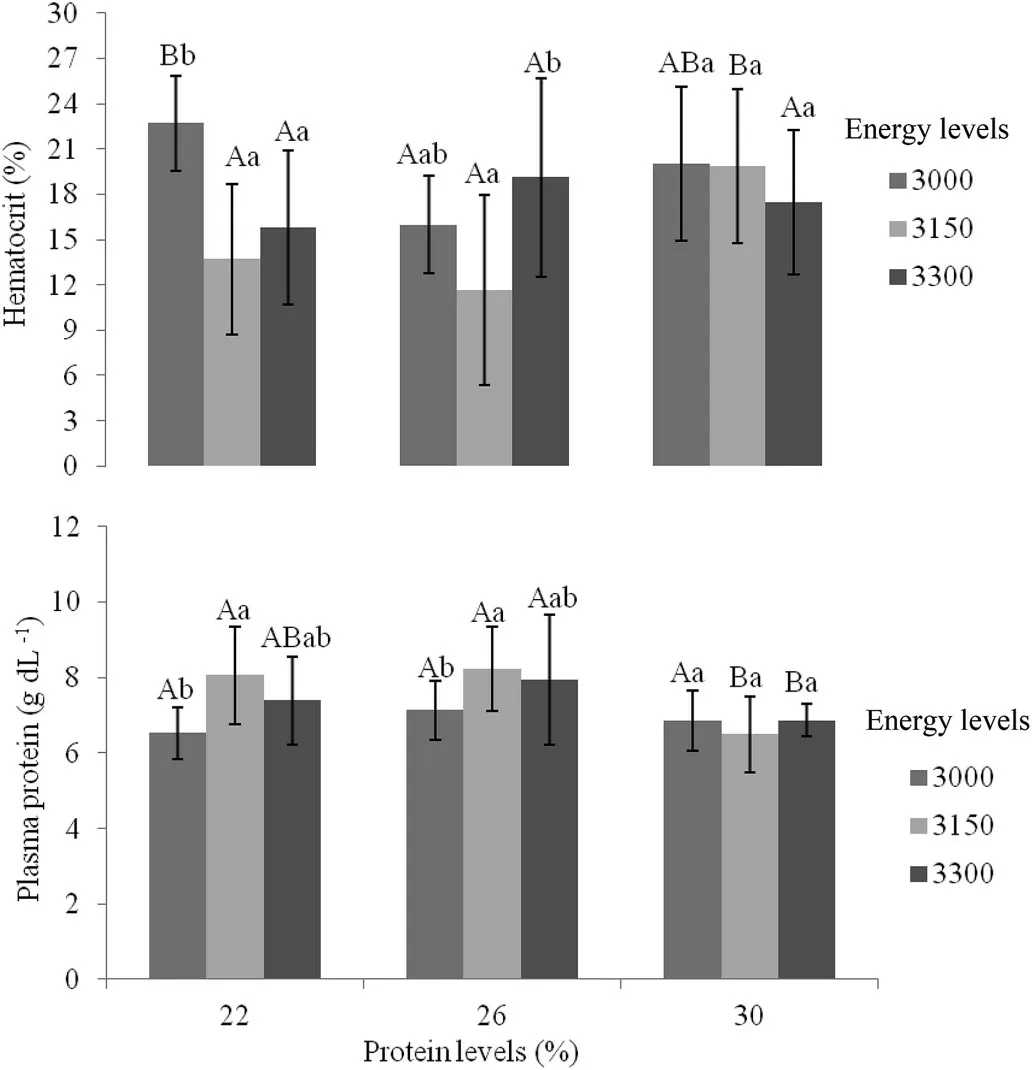
Fig.3.Average±SD of blood hematocrit(%)and total plasma protein(g/dL)of tilapia Oreochromis niloticus juveniles fed with different levels of digestible protein(%)and digestible energy(kcal/kg)raised in biofloc system with 10 of salinity after 42 d.Lowercase letters indicate differences in energy levels within the same protein level;capital letters indicate differences in protein levels within the same energy level(P<0.05).
4.4.Hematology analysis
In the present study,the different digestible protein and digestible energy levels did not interfere in hemoglobin,mean corpuscular hemoglobin,leukocytes,and lymphocytes.On the other hand,the energy levels did influence the MCV and the number of erythrocytes suggesting a compensatory effect of the body by reducing the number of erythrocytes.This cascade effect may increase the MCV and reduce the damage caused by decline of red cells allowing the transport of O2in desirable levels to the issues.Moreover,regarding to protein levels an interesting pattern was observed in monocytes and neutrophils concentration with high levels in the treatment with 26%DP.These results may indicate an improvement on the defense system since these cells are responsible for the immune response against pathogens(Antunes,Rossi,Inoue,Neto,& Lir,2017).

Fig.4.Fluctuation over time(average±SD)of planktonic community(microorganisms/L)during 42 d in tilapia Oreochromis niloticus juveniles raised in biofloc system with 10 of salinity.
For total plasma protein(TPP)an interaction was detected and the results demonstrates that high levels of dietary DP did not cause an increase of TPP.This results demonstrated that the need of a correct balance between DP and DE to increase plasma protein levels.Once unbalanced,TPP can be used as an amino acid sources by cells(Wu,2013).In our study,22% and 36% DP with proper energy levels(3150 kcal of DE/kg)presented the highest levels of TPP.In addition,percentage of hematocrit was significantly affected by the treatments.Once the DP:DE ratio is unbalanced,an increase of oxygen transport might occur possible due to nutritional stress(Morales,Cardenete,Abellán,&García-Rejón,2005).However,at 3150 kcal of DE/kg it was observed an increase in hematocrit when compared to the 30% DP treatment with 22% and 26% DP.This fact can be explained due to a higher oxygen requirement of the organism to degrade proteins,also corroborated by Camargo,Pouey,and Martins(2005).The presence of bioflocs(nutrient-rich)may also influence on the hematology parameters and certainly more studies are needed to clarify these effects.
4.5.Planktonic community
The microorganisms profile varied over time and can be caused by differences on luminous intensity,predator/prey ratio(rotiferous and dinoflagellates/microalgae),competition for substrate,consumption of microorganism by fish,among others(Emerenciano et al.,2013).The microalgae community decreased over time possibly due to reduction on light penetration as a result of increase of turbidity(bioflocs).A second factor may be attributed to the rotifers predation and their increase over time(Martínez-Córdova et al.,2015).In addition,as a result of microalgae decrease dinoflagellate might took advantage and such population increased over time.
The accumulation of organic matter over time as well as the continuous addition of carbon source contribute to heterotrophic bacteria development(Avnimelech,2007)and could influence the protozoa growth.Protozoa community is an important food item in biofloc system and can contribute to fish and shrimp growth(Martínez-Córdova et al.,2015).A higher abundance of protozoa community in biofloc system for tilapia was also observed by Azim and Little(2008),Monroy-Dosta,Lara-Andrade,Castro-Mejía,Castro-Mejía,and Coelho-Emerenciano(2013),Pinho et al.(2017)and Brol et al.(2017).
5.Conclusion
The results indicated that is possible to use diets containing 26%of DP and 3150 kcal/kg of DE for Nile tilapia juveniles without losses on health and growth performance when reared in brackish biofloc water.
 Aquaculture and Fisheries2020年1期
- Aquaculture and Fisheries的其它文章
- The effects of on-farm produced feeds on growth,survival,yield and feed cost of juvenile African sharptooth catfish(Clarias gariepinus)
- Comparison of juvenile growth of wild and hatchery-raised olive flounders Paralichthys olivaceus as examined by otolith microstructure
- Identification and histopathological and pathogenicity analysis of Aeromonas salmonicida salmonicida from goldfish(Carassius auratus)in North China
- Identification and modulation of expression of a TNF receptor superfamily member 25 homologue in grass carp(Ctenopharyngodon idella)
- Probiotics in shellfish aquaculture
