Simulation of Irregular Wave Uplift Force on Horizontal Plate Structures
(Naval Architecture and Ocean Engineering Department,Jiangsu University of Science and Technology,Zhenjiang 212003,China)
Abstract:By numerical simulation,two-dimensional irregular wave numerical models are established based on the software FLUENT,then the mechanisms of quasi-static force when waves impact on horizontal plate structures are explored. RANS equations are adopted. The standard k - ε equations are used to close the Reynolds equations.VOF method is used to reconstruct the free surface.Firstly,several typical cases of wave slamming on horizontal plate structures are reproduced. Low-pass filter method is used to obtain the quasi-static pressure from the uplift force signals. The models are verified by experimental data and the wave impact process can be displayed visually. With calculations,the characteristics of quasi-static force in the wave impact are investigated, and the distribution rules of the quasi-static force are obtained. The parametric studies have been carried out for different wave steepness, relative clearance and relative structure length, then the influences of the three parameters on the quasi-static force are analyzed.Finally,the distribution width formulas of quasi-static pressure are given, which are concerned with factors of the wave width acting on the plate, relative clearance and relative structure length.In addition,the quasi-static force formulas provided are more reasonable and feasible, compared with the original calculation formulas of Hohai University. The work is significant for accurately predicting quasi-static load and understanding more mechanisms of wave impact.
Key words:irregular wave;horizontal plate structure;quasi-static force;distribution width;numerical simulation;FLUENT
0 Introduction
Wave slamming on large scale panel is a very complex process, and the duration curve of the wave pressure is periodic,which includes a low frequency pressure and a high frequency instantaneous impulse pressure, as shown in Fig.1. The mechanisms of actions of the two pressures are not the same, the quasi-static pressure may cause the whole superstructures to collapse,and the impulse pressure may damage part of the superstructures.For high rigidity structures of coastal engineering,the impulse pressure is secondary because of its short duration and small impulse, and the quasi-static pressure is the main part of the wave uplift forces. At present, most researches are concerned with the impulse pressure, such as Toumazis et al (1989)[1], Kaplan et al (1976, 1992,1995)[2-4], Bea et al (2001)[5], Bradner(2008)[6]and Kisacik et al (2012a, 2012b,2014)[7-9], and less about the quasi-static pressure. Wang (1970)[10]carried out wave pressure tests on the horizontal hanging plates and showed the quasi-static pressure associated with wave surface height and wave cycle. Shih et al (1992)[11]studied the simple large scale platform and provided the quasi-static formulas under regular and irregular waves. Tirindelli et al (2002, 2003)[12-13], Mc-Connell et al(2003,2004)[14-15]and Cuomo et al(2003,2005)[16-17]proposed formulas for vertical quasi-static pressure through irregular wave tests on horizontal plate structures. Huang(2008)[18]put forward the empirical formula of the quasi-static pressure under irregular waves with tests.
In many previous studies, the impulse pressure and quasi-static pressure are seldom distinguished and generally taken as the whole wave uplift force. There are not too many specialized researches for the quasi-static pressure, and the existing empirical formulae show that there is a function relationship between the pressure and (η- Δh) (ηis the wave surface height, Δhis the clearance in structures). Due to the fact that the number and value of coefficient in each formula are not identical, the results of all existing empirical formulas present great difference. In addition, the physical model test is always adopted as the main research method, yet the current test equipment and conditions still have drawbacks, for example the sampling frequency is so lower that the peak values during wave action cannot be effectively obtained.Therefore,the results of tests need to be verified and improved with other methods.
With the development of computer and numerical calculation techniques,numerical simulation has become another important method to study the problem of wave action,such as Baarholm (2005)[19], Ren et al (2009, 2012)[20-21], Sun (2011)[22], Guo et al (2012)[23], Hirdaris et al(2014)[24],Gao et al(2015)[25]and Hu et al(2015)[26].Compared with physical model test,numerical simulation has many advantages such as relatively less investment, relatively shorter period and easily-changed parameters. It overcomes a number of limitations of physical model test and is gradually taken as an effective method to study the wave slamming problems. The two methods can also verify and complement each other. So these advantages of numerical simulation should be made full use of for further researches to deeply understand the characteristics in the process of wave slamming on structures.
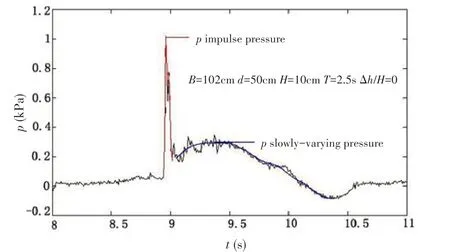
Fig.1 Characteristic pressure profiles of wave pressure
This paper mainly adopted the method of numerical simulation, and combined with physical model test results of Chen et al (2009)[27],Meng et al(2014)[28]and Huang(2008)[18]in analysis. Two-dimensional irregular wave numerical models were established based on the software FLUENT and the process of wave slamming on horizontal plate structures was reproduced. In the simulation, the higher sampling frequency was adopted to get the peak values during wave slamming,more measuring points were distributed under structures to study the lateral pressure distribution, while the physical model test method would not meet such demand. The quasistatic force in the wave impacting was the main focus of the study.At last,the formulas of distribution width of quasi-static pressure were provided and the quasi-static pressure formulas were proposed.The work is significant for understanding more impact mechanisms about quasistatic pressure and provides reference for engineering research and design.
1 Existing calculation formulas
Huang (2008)[18]suggested the irregular wave quasi-static pressure on horizontal plate structures could be calculated as follows:

where the curve slope is 0.74,the correlation coefficient is 0.87,and the slope of the 90%envelope line is 0.92.is the 1/3 average peak value,γis the water weight per unit volume,Δhis the clearance in structures,andηis the wave surface height.ηis calculated as follows:

whereHis the wave height,Lis the wave length,dis the water depth,ch()is the hyperbolic cosine,sh()is the hyperbolic sine.
Huang (2008)[18]considered the pressure distribution on the plate was mostly uniform, the width of which is aboutL/4.
2 Establishment and validation of numerical wave flume
2.1 Governing equations
During wave impact, the fluid is in turbulent motion and the turbulence effect cannot be neglected in wave breaking models.Therefore,the Reynolds equations are used to solve the fluid flow and ak-εmodel is used to close the Reynolds equations. The VOF method is used to track the free surface.
The continuity equation and the RANS equations are as follows:

wherei= 1,2,j= 1,2,uiis the velocity vector of flow,ρis the fluid density,tis the time,μis the dynamic viscosity,fiis the volume force of fluid,andFiis the additional source term.
2.2 Boundary conditions
The tank parameters of numerical model and physical model test are consistent.The computation domain is showed in Fig.2. The left, the right and the downside boundaries of the tank are the walls while the upside is the pressure inlet boundary. The length of the tank is 45 m and the water depth is 0.5 m. After the tank grid setting, the wave generation zone is located at the left side, which has a length and water depth of one mesh unit.The 10 m length of the right side is the wave absorbing zone. The thickness of the horizontal plate structure is 0.015 m and its length isB=1.02 m.In the structure 20 measuring points are distributed horizontally along the length,the space between adjacent points is 0.05 m,and the space on one end of the plate is 0.035 m.The test sampling frequency is nearly 300 Hz. The maximum simulation sampling frequency is 2 000 Hz so as to obtain the effective peak values.

Fig.2 Schematic diagram of computation domain
2.2.1 Wave generation
JONSWAP spectrum is chosen as the irregular wave spectrum. Quality source method is used to generate wave needed. In this wave generation method, a kind of source term is added to the continuity equation, and for two-dimensional problems the continuous equations should be written as:

whereS(x,y,t)is the source term,S(y,t)is the wave strength at wave generation positionx=xs,S(y,t)= 0 outside wave generation position.
Depending on Eq.(5),the momentum equations become

Because the arrangement of wave generation domain is along the water depth direction,two and opposite direction wave propagation would be produced,so


whereu(y,t) is the fluid horizontal velocity at the position ofy, dxis the computational grid length alongxdirection.For irregular wave,u(y,t)could be calculated as below:whereSηη()is the spectral values at the position ofωi;is the circular frequency of component wavei;εiis the initial phase of component wavei,the random value within 0~2π;Ki= 2π/Li,Liis the corresponding wavelength, andhis the depth of the water.
2.2.2 Wave absorbing
Wave absorbing uses the porous media model introduced by Dong (2009)[29]. The model dissipates the wave energy by adding an attenuate source in the RANS equations.The attenuate source can be expressed as:

2.3 Tank grid setting and computational resources
The mesh created for the computational model is a structured quadrilateral mesh with a higher concentration of cells at the structure’s location and zone of wave height.
The basic mesh structure is shown in Fig.3.In thex-direction the mesh expands about 60-100 cells for each wavelength from the left boundary to the right boundary, and a mesh of 30 cells is used at the structure’s location.In they-direction the mesh expands at a rate of 1.03 to the upper and lower boundary from corresponding borderlines, and a mesh of 10-20 cells is used at the zone of wave height.The minimum size of the grid for a wave height is 0.015 m.The minimum size of the grid for a wave length is 0.034 m, which happens at the structure’s location.
The specific computation meshes corresponding to wave conditions are shown in Tab.1.WhereHis the effective wave height,Tis the effective period,Lis the wavelength,DxandDyare the minimum grid spacing intervals in thex-andy-directions,respectively.
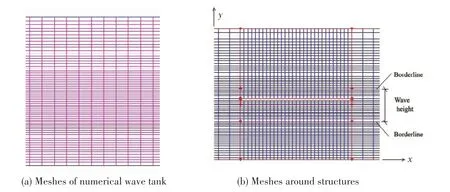
Fig.3 Example mesh
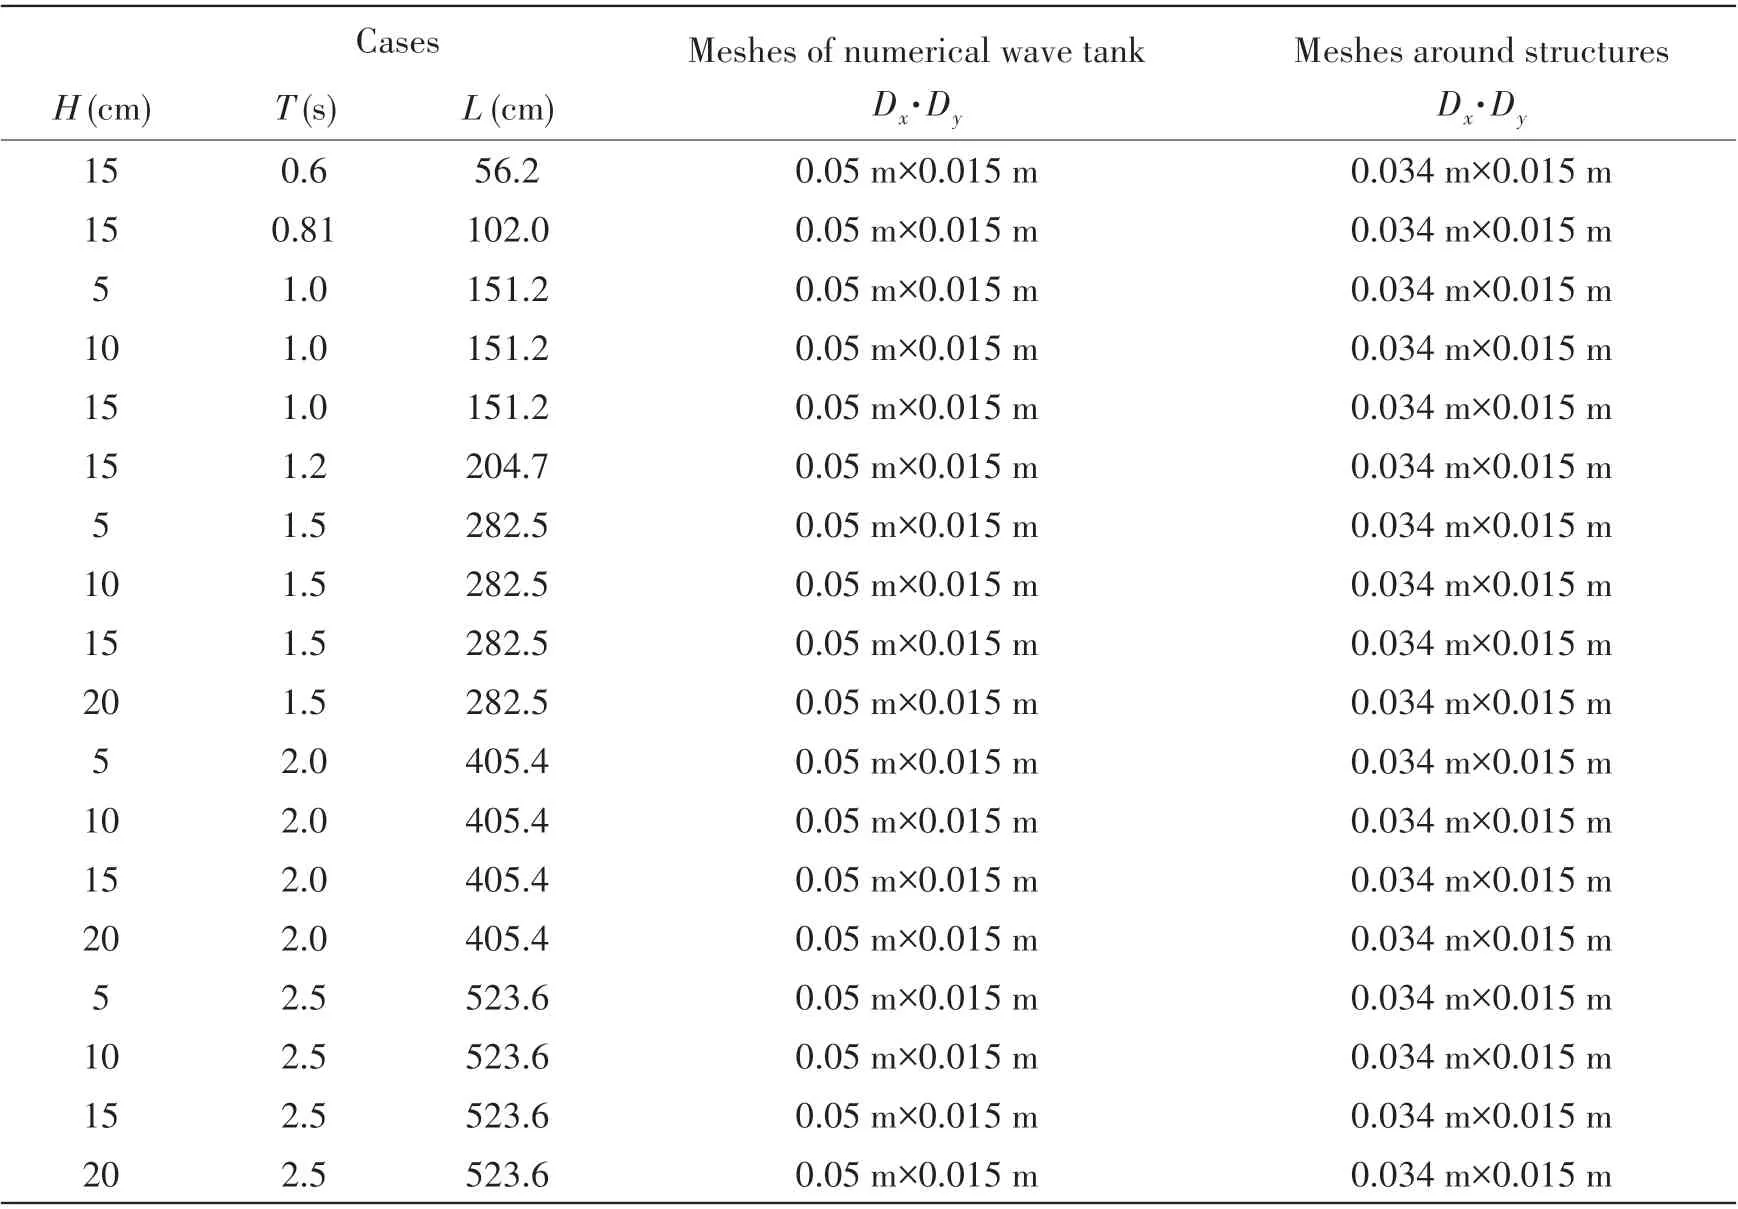
Tab.1 Wave conditions and computation meshes
2.4 Mathematical model validation
Since numerical wave is stabilized, the wave surface difference is recorded. Fig.4 shows the free surface series of simulation compared with the experimental results.xis the horizontal distance of recording point away from wave generation in simulation, the duration is about 3 minutes and nearly 100 waves are concerned. The comparison of focused waves is presented in Fig.5.

Fig.4 Time series of irregular wave profile(d = 0.5 m,T = 1.5 s,H = 0.15 m)

Fig.5 Comparison of focused waves(d = 0.5 m,T = 1.5 s,H = 0.15 m)
The continuous data recorded in Fig.4 can be transformed by FFT algorithm and the spectra can be drawn. Fig.6 shows the comparison of spectra.fis the wave frequency,S(f)is the wave frequency spectrum. The results show that the calculated spectra are consistent with the theoretical and experimental spectra, indicating that the present numerical wave tank can be used to generate continuous irregular wave.
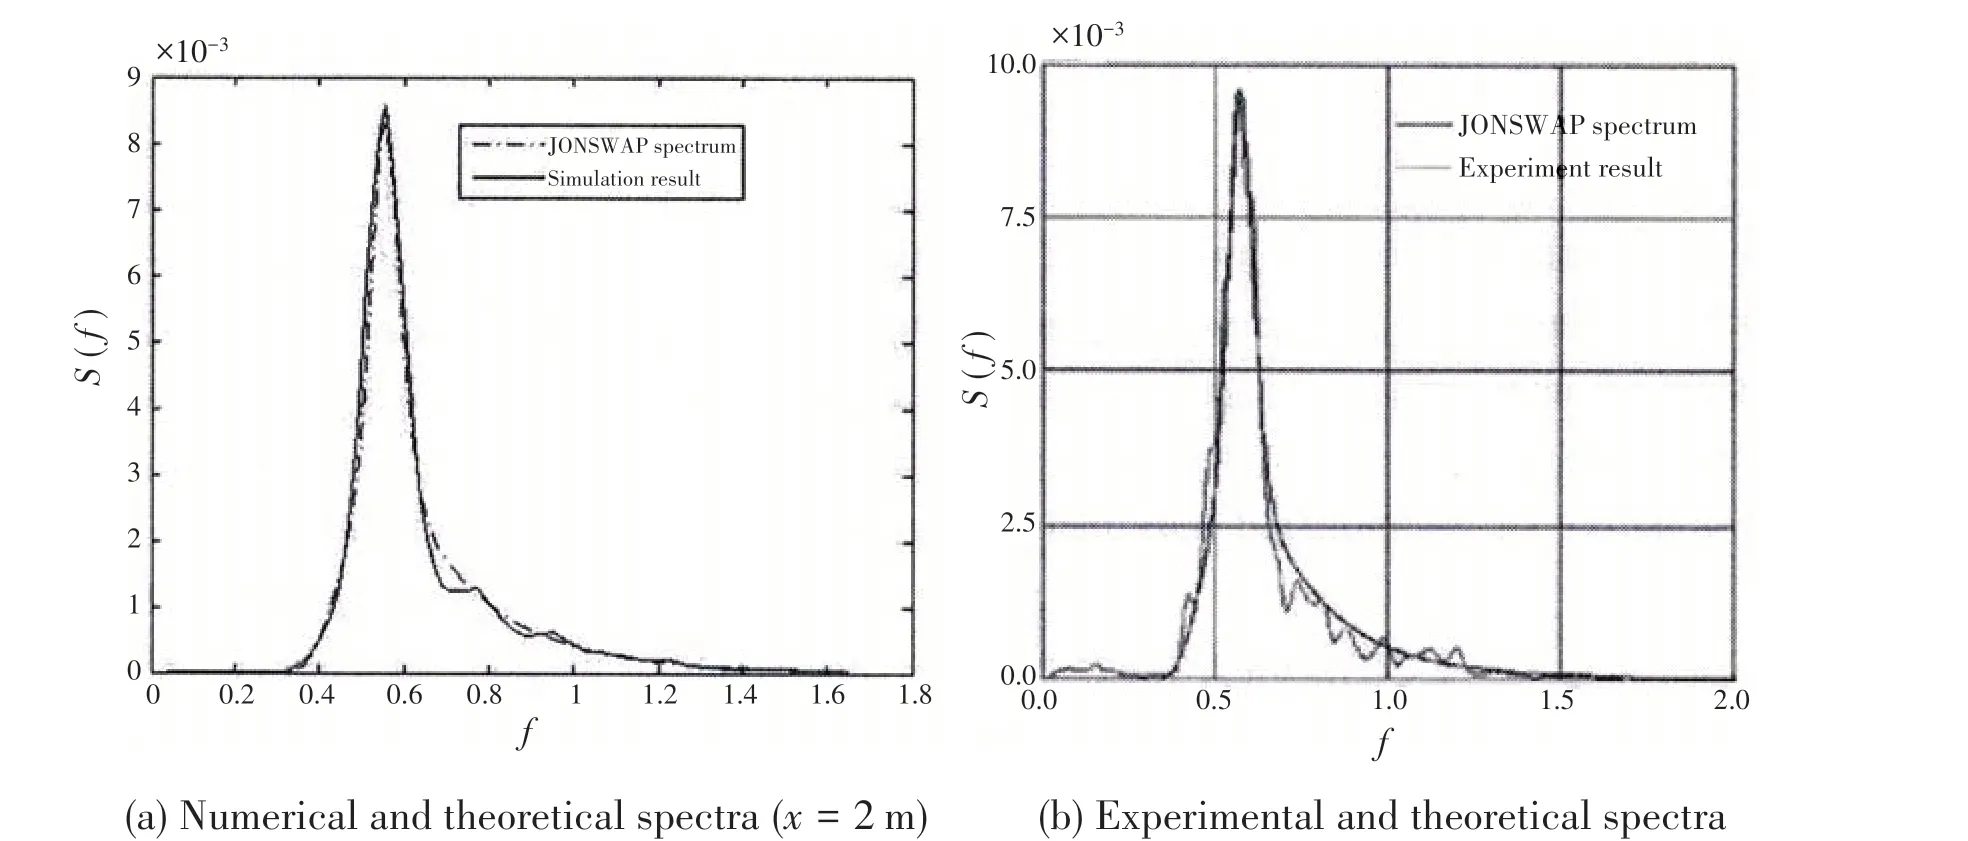
Fig.6 Comparison of spectra(d = 0.5 m,T = 1.5 s,H = 0.15 m)
The wave absorbing boundary condition is proved available as shown in Fig.7.tis the time,ηis the wave surface. Along with the wave propagation, the wave energy attenuates and the wave height decreases. After wave dissipation in the wave absorbing zone the wave surface approaches to a standing level.
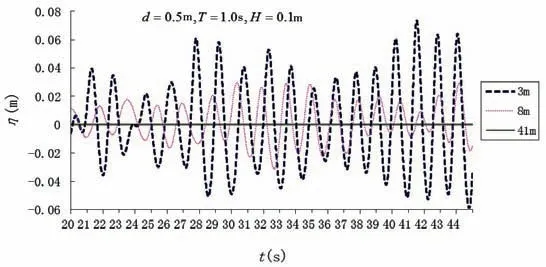
Fig.7 Free surface variation with time in different position(x=3,8,41 m)
Using the mathematical models established,a few typical cases of wave slamming on horizontal plate structures are reproduced.The results are presented in Figs.8-9 and Tab.2.
Fig.8 shows the impact pressure time history on the structures in three cases (using the data of the leftside measuring-point and the same below). Fig.9 shows the partial enlargement of simulation results in Fig.8.tis the time,pis the impact pressure.Fig.8 indicates that in a wave period, the wave pressure undergoes four processes. At first, at the instant when the water impacts on the structure, there appears a peak value of pressure, which is not identical in various wave periods. The reason is that the water particles moving upward vertically are suddenly blocked by the structure.Then,there appears an oscillatory process with a relatively long duration due to the air gaps between the underside of the structure and the free surface. Thirdly,buoyant uplift pressure appears. At last, at the instant when the water departs from the underside of the structure, there occurs a negative pressure. The reason is that the surrounding air does not fill in time.Moreover,Fig.8 shows that the positive quasi-static pressure values in the left column are often greater than that in the right column. The reason is the influence of the pile and sleeve in the experiment.Fig.9 shows clearly the variation of wave pressure under higher sampling frequency. The impact pressure has a considerable magnitude and takes a much shorter rise time. If the sampling frequency is not enough, the peak impact pressure will not been obtained and the results will be different obviously.
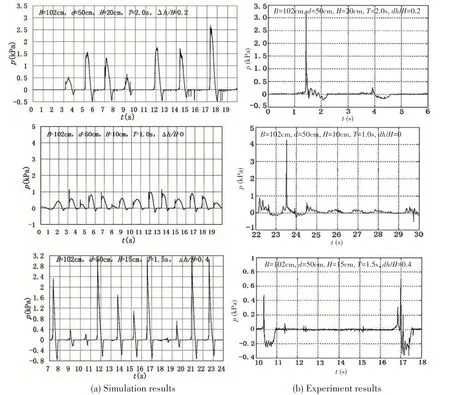
Fig.8 Impact pressure time history of the structures in typical cases
Tab.2 shows the statistical results of simulation and experiment from Fig.8.In the table for each case, the test repeats one time and the eigen values are calculated through the pressure peak values of successive 12 wave periods. Simulation values often present a little larger. One of the reasons is that the maximum sampling frequencies of simulation and experiment are different, and that of the simulation is much higher so as to catch the accurate instant slamming pressure.The peak impact pressure changes irregularly,which is a random process,but still follows a certain rule,and there is a better repeatability in the test statistical values.It is seen that except the maximum values, the average peak value, the 1/3 average peak value and 1/2 average peak value are relatively stable which can be taken as the eigen values to study the wave slamming action.
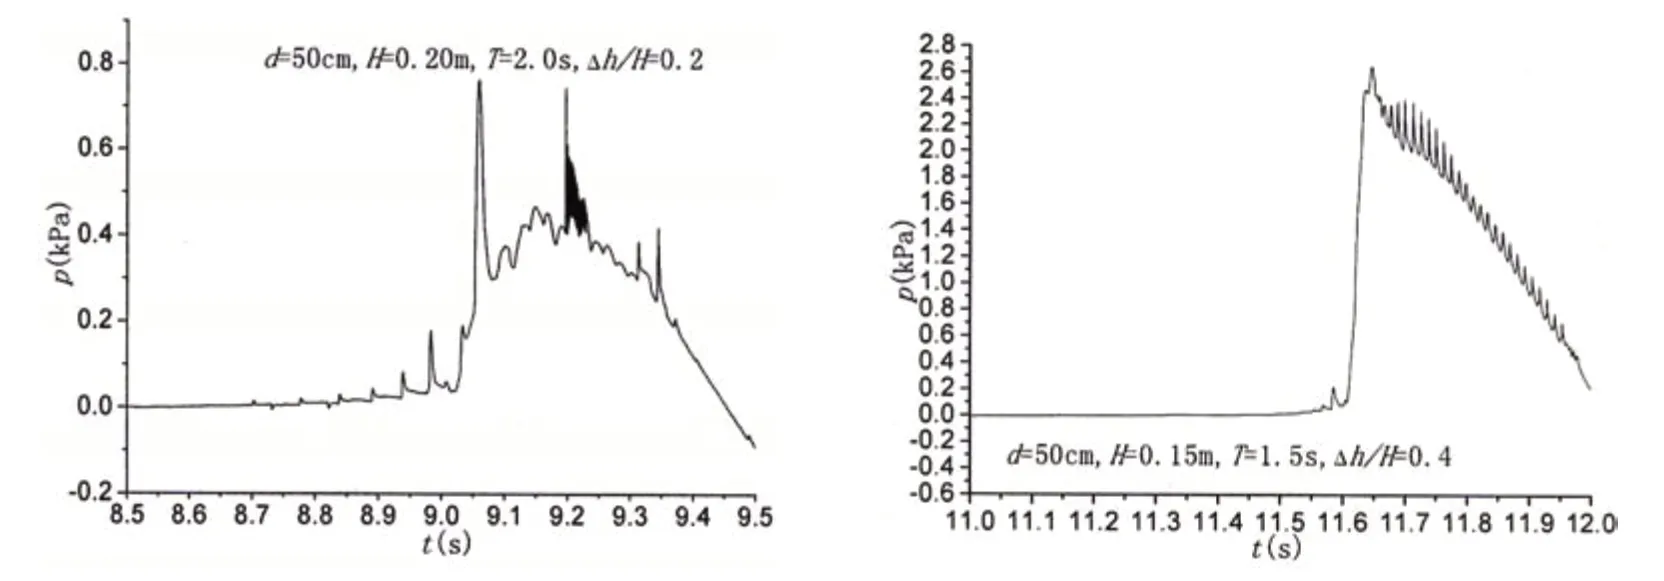
Fig.9 Partial enlargement of simulation results in Fig.8
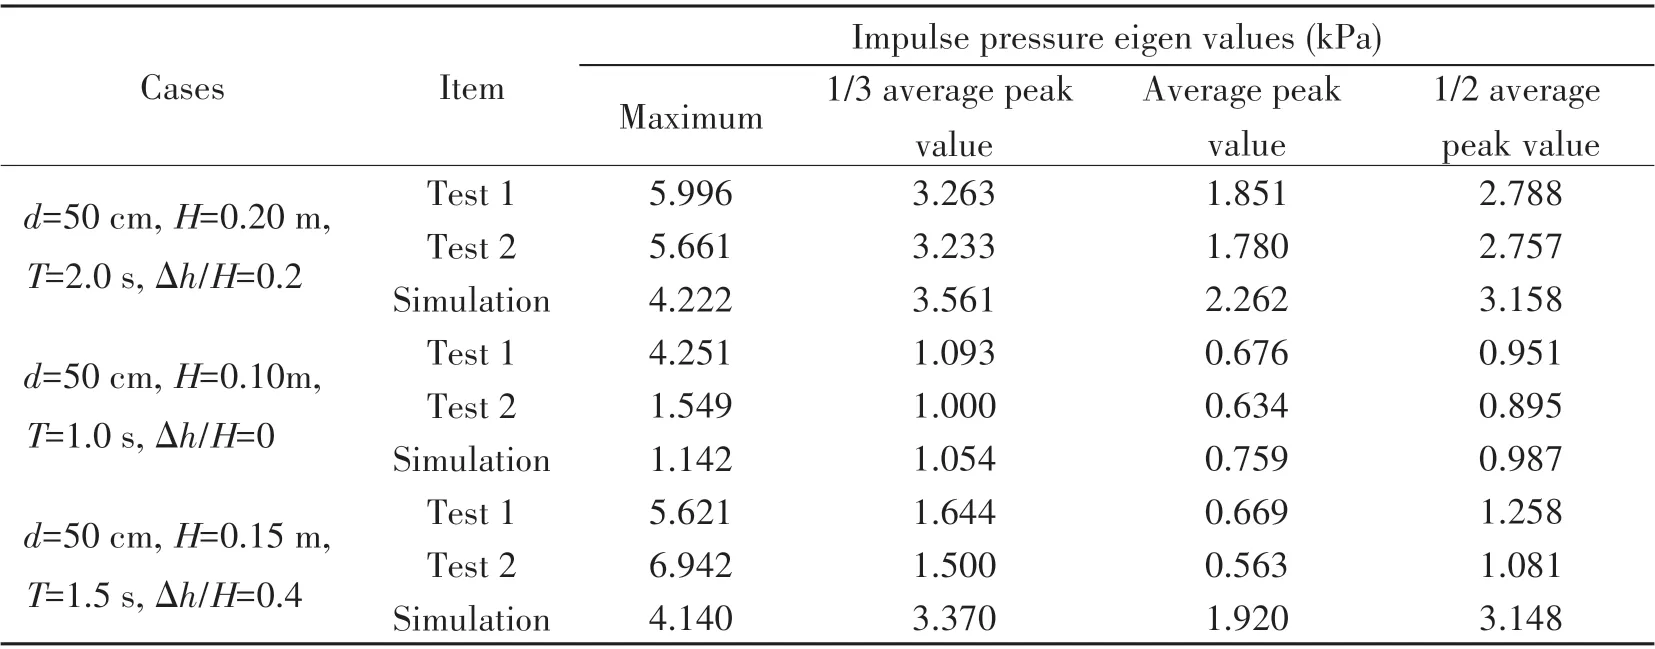
Tab.2 Statistical data of simulation and experiment under typical cases
Flow field of one typical case in a wave period is presented in Fig.10. The waves propagate from the left to the right side.The velocity vector is coloured by the volume fraction of water. The yellow vector is air region, the blue one is water region while the others indicate both air and water. The length of the arrow means the size of the velocity. The velocity magnitude is about 0-7.81 m/s.
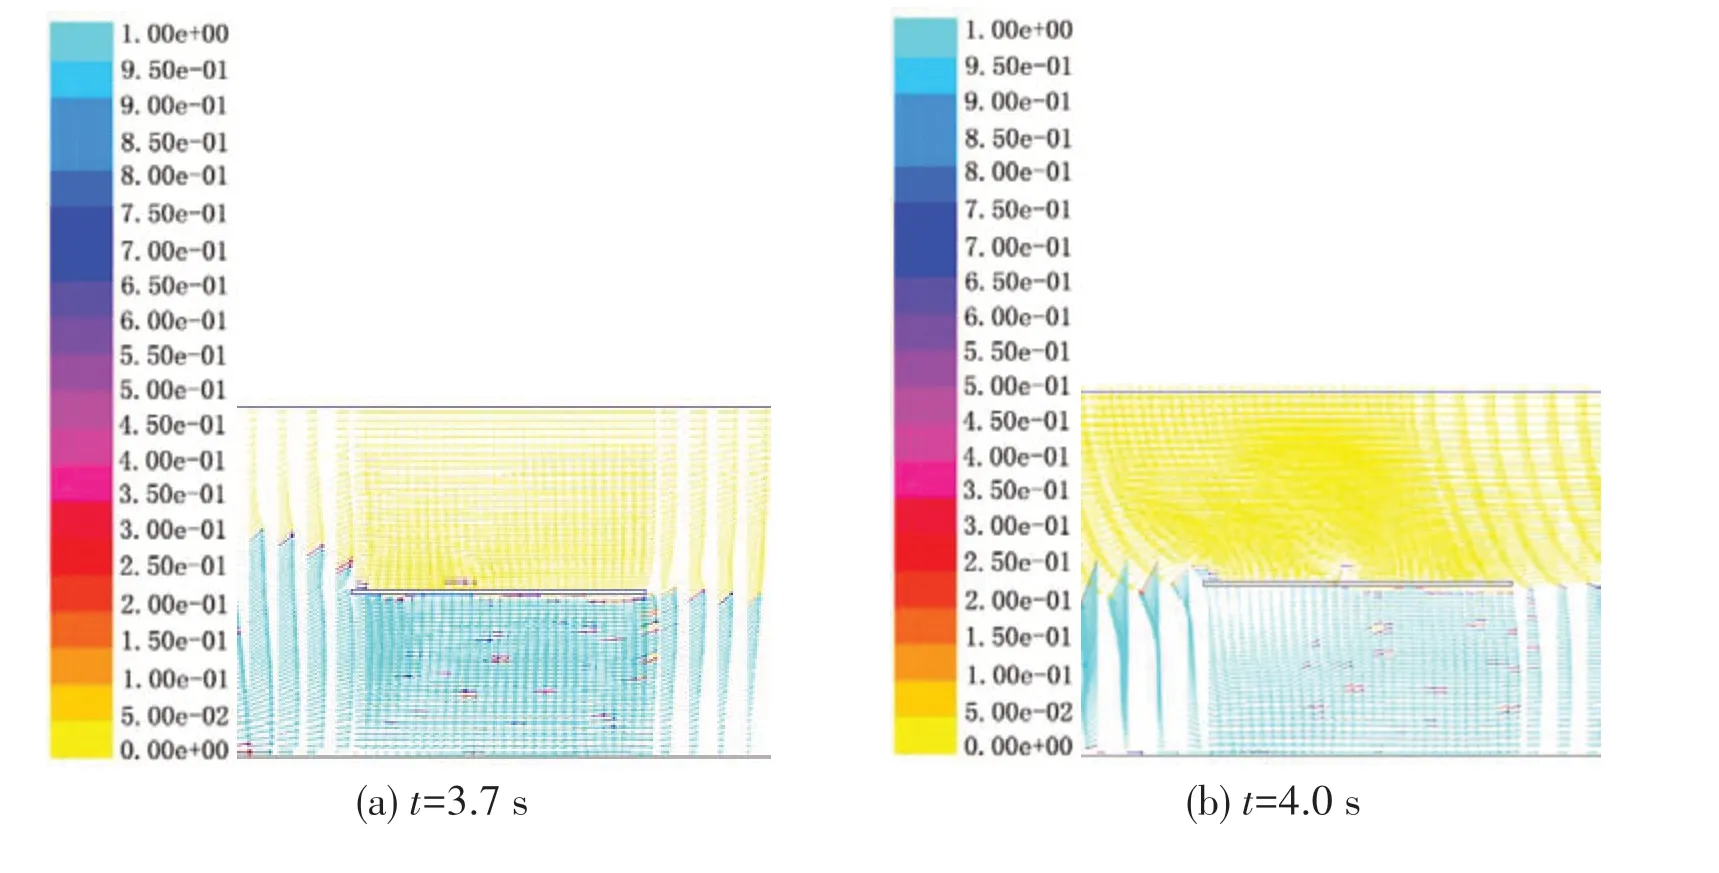

Fig.10 Instantaneous whole-field fluid velocities of different instant(d=50 cm,H=0.20 m,T=2.0 s,Δh/H=0.2)
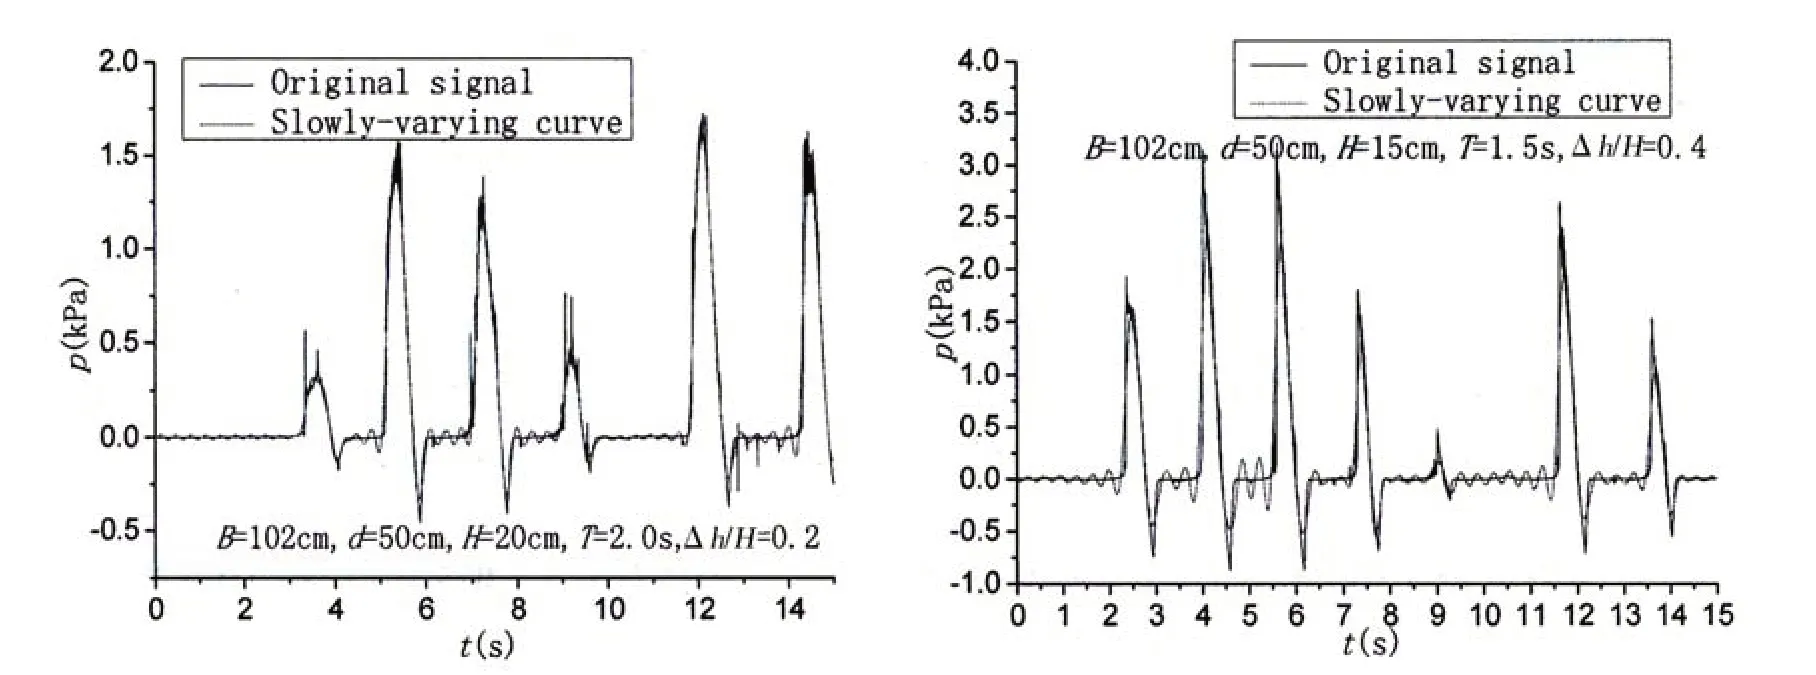
Fig.11 Comparison of quasi-static pressure curve and original signal under typical conditions
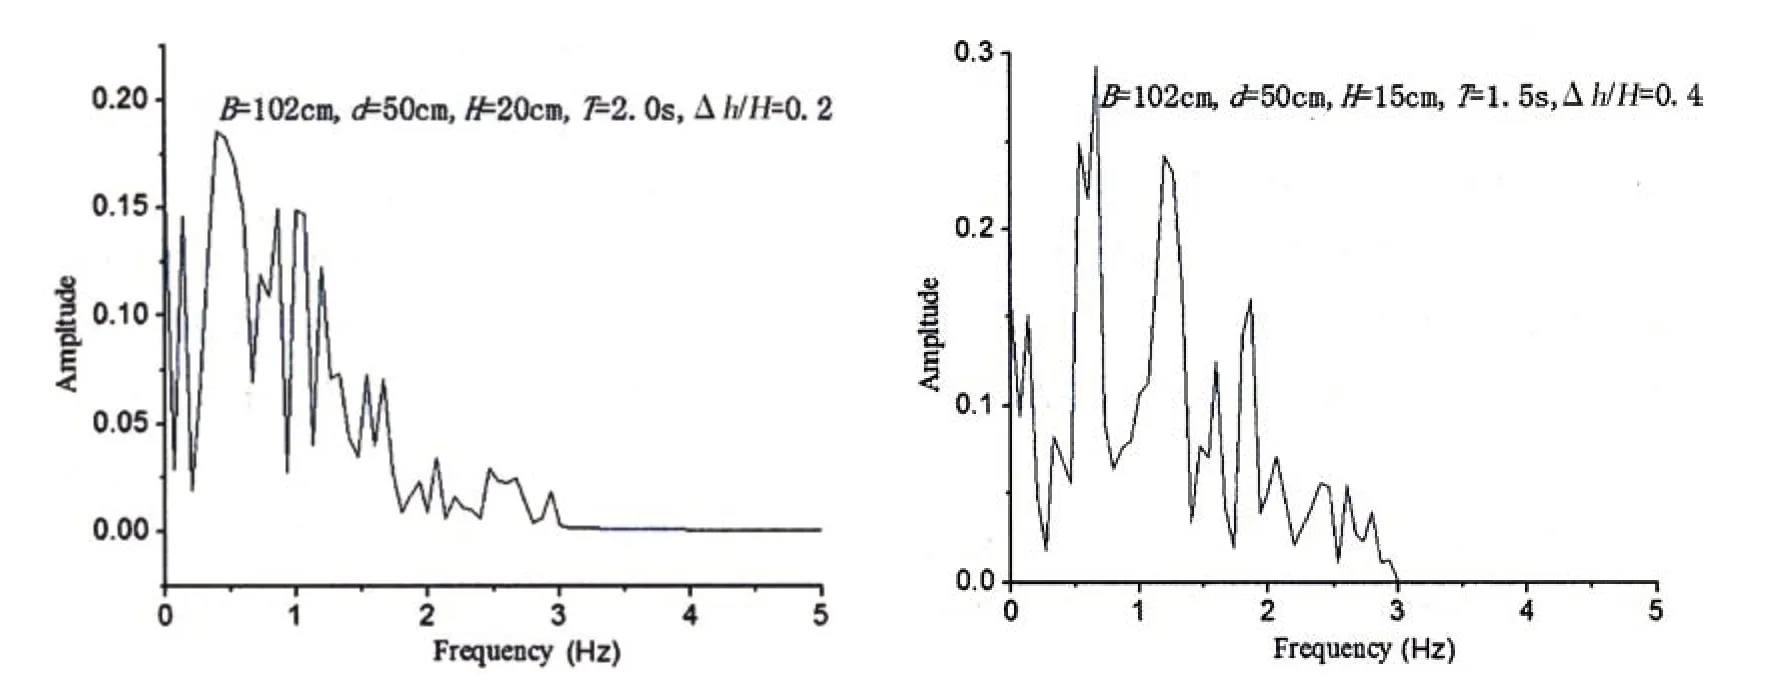
Fig.12 Spectrum distribution of the computed results in Fig.13
In order to obtain the characteristic values of the quasi-static pressure through the wave impact pressure, the low-pass filter method is used to filter the original signal. Low-pass filter method can filter the middle and high frequency signals,and allow the low frequency signals to pass through.Fig.11 shows the curve comparison between the new and the original signal under different working conditions. The original signal refers to the impact pressure curve, the cutoff frequency is 3Hz and the sampling interval is 0.0005s. Using the raw computed results, the FFT is analyzed and the distribution of the spectrum in the frequency is shown in Fig.12. The quasi-static pressure spectrum has many peaks, the peak frequency of spectrum appears at the crest frequency of the incident wave spectrum, and the secondary peaks occur at 2 times and 3 times the crest frequency. Tab.3 gives the comparison of simulation and experiment results about the quasi-static pressure. The low-pass filter method is effective in reflecting the quasistatic parts of shock signal.

Tab.3 Statistical data of simulation and experiment
The comparison above shows that the wave tank can work well to simulate the wave slamming. The 1/3 average peak value is taken as the eigen value to analyze the characteristics of quasi-static pressure,which is referred to as peak quasi-static pressure hereinafter.
3 Simulations of quasi-static pressure
3.1 Distribution of quasi-static pressure
The distributions of quasi-static pressure under various wave heights,clearances and periods are presented in Figs.13-15.The ordinate represents the 1/3 average peak value or relative 1/3 average peak value, the abscissa represents the distance of measuring point away from the plane leftside,and 0 represents the plane leftside.
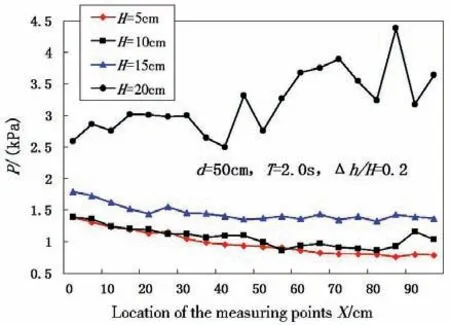
Fig.13 Distributions of the quasi-static pressure on the structure subface

Fig.14 Distributions of the quasi-static pressure on the structure subface
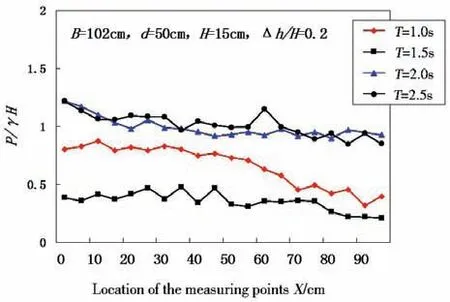
Fig.15 Distributions of the quasi-static pressure on the structure subface
Fig.13 shows that the quasi-static pressure distribution is similar under smaller wave height conditions, and for these cases the maximum quasi-static pressure happens in the foreside of the structures. With a smaller wave height,the increasing range of the quasi-static pressure is nearly corresponding to the height values. With a larger wave height(H=20 cm), the increasing range of the quasi-static pressure is greater. The reason is that with a larger wave height and a larger wave steepness, the effects of wave power are stronger, and the quasi-static pressure will be greatly increased.For the curve ofH=20 cm, there is a certain degree of increase at the plate end.The reason is that at the plate end waves collide with the water flowing down from the structure and wave chaos is caused.

Fig.16 Distributions of the quasi-static pressure on subface of structure at the same time
Fig.14 shows that the quasi-static pressure distribution is similar under different clearance conditions with little change in value. It is generally evenly distributed and will have a certain degree of sudden increase in the plate end.
Fig.15 shows that in a short period the maximum pressure will occur in the front of the plate, in a medium period the maximum pressure will appear in the middle of the plate and the pressure values are similar,and in a long period the maximum pressure will happen in the front of the plate but also in the postmedian part of the plate.
Pressure distribution along the plate length under different conditions happens at the same time when larger quasi-static pressure and quasi-static total force appear, as is shown in Fig.16. In order to get more accurate results,more measuring points are arranged.In the structure 50 measuring points are distributed horizontally along the length, the space between adjacent points is 0.02 m, and the space on one end of the plate is 0.02 m. The distribution width corresponding to the larger quasi-static pressure is found in Tab.4.

Tab.4 Statistics of quasi-static lateral pressure distribution
wherexis the contact width of the wave on the plate,which can be written as:

When the relative clearance Δh/His 0-0.6,xcould be calculated as below:

According to the simulation results regarding the distribution of the quasi-static pressure,two kinds of pressure distribution including even distribution and impulse distribution are presented. Distribution width is related to the factor ofx, relative clearance and relative length of the plate. Through the data fitting of Tab.4, the lateral pressure distribution can be expressed as:

Applying Eq.(14) the pressure distribution results are also shown in Tab.4. It can be seen that most results from Eq.(14) are larger or close to the simulation distribution width, and comparatively the result fromx/2 andL/4 has more deviation, especially when the relative plate length is less than or equal to 1.In conclusion,the new fitting formula is relatively safe and feasible.
3.2 Characteristics of peak quasi-static pressure
The influences of wave steepness on the peak quasi-static pressure are presented in Fig.17. In some simulation groups, when the wave steepness exceeds a certain value, the relative quasi-static pressure decreases with the steepness increasing, when the wave steepness is less than this value,the relative quasi-static pressure decreases with the steepness decreasing.
Wave steepness values corresponding to the maximum relative quasi-static pressure of the
curves are different. The reason is that wave impact angle is affected by both wave steepness and Δh, and if Δhis different, the wave steepness of the same impact angle is different too. In addition, when Δhis different, the effect of air layer under structures on the impact angle and wave impact is not the same. The combination of these factors results in a certain regularity trend in the relationship between wave steepness and peak quasi-static pressure, though somewhat messy.
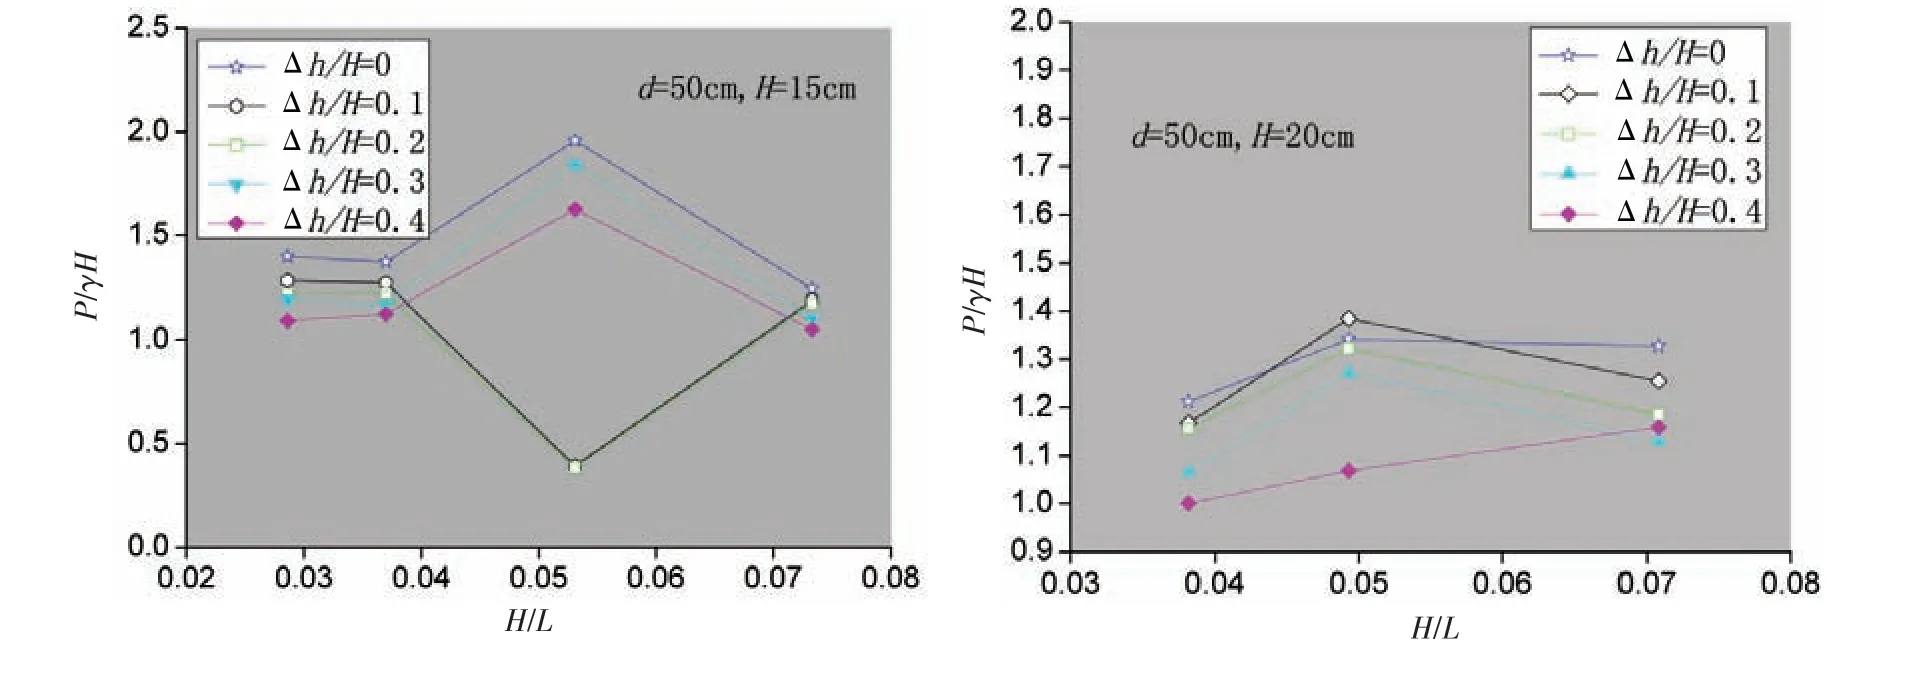
Fig.17 Relationship between quasi-static pressure and wave steepness
The influence of relative clearance on peak quasi-static pressure is presented in Fig.18.The relative clearances corresponding to the maximum quasi-static pressure are generally below 0.3. Upward from the static water level, when the relative clearance is larger, the corresponding peak quasi-static pressure is larger, to a certain height the pressure is the largest, and then decreases with the increase of the relative clearance.
The influence of relative structure length on peak quasi-static pressure is presented in Fig.19,B=1.02 m is the structure length. With the increase of the relative structure length, the relative quasi-static pressure tends to increase.The maximum quasi-static pressure often appears in the postmedian position of curves.
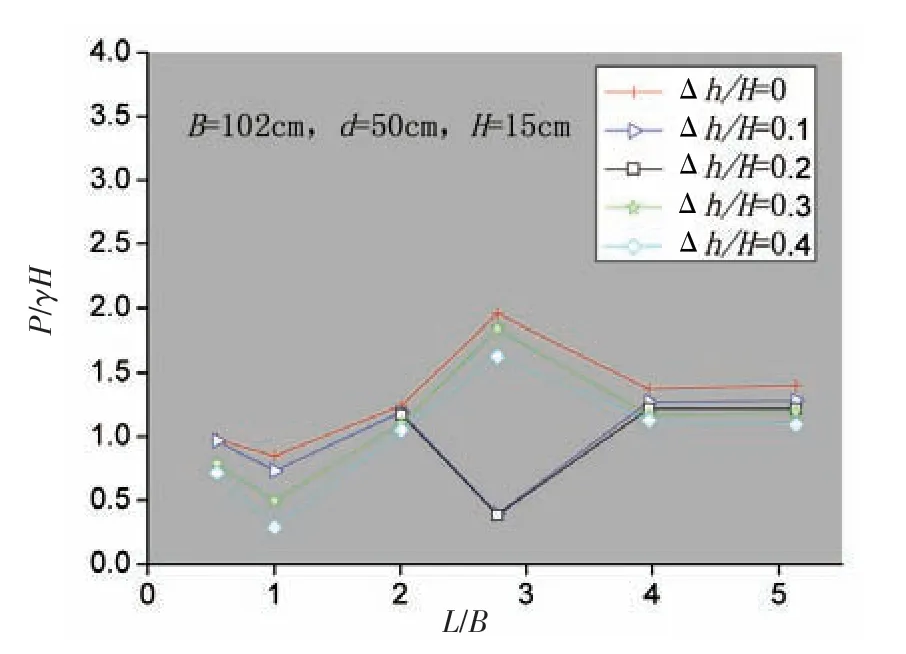
Fig.19 Relationship between quasi-static pressure and relative structure length
3.3 Peak quasi-static pressure formula
The simulation data of the peak quasi-static pressure are analyzed and the fitting results are shown in Fig.20.

Fig.20 Peak quasi-static pressure enveloping line
The peak quasi-static pressure is calculated as follows:

The 90% envelope line for simulation data is shown in below.

The symbolic meaning of Eq.(16) is the same with that of Eq.(15). The formula is applicable to estimate the peak quasi-static pressure of irregular wave on offshore flat plates.
In Fig.20 the blue curve is the calculation results of Eq.(1) while the red curve is the results of Eq.(15).There are visible differences between the fitting formula and the original formula results.The fitting formula reflects the power function and the original formula have a linear relationship. The calculated values from original formula are generally smaller. Comparatively the fitting formula is more reasonable and feasible.
4 Conclusions
With numerical simulation as a dominating method combined with physical experiment data,the irregular waves impacting on horizontal plate structures were studied.The distribution of quasi-static pressure under structures was analyzed, the influence of each factor including wave steepness, clearance and structure length on peak quasi-static pressure was studied, the distribution width formula of quasi-static pressure was proposed, the calculation formula of the peak quasi-static pressure was put forward,and the following main conclusions are reached:
(1)The low-pass filter method was effective in obtaining the quasi-static sections from the up-lift force signals.The simulation wave tank could work well in wave slamming action.
(2) The rules of quasi-static pressure distribution are as follows: Under different wave heights, the maximum pressure generally appears in the foreside of the structures and the increasing range of the pressure is nearly corresponding to the height values. Under different clearances, the variation range of the pressure is less. In a short period the maximum pressure occurs in the front of the plate, in a medium period the maximum pressure appears in the middle of the plate,and in a long period the maximum pressure appears not only in the front but also in the postmedian part of the plate.
(3) The effects of various factors on peak quasi-static pressure are as follows: When the wave steepness is greater or less than a certain value,the peak pressure decreases from this value with the variation of wave steepness.The relative clearances corresponding to the peak pressure are generally below 0.3.With the increase of relative structure length,the relative pressure tends to increase.
(4) Through data fitting the distribution width formulas of quasi-static pressure were proposed,and compared with the original ones the new formulas were more reliable.
(5) Through analysis of numerical simulation results, the calculation formulas of quasistatic pressure on structures are given, which reflect nearly a power function relationship betweenP/γand (η- Δh). The value calculated with the original formula was smaller in many cases so it was not fully applicable,and the formula put forward was more reasonable and feasible.
Acknowledgements
I gratefully thank Prof. YAN Yi-xin, Prof. ZHENG Jin-hai and Prof. CHEN Guo-ping in Hohai University for their valuable suggestions,and Mr.YAN Shi-chang for his help in obtaining the experimental data.
- 船舶力学的其它文章
- Nonlinear Correction of a Hydraulic Propulsion System Used in Deep-sea Work-Class ROVs
- Nonlinear Wave Loads and Green Water Acting on a Ship in Severe Sea Conditions
- Application of Chebyshev Polynomials to Efficient Approximation of Frequency-Domain Infinite Depth Green Function
- Numerical and Experimental Study for SCR with Cable3D
- Nonlinear Numerical Simulation for Flexible Pipes Carcass Wet Collapse
- Analysis of Drilling Riser in Re-entry Operation Under Complex Currents

