
Numerical and Experimental Study for SCR with Cable3D
2019-12-30 06:45:52,-,-,,-
船舶力学 2019年12期
,-,-,,-
(1.School of Civil and Ocean Engineering,Jiangsu Ocean University,Lianyungang 222005,China;2.Shangdong Key Laboratory of Ocean Engineering,Ocean University of China,Qingdao 266071,China;3.Institute of Civil Engineering,Agriculture University of Qingdao,Qingdao 266009,China)
Abstract:The Steel Catenary Risers (SCR) are widely used in oil and gas field, and the VIV is a core issue for study of SCRs. For the study of paper, the large deflection slender beam theory and Vortex-Induced Vibration model (VIV) (Cable3D’s vortex-induced vibration model considering fluid-structure interaction in two directions),were adopted for solving the complex coupled acceleration response for the numerical simulation compared with experimental results. The acceleration time history was tested and calculated, and from the perspective of amplitude and time history, the calculation results are satisfacfory. Analysis of the fluctuations equilibrium position, the acceleration extreme value and standard deviation shows the Cable3D with vortex-induced vibration model considering fluid-structure interaction in two directions can satisfy response characteristic significant increase. And it also proves that the program is reliable for VIV analysis.This paper is aimed to provide some practical and reasonable suggestions for SCR’s calculation and analysis and further expansion is needed to improve the accuracy.
Key words:steel catenary riser;vortex-induced vibration model;Cable3D
0 Introduction
Steel catenary riser is a key equipment for offshore oil exploration and exploitation plan.The previous joint development plan mainly consists of‘Deep-sea environment steel riser’,the riser and seabed interaction model,and SCR mathematical model.Research involved riser’s design,fatigue life analysis of the Touch Down Point (TDP),Vortex-Induced Vibration (VIV),interaction with seabed soil and mathematical model of riser. Now, the main programs include Deeplines,Flexcom,Orcaflex,etc..
Dong and Shiri[1]researched the influence of nodal inconsistencies of non-linear riser-seabed interaction model. Wu et al[2]researched the higher harmonics fatigue damage of flexible riser’s VIV. Meng et al[3]researched the lower marine riser package cap. Armstrong et al[4]researched the probability distributions response of a flexible riser with FPSO in a storm. Yin et al[5]researched the in-line response under vessel motion and cross-flow response under VIV when KC number is relatively small. Wang et al[6]researched the ice vibration response of riser numerical simulation and experiment.Shi and Manuel Lance[7]researched the experiment,damage estimation and distributions of riser. Yao et al[8]researched a quasi-plane helical pipe device for pipeline-riser system. Zargar et al[9]researched the soil-riser interaction with a unified mathematical approach and an explicit degradation model.Alfosail and Younis[10]researched an inclined marine riser on the three-to-one internal resonance. Lu et al[11]researched the unsteady flow VIV of flexible risers through the analysis of forced oscillation experiments on hydrodynamic forces.
Cable3D is based on FORTRAN language, and has unique and effective solution in simulating the steel catenary riser with large deflection beam with bending rigidity model, and in simulating the floating structure, currents and waves, rigid body swing, vortex-induced vibration[13], the seabed and soil interaction aspects[12]. Compared with the commercial program, open source is good for its secondary development and application.
Vortex-Induced Vibration (VIV) is the core problem of steel catenary riser’s design. In this paper,based on the study of two direction vortex induced vibration model for the steel catenary in non-locking zone,the numerical simulation of the Steel Catenary Riser (SCR)is carried out with a coupled model validation.
1 SCR’s slender beam model of large deflection
1.1 Basic vibration equation[13]
In the global coordinate system of the riser motion equations, the beam is represented by the vector(s,t)∙andare the unit vectors of the normal, binormal and tangent line of any point of riser.ex,eyandezare vectors forx,yandzdirections of the beam with the moving coordinate system.
Through the analysis of momentum theory, the beam balance equation can be expressed as:
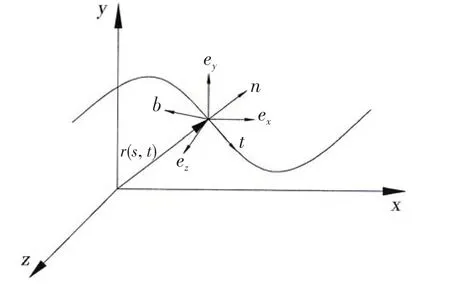
Fig.1 Coordinate system
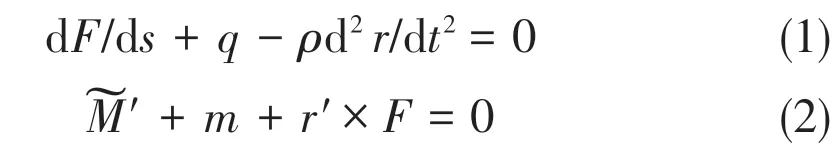
whereF,qare internal and external beam forces;ρis beam quality;mare internal and external beam moments.
Through the analysis of Bernoulli-Euler equation and load expression, SCR vibration formula can be obtained:

In the formula,Mis the mass matrix:
qis load matrix:

whereρtgis pipe diameter density,Atis cross section area,ρiis internal fluid density,Aiis inner area.ρfis water density,Afis outer area.CMn,CMtare normal and tangential additional mass coefficient, and T and N are vector transformation matrices. In addition,λrepresents Lagrangian operator,Ftis tensile load of riser,Pfis sea pressure,Piis internal fluid pressure,Bis flexural rigidity of beam andκis beam curvature.Likewise,uandu̇are seawater’s velocity and acceleration,gis gravitational acceleration andqDn,qDtare the normal and tangential drag forces.
1.2 Boundary conditions
Steel catenary riser in addition to the ends fixed,the flowline is interactive with the bottom of sea, including the sea floor’s elastic plastic support, suction effect, tangential friction resistance and grooves resistance[12].
2 Vortex-induced vibration model
There are three research methods for VIV:an experiment,empirical model and a CFD numerical simulation.In this paper,a new model of vortex-induced vibration based on large flexible cylinder experiments is studied.And its characteristic is that there is no complicated calculation processes like the wake oscillator model,which is an iterative process of empirical formula.
2.1 Consideration of fluid-solid coupled and two direction vortex-induced vibration model
Fluid alternately occuring in each side of the reverse lift is produced,namely the cylinder,and the periodic shedding occurs,vortex-induced lift.When in non-locked zone,causing pressure variation,the periodic pair of the lift model[13]can be modified as:

wherefsis Strouhal frequency,Uis fluid velocity,ẋis structure velocity,Dis cylinder diameter,CLis lift coefficient,ρis fluid density,tis time.
Along with the generation and shedding of vortex, SCR will be subjected to the average drag force and pulsation drag force. When in the non-locked zone, the average drag force model and pulsation drag force model are modified as follows:

whereCDrepresents drag force coefficient andCD'is the pulsation coefficient of drag force.
3 Test analysis and numerical simulation
3.1 Key information of the test
3.1.1 Test device and measuring point layout
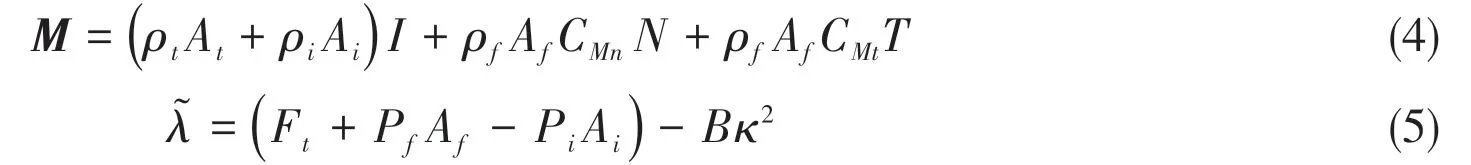
The test[13]was carried out in hydrodynamics laboratory.The size of sink is 30 m×1 m×1.2 m. The material is GY.215-16 PVC, and the PVC pipe is made into catenary. The adjustable height frame is adopted for the test. Horizontal rotating pedestal is used to simulate the top and lower hinge support respectively. As shown in Fig.2 and Fig.3, the piezoelectric acceleration sensor is installed at a distance from the axis.
Fig.2 Test equipment
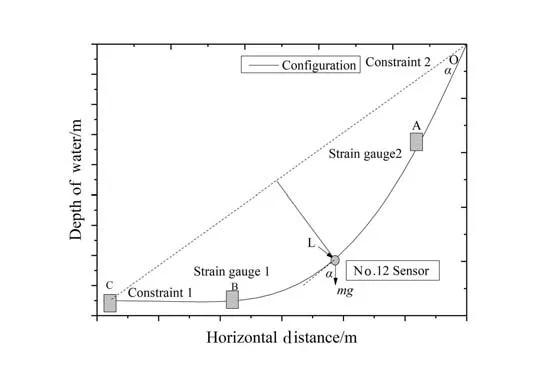
Fig.3 Schematic of test equipment
3.1.2 Test results and analysis
The acceleration values at different velocities were measured, and the six working conditions of the experiment were listed in Tab.1.
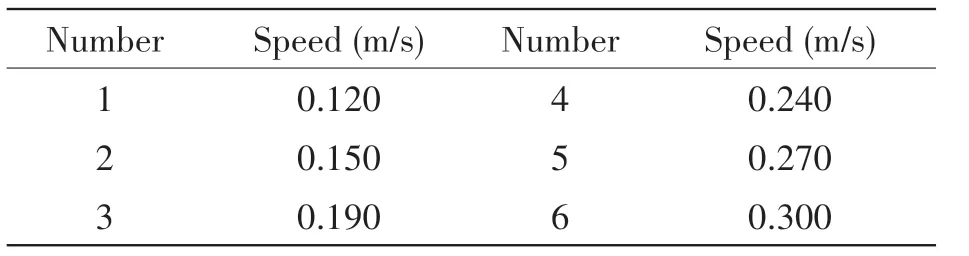
Tab.1 Plan for test
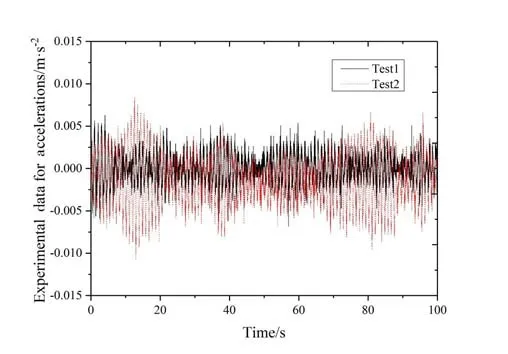
Fig.4 Time history of structural acceleration when the water velocity is 0.12 m/s
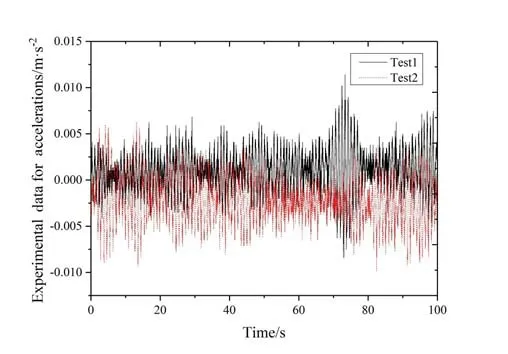
Fig.5 Time history of structural acceleration when the water velocity is 0.15 m/s
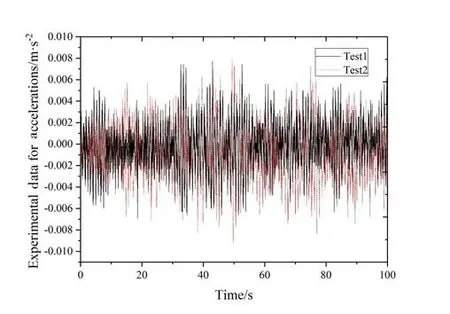
Fig.6 Time history of structural acceleration
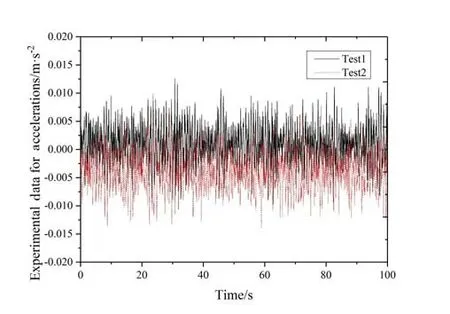
Fig.7 Time history of structural acceleration
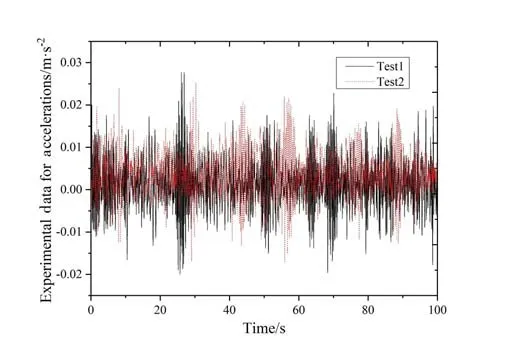
Fig.8 Time history of structural acceleration when the water velocity is 0.27 m/s

Fig.9 Time history of structural acceleration when the water velocity is 0.30 m/s
Figs.4-9 show comparison of two groups of data for the test. The acceleration time curve can be used as a reference for numerical results. It can be seen from these figures that from 0.12 m/s-0.30 m/s , there is no obvious deviation from equilibrium position in the graph between the two sets of data.But there is a deviation for 0.15 m/s and 0.24 m/s.
The statistics of the working conditions are shown in Tabs.2-3 and Figs.10-12.

Tab.2 Post processing of vortex-induced vibration for Test 1
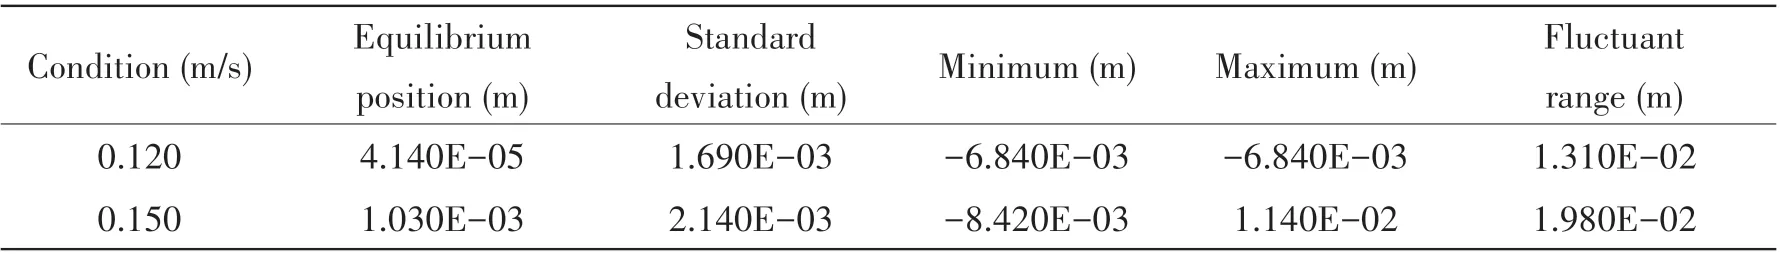
Tab.3 Post processing of vortex-induced vibration for Test 2
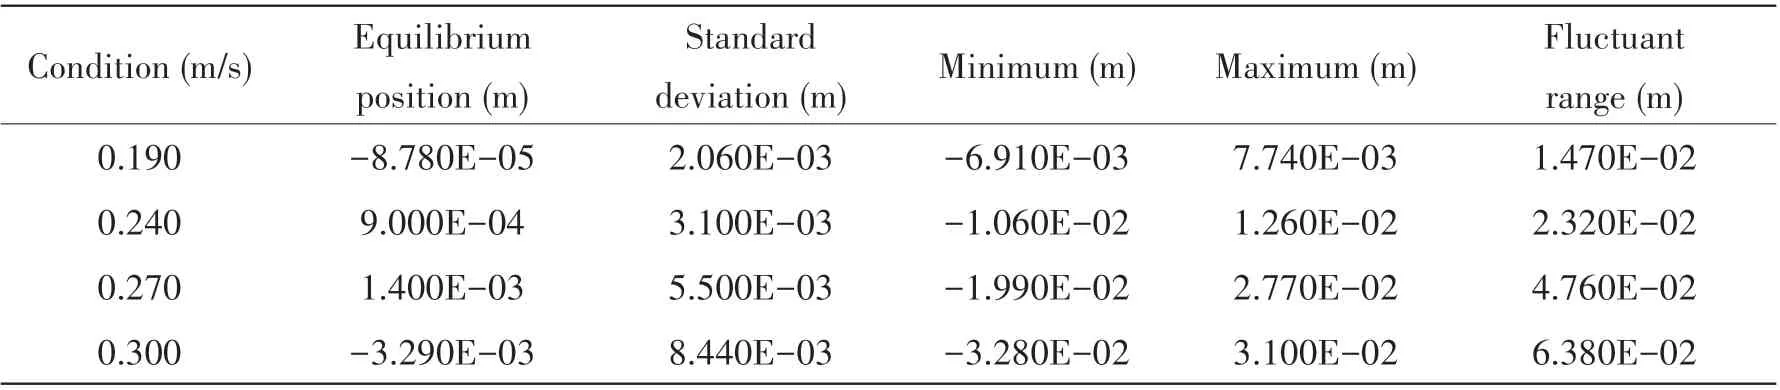
Continue 3

Fig.10 The relationship of equilibrium position and flow velocity

Fig.11 The relationship of standard deviation and flow velocity
Fig.10 shows the relationship of equilibrium position and flow velocity. After 0.25m/s, the two groups of data deviate from 0 axis oppositely and amplitudes increase. After 0.27m/s, violent trend decreases.
Fig.11 shows the relationship of standard deviation and flow velocity.With increase of flow velocity, fluctuation rises. The amplitude of vortex induced vibration increases gradually, especially after the 0.25 m/s. The difference of two groups was small.
Fig. 12 shows the relationship of extreme value, variation range and flow velocity. After 0.25m/s, the maximum value and the variation range of two group data are rapidly changing.The minimum value of two group data has little difference. But the maximum value and the range after 0.27 m/s are different. It shows that the structure is in the non-locked region from the relationship between reduction speed and the extreme values.
Tab.4 shows that the third order frequency of the test model is near 3Hz. Frequency obtained byfs=StU/DwhenU=0.25 m/s is 3.125 Hz, which is similar to 3rd transverse frequency for structural natural vibration.That is the reason why the response for VIV increases.

Tab.4 Natural period frequency and mode of vibration calculated by Orcaflex
Through the above two groups of test data,it can basically be grasped that the characteristics from the responses of structure are affected by flow. When in non-locked zone, the vortexinduced vibration response increases with flow velocity.And vortex shedding frequency is similar to structural natural vibration frequency.The structure usually generates resonance and usually responds to drastic changes.
From the symmetry of the data structure,and no offset in the relative equilibrium position,Test 1 is selected as the basis for the comparison of numerical simulation.
3.2 Numerical simulation
Cable3D is used for numerical simulation.In the experiment,the location of the speed sensor in the physical model is the corresponding node 12 in the numerical model. The static position can be shown in Fig.13 on the right.
The total length of pipe in experiment is 3.3 m. The distance is 3 m from top point to anchorage point. The distance is 1.5 m from TDP to the anchorage point, and the height is 0.85 m. And the top hanging angle of the SCR is 39°.
The density of test pipe is 1 500 kg/m3. The water density is 1 000 kg/m3. The SCR outside diameter is 0.016 m, and the SCR inner diameter is 0.014 m. The coefficient for lift and drag force are 0.7, 1.2. The Pulsating drag force coefficient is 1.0, and mass coefficient is 1.0. The Elastic Modulus is 3.0 GPa.
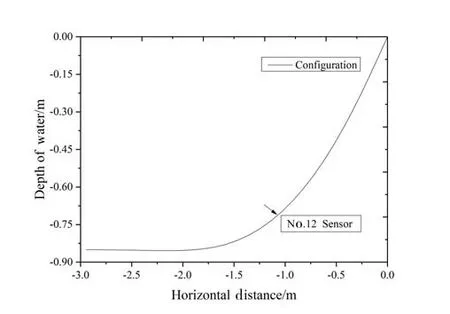
Fig.13 The equilibrium position of SCR
Figs.14-19 show comparison of simulation results with Test 1. In general, the results obtained are close to the test results in a certain degree, after comparison and analysis of simulation curves of 0.12 m/s-0.30 m/s.In the simulation,the simulation of Cable3D due to the difference of vortex-induced vibration model, the acceleration time history curve is not completely consistent with the experiment. But for the test in the 100 s, a variety of operating conditions are relatively stable approximation to test values. Deviation degree of stability to a certain extent shows the reliability of the algorithm.
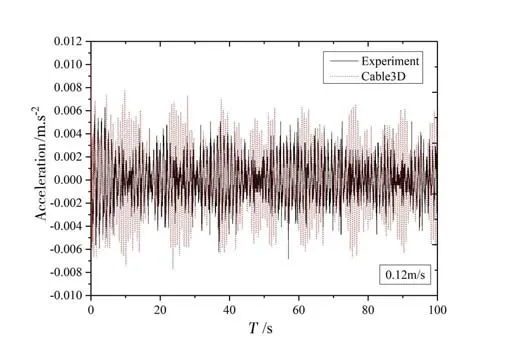
Fig.14 Time history of structural acceleration when the water velocity is 0.12 m/s for Cable3D and test
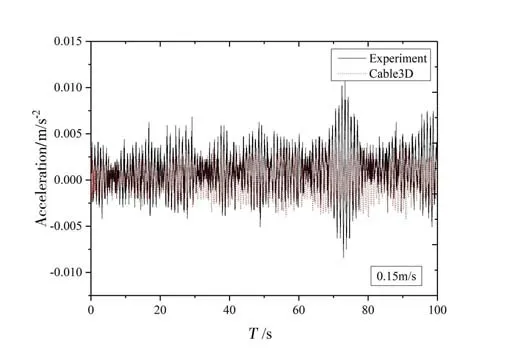
Fig.15 Time history of structural acceleration when the water velocity is 0.15 m/s for Cable3D and test
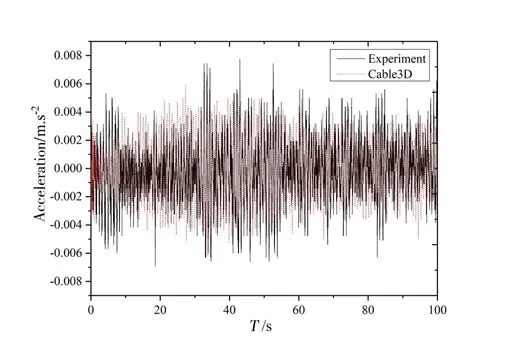
Fig.16 Time history of structural acceleration when the water velocity is 0.19 m/s for Cable3D and test
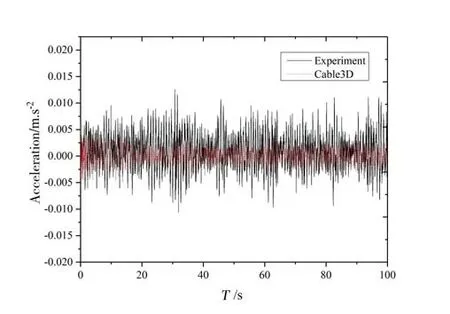
Fig.17 Time history of structural acceleration when the water velocity is 0.24 m/s for Cable3D and test
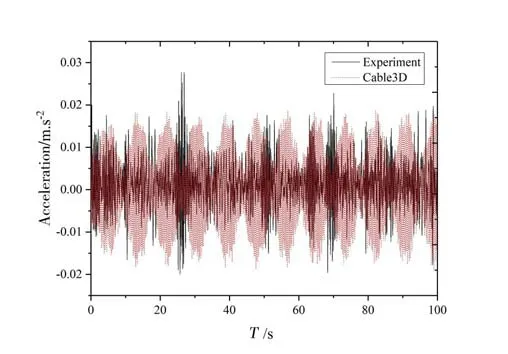
Fig.18 Time history of structural acceleration when the water velocity is 0.27 m/s for Cable3D and test

Fig.19 Time history of structural acceleration when the water velocity is 0.30 m/s for Cable3D and test
Specifically speaking, Fig.20 shows that the relationship of equilibrium position and flow velocity. Cable3D is in the similar with test data to a certain extent. It shows that the structure has rapid and large amplitude fluctuations after 0.25 m/s.
Fig.21 shows the relationship of extreme value and variation range with flow velocity. The model calculation with the test data has a similar trend,and the vortex-induced vibration amplitude increases with the increase of flow velocity, and presents a fast increasing trend after the 0.25 m/s.It is still in the non-locking area,but there is a certain gap with the test data.

Fig.20 The relationship of equilibrium position and flow velocity
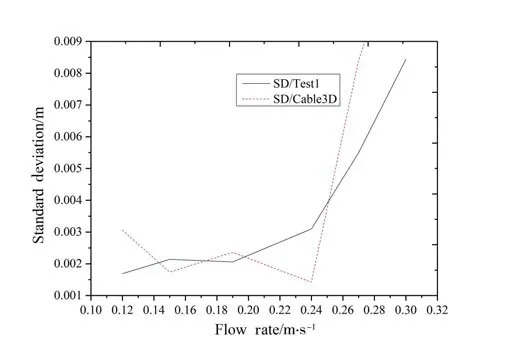
Fig.21 The relationship of standard deviation and flow velocity
Fig.22 shows the variation trend of the fluctuating and the maximum value of acceleration is close to the experimental data. The minimum difference is small, and there is a certain gap between the maximum and the interval range.
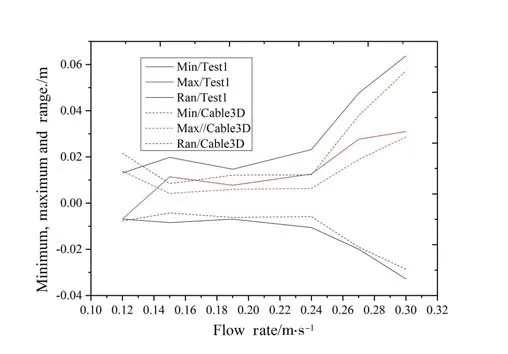
Fig.22 The relationship of extreme value&variation range and flow velocity
4 Conclusions
In this paper, the model of Cable3D large deflection slender beam is introduced, and the simulation test of two-directional vortex-induced vibration model considering fluid-solid coupling is adopted to compare the calculation of the acceleration time curve.
Through the above two groups of test data,it can basically be grasped that the characteristics from the response of the structure affected by the flow.When in non-locking zone,the vortex-induced vibration response increases with the increase of flow velocity. When vortex shedding frequency is similar to frequency for structural self-vibration, the structure has a resonance and respond to drastic changes.
From the equilibrium position, the relationship between the acceleration value, velocity curve and the standard deviation curve,it is known that the vortex-induced vibration amplitude increases with the increase of flow velocity, and presents a fast increasing trend after the 0.25 m/s.
It is shown that the Cable3D is in good agreement with the experimental data with the twodirectional vortex-induced vibration model in which the fluid-solid coupling is considered in the calculation.
However, the shortcoming in numerical simulation shows the simulation of the structure’s acceleration time history is close to test curve,but the simulation cannot fully meet the structural response. There are also existing precision problems with vortex-induced vibration model considering fluid-structure interaction in two directions of Cable3D.
Acknowledegement
Thanks to Prof. Zhang Jun of Texas A&M University for the Cable3D. Thanks to Prof.Weiping Huang of Ocean University of China. Thanks to Prof. Sun Yaodong and Gu Bingwei of Jiansu Ocean University.Thanks for all the help.

- 船舶力学的其它文章
- Effective Elastic Modulus Characteristics of Buoyancy Materials of Full-ocean-depth Manned Submersible
- Fatigue Strength Assessment of Welded Joints Using Strain Energy Density Method Based on NSIF
- Hydrodynamic Analysis of a Spar Platform under Asymmetrical Mooring System
- Effects of Inflow and Outflow of Floodwater on the Parametric Roll of a Damaged Ship
- Analysis of Drilling Riser in Re-entry Operation Under Complex Currents
- Nonlinear Numerical Simulation for Flexible Pipes Carcass Wet Collapse