Pedestrian perception-based level-of-service model at signalized intersection crosswalks
S. Marisamynathan· P. Vedagiri
Abstract Pedestrian level of service (PLOS) is an important measure of performance in the analysis of existing pedestrian crosswalk conditions. Many researchers have developed PLOS models based on pedestrian delay,turning vehicle effect, etc., using the conventional regression method. However,these factors may not effectively reflect the pedestrians’ perception of safety while crossing the crosswalk. The conventional regression method has failed to estimate accurate PLOS because of the primary assumption of an arbitrary probability distribution and vagueness in the input data.Moreover,PLOS categories in existing studies are based on rigid threshold values and the boundaries that are not well defined. Therefore, it is an important attempt to develop a PLOS model with respect to pedestrian safety,convenience,and efficiency at signalized intersections. For this purpose, a video-graphic and user perception surveys were conducted at selected nine signalized intersections in Mumbai, India. The data such as pedestrian, traffic, and geometric characteristics were extracted, and significant variables were identified using Pearson correlation analysis. A consistent and statistically calibrated PLOS model was developed using fuzzy linear regression analysis. PLOS was categorized into six levels(A-F) based on the predicted user perception score, and threshold values for each level were estimated using the fuzzy c-means clustering technique. The developed PLOS model and threshold values were validated with the fieldobserved data.Statistical performance tests were conducted and the results provided more accurate and reliable solutions. In conclusion, this study provides a feasible alternative to measure pedestrian perception-based level of service at signalized intersections. The developed PLOS model and threshold values would be useful for planning and designing pedestrian facilities and also in evaluating and improving the existing conditions of pedestrian facilities at signalized intersections.
Keywords Pedestrian · Signalized intersection · Level of service · Fuzzy regression · Fuzzy c-means
1 Introduction
A sustainable transportation system should provide mobility and flexibility in a safe and environment-friendly mode. Walking is one of the best examples for sustainable mode of transportation which is well suited for relatively short distance in urban cities. Due to the demands of vehicular traffic, most studies have investigated the operational condition of vehicular traffic and only a few have addressed pedestrian issues. Presently, pedestrians are part of most roadway environments; therefore, transport planners and engineers must paid more attention toward increasing the walkability and improving the pedestrian safety.
India is characterized by mixed traffic condition, which is defined as the condition where pedestrians and vehicles share the same space without proper lane discipline. Since this condition could lead to conflicts and accidents between road users, it is necessary to provide suitable facilities to improve the serviceability and safety of pedestrians.Mumbai is the most populous city in India with a population estimate of 21 million as of 2014.In 2012 and 2014,deaths due to conflicts between pedestrian and vehicle accounted for 8.3% and 12.9%, respectively, of the total number of road accident deaths in Mumbai,India[1,2]. It is inferred that an increase in the percentage of pedestrian death is due to the decrease in pedestrian serviceability and safety. Thus, understanding the need of pedestrians is important in transportation design and management of pedestrian facilities.
Transport planners and designers need to examine performance measures that could make pedestrians safe,convenient, and comfortable while crossing signalized intersections. User perception-based classification of pedestrian level of service (PLOS) is important for traffic engineers to distinguish the operational performance of pedestrian facilities. In this study, we made an attempt to develop a PLOS model using pedestrians’ perceptions of safety, convenience, and efficient level at signalized intersections. Based on PLOS classification, pedestrian facilities can be improved and better planned for future usage.
2 Review of earlier studies
Estimation of PLOS is much more complicated than that of motorized vehicle level of service (LOS), as it is more flexible [3]. Since PLOS is the most common measure of effectiveness in evaluating the walking conditions of existing pedestrian facilities, various studies have focused on PLOS model development at intersections, sidewalks[4-6],midblocks[7],stairways[8],and roadway segments[9, 10].
In 1965, the concept of LOS was originally introduced in the Highway Capacity Manual (HCM) for determining vehicle LOS based on the average stopped delay at signalized intersections. Later,HCM 2000 provided guidance to design and develop pedestrian facilities based on the quantitative measure of pedestrian delay and space requirements in six LOS categories (A-F) [11]. Several research studies have identified influencing variables other than pedestrian delay and space requirements, involving pedestrian characteristics, traffic characteristics, geometric characteristics, or combination of any of these characteristics. Pedestrian volume, bidirectional effect, platoon effects, area occupancy, pedestrian flow, walking speed,and flow ratio were used to develop PLOS models at signalized intersections [12-14]. Most of the existing PLOS models focus on improving pedestrian safety and comfort by considering potential conflicts between pedestrians and vehicles, vehicle volume, left and right turning vehicles,and speed of vehicles [15-19]. Various studies have proposed PLOS models with respect to waiting time or delay,green signal, congestion level, crosswalk width, level of space at corner,crossing facilities,traffic signs,intersection geometry features, and land use [13, 16, 20-24].
Recently, researchers have started to address PLOS using qualitative and quantitative data with the qualitative data representing the perception of pedestrian safety and comfort at signalized intersections [15, 21, 22]. Considering the various research outcomes, HCM 2010 has also revised the method for PLOS estimation with respect to qualitative and quantitative data. Demand flow, pedestrian delay,vehicle volume,speed,number of lanes,and number of right turn channelizing islands were incorporated in the mathematical PLOS score model, and LOSs based on traveler perception are listed [25].
Limited studies have developed PLOS models for Indian conditions [17, 26-29]. The pedestrian facilities such as sidewalks and crosswalks were evaluated with respect to peak hour pedestrian flow, and LOS rating was defined with respect to flow by using IRC 103-2012 [30]. One PLOS model at sidewalk was developed to assess various infrastructure facilities from land use pattern considering pedestrians’ perceptions, and the qualitative data-based PLOS model was built by adopting point system techniques[27].Another PLOS model for sidewalk was developed by combining qualitative and qualitative data and adopting stepwise regression analysis method and Khisty’s relationship chart [29]. The recently developed Indian Highway Capacity Manual (Indo-HCM) and Indian Road Congress (IRC 103-2012) defined the PLOS rating (AF) with respect to pedestrian delay (in seconds) for crosswalk at signalized intersections [31, 32]. The Indo-HCM defined that PLOS is a measure for assessing the operating conditions of facilities in a quantitative manner.Therefore,the PLOS rating at crosswalk developed in exiting Indian studies and manuals are based on quantitative or qualitative measure, but combination of qualitative and quantitative measure is still missing in Indian conditions, which is a research gap to be addressed in the present study.
Many researchers have developed PLOS models using conventional regression methods such as linear, generalized linear, stepwise multivariables, or binary/cumulative/ordered logit models[13,17,18,21,24].The most widely used conventional regression method is generally based on two assumptions: (1) the observations follow some probability distributions,especially the normal distribution,and(2)the mean values are varying with respect to independent variables; and the regression equation is very simple to develop. In practice, it has been found that the data are fuzzy in nature and cannot be defined by probability distributions. The data described in a subjective type such as‘‘very dangerous’’ and ‘‘approximately equal to 5’’ are typical examples.Fuzzy linear regression(FLR)method is a more suitable technique to develop regression models when the observations are subjective, complex, and of qualitative data type. The FLR based on a possibility distribution reflects the membership values of the dependent variable rather than a probability distribution [33].
In HCM 2010,the listed range of scores associated with each LOS criterion are common for both pedestrian and bicycle travel modes at signalized intersections, and also the threshold values are not stated [25]. Various studies follow a medium value or step function method to define threshold values for PLOS criteria [17, 18, 22], and the rigid boundaries between LOS criteria have failed to represent the pedestrian operational conditions. Cluster analysis is recognized as an important technique for classifying data, by finding clusters and dissimilarities between different data clusters. Most of the existing studies use Kmeans clustering in transportation problems, such as defining LOS for urban arterial roads, LOS for freeways,and vehicle LOS at intersections [34]. Few researchers have utilized fuzzy c-means clustering technique for defining vehicle LOS classification at intersections and urban roads [35-38]. None of the studies, at least to the author’s knowledge,have utilized fuzzy c-means clustering techniques for defining threshold values for PLOS at signalized intersections in India.
Earlier works in PLOS for signalized intersections have considered almost all of the factors influencing pedestrian sense of safety, comfort, and convenience while crossing intersections. However, pedestrian delay with respect to pedestrian crossing behavior, traffic volume under heterogeneous conditions, median width, and conflict between pedestrian and vehicle, which also represent pedestrian safety, convenience and efficiency level while crossing signalized intersections, are missing in the existing PLOS studies. A few studies have developed PLOS for Indian conditions using the conventional linear regression (CLR)method but the estimates fail to provide accurate PLOS[17, 27, 29]. Existing international standard threshold values for PLOS do not suit for Indian conditions due to mixed traffic and variations in users behaviors. This study attempts to contribute an alternative methodology for PLOS model development and defines threshold values that may overcome limitations of the conventional regression analysis and the medium value method.The FLR method is used to develop the PLOS model, and the fuzzy c-means clustering technique is applied to define the threshold value of each PLOS classification.
3 Methodology
The PLOS model proposed in this study follows a novel procedure of combining quantitative as well as qualitative data, and the major steps involved in PLOS model development are outlined in Fig. 1. The data collection and extraction from selected nine signalized intersections are discussed in detail. Details about identification of significant variables, PLOS model development, definition of threshold values,and validation of the model are discussed next.
3.1 Model formulation
The present study considers two techniques, fuzzy linear regression (FLR) and fuzzy c-means (FCM) clustering techniques for modelling and classifying PLOS.
3.1.1 Fuzzy linear regression model
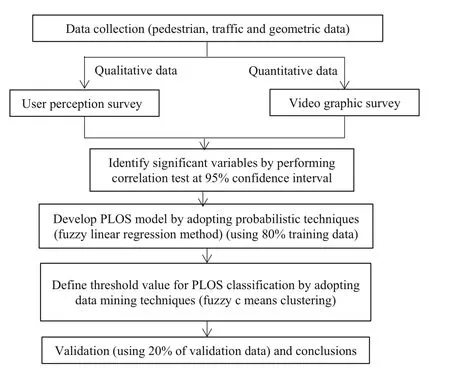
Fig. 1 Major steps involved in PLOS model development
In past, a variety of deterministic and stochastic models have been developed and different kinds of formulas,equations,and assumptions were used to solve all kinds of complex transportation engineering problems. Most of the transportation problems are solved using subjective data such as user response, which is very difficult to quantify.Transportation parameters are characterized by uncertainty,subjectivity, imprecision, and ambiguity. Drivers and pedestrians use this subjective knowledge information on a daily basis while making decisions. In the conventional regression analysis,the observations are assumed to follow some particular probability distributions, most of the time,the normal distributions, and the means of these particular probability distributions vary in some systematic fashion with the values of the independent variables. In practice,sometimes it is difficult to find a probability distribution of the observations, especially when the observations are fuzzy in nature. The observations described by subjective judgment or linguistic terms such as excellent(equal to 1),good (equal to 2), average (equal to 3), poor (equal to 4),and terrible (equal to 5) are typical examples. The parameter estimation under this fuzzy environment is a challenge to the CLR analysis. Therefore, the existing CLR-based model was not fitted to estimate solution for qualitative or subjective data, especially in LOS model development [7, 24]. However, these problems can be rectified with the FLR method [39, 40] to develop LOS model at signalized intersections. FLR analysis is the best method to develop model with fuzzy data and also it allows possibility distributions [41-43].
FLR based on possibility distribution reflects the membership values of the dependent variables rather than a probability distribution [41, 42, 44]. The generalized form of FLR model is as follows:

where for each j, X1j,X2j,...,Xnjare the values of n fuzzy or crisp independent variables X1,X2,...,Xn, and Yiis the corresponding value of fuzzy dependent variable Y;A0,A1,...,Anare the coefficients of the model and εiis the fuzzy error term. The observations of Xiand Yiare fuzzy;therefore, it falls into the category of fuzzy regression analysis. In this section, the four-stage FLR model development is described step by step with a single independent and dependent fuzzy variable,and the same methodology is applied to solve the multivariable problem.
Stage 1 Initialize the dependent and independent variables. Identify the fuzzy and crispy variables from the listed variables.
Stage 2 Apply the membership function to the fuzzy variables.In this section,triangular membership function is considered with three point values such as lower,middle or average, and upper value. The FLR model for one independent and one dependent fuzzy variable is

where L,M, and U indicate the lower, middle or average,and upper values of corresponding variables at selected interval or cycle;andare all triangular fuzzy numbers, and therefore,+is the approximately triangular fuzzy number

Stage 3 To find an estimate forand,and minimize the following sum of squared distances [42]:
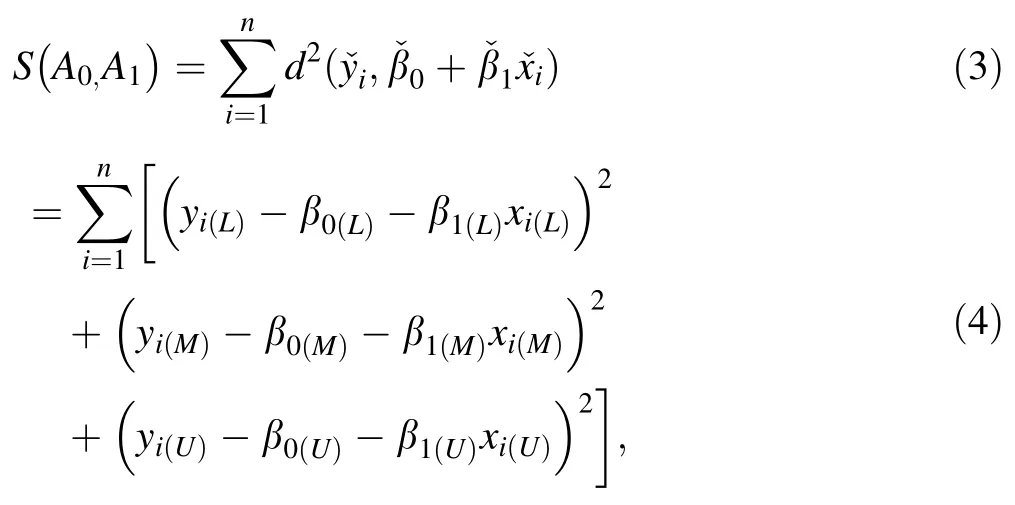
where S() is total sum of squares; d is explained sum of squares; xiand yiare the triangular fuzzy member of independent and dependent variables, respectively; β0and β1are coefficients of model.
Differentiating with respect to β0(L), β0(M), β0(U), β1(L),β1(M), and β1(U), we obtain the following estimates ofand:

Stage 4 Many defuzzification methods have been proposed in the existing studies and the centroid method is the most prevalent and physically appealing one, as it weighs all the values with different possibilities to form a single value [45, 46]. Letbe the defuzzified values ofand the solution based on centroid method is

where μY(y) is the deviation of each variable from the mean.
This method is used to develop PLOS models, and the same procedure can be applied for solving the multiple variable fuzzy regression models.
3.1.2 Fuzzy c-means clustering
Existing studies define six LOSs for each type of facility,from A to F,and the medium value method or step function approach is used to estimate threshold values for various LOS. The use of distinct boundaries limits the subjective and continuous characteristics of the quality of service and the rigid threshold values fail to provide accurate LOS.From the existing literature, it was found that data mining is the most suitable method for the classification of large data, especially cluster analysis. Cluster analysis refers to the process of partitioning a finite data set of objects(X) into a certain number of natural and homogeneous clusters (c subsets). There are various methods of data clustering and every method has its own advantages and disadvantages. In this study, an FCM clustering technique was used to determine the threshold values for different classification of LOS. In the FCM technique, each qualitative data point is not rigidly assigned to only one cluster,but rather to a few clusters with certain membership values[35]. The framework of FCM method is given below in a step-by-step procedure.
Step 1 For a data set consisting N data points, select the desired number of clusters, k, where 2 <k <N.
Step 2 Generate a starting center point for each of the k clusters.
Step 3 Calculate the distance from each of the N points to each of the k clusters, i.e., dik. The distance is calculated using Euclidean distance, the most widely used method, as follows:

Step 4 Assign a proportional or fuzzy membership of the N points to each of the k clusters.
Step 5 Find the new center point (c) for each of the k clusters by finding the weighted average:

where x is the nth data point,u is the cluster membership of the data point for the nth cluster k, and q is the fuzzy exponent, calculated from Step 4.
Step 6 Repeat Steps 3,4,and 5 until there are no changes in the cluster membership or proportional.
3.2 Factors influencing PLOS at signalized intersections
Based on the outcome of literature reviews and field observations (preliminary survey), several possible factors influencing PLOS at signalized intersections were identified for Indian conditions.The selected factors are listed in three main categories as shown in Table 1.
Interaction between pedestrians and vehicles was also considered as an important factor of influence in PLOS.India is known for its heterogeneous traffic conditions with high pedestrian and traffic flow; thus, interaction between pedestrians and vehicles is highly possible,due to the 60%pedestrian noncompliance behavior [47]. In this study,interaction between a pedestrian and a vehicle is defined in two ways: (1) due to pedestrian noncompliance behavior with signal during pedestrian nongreen phase, and (2) due to free left turn or noncompliance behavior of drivers during pedestrian green phase. During noncompliance behavior, the rolling behavior of pedestrians was not considered in this study. According to the above explanation,there are only two possible outcomes which are 0 to 1:0 for pedestrian not interacting with vehicle in crosswalk and 1 for pedestrian interacting with vehicle in crosswalk. The model for probabilities of interaction between pedestrian and vehicle in crosswalk is adopted from the authors’published works [47]. The study identified that pedestrian crossing direction, suitable gap, approaching vehicle direction, and approaching vehicle lane have a significant effect on pedestrian-vehicular interaction in crosswalks according to Pearson’s correlation test conducted at the 95% confidence interval in SPSS 16.0 software. A binary logit model was developed with NLOGIT 4 software.
4 Data collection
The data were collected by conducting user perception and video-graphic surveys during peak hour at signalized intersections. The user perception survey was conducted with the help of investigators placed on selected signalized intersections under typical traffic conditions to question about pedestrians’ perception on level of safety, convenience, and efficiency while crossing the intersections.Simultaneously, video-graphic survey was performed to collect information on several primary factors influencing PLOS at signalized intersections.
4.1 Site selection
To cover the typical traffic and roadway conditions in India, nine signalized intersections were selected from a list of all signalized intersections in Mumbai suburban areawith high pedestrian demand. All approaches at the selected signalized intersections have two-way traffic and bidirectional pedestrian flow without any table top crossing coupled with blinking green signal for left turning traffic movement. The sites were of a typical four-arm type with fixed signal time and phase time. Basic information on the study sites are presented in Table 2.
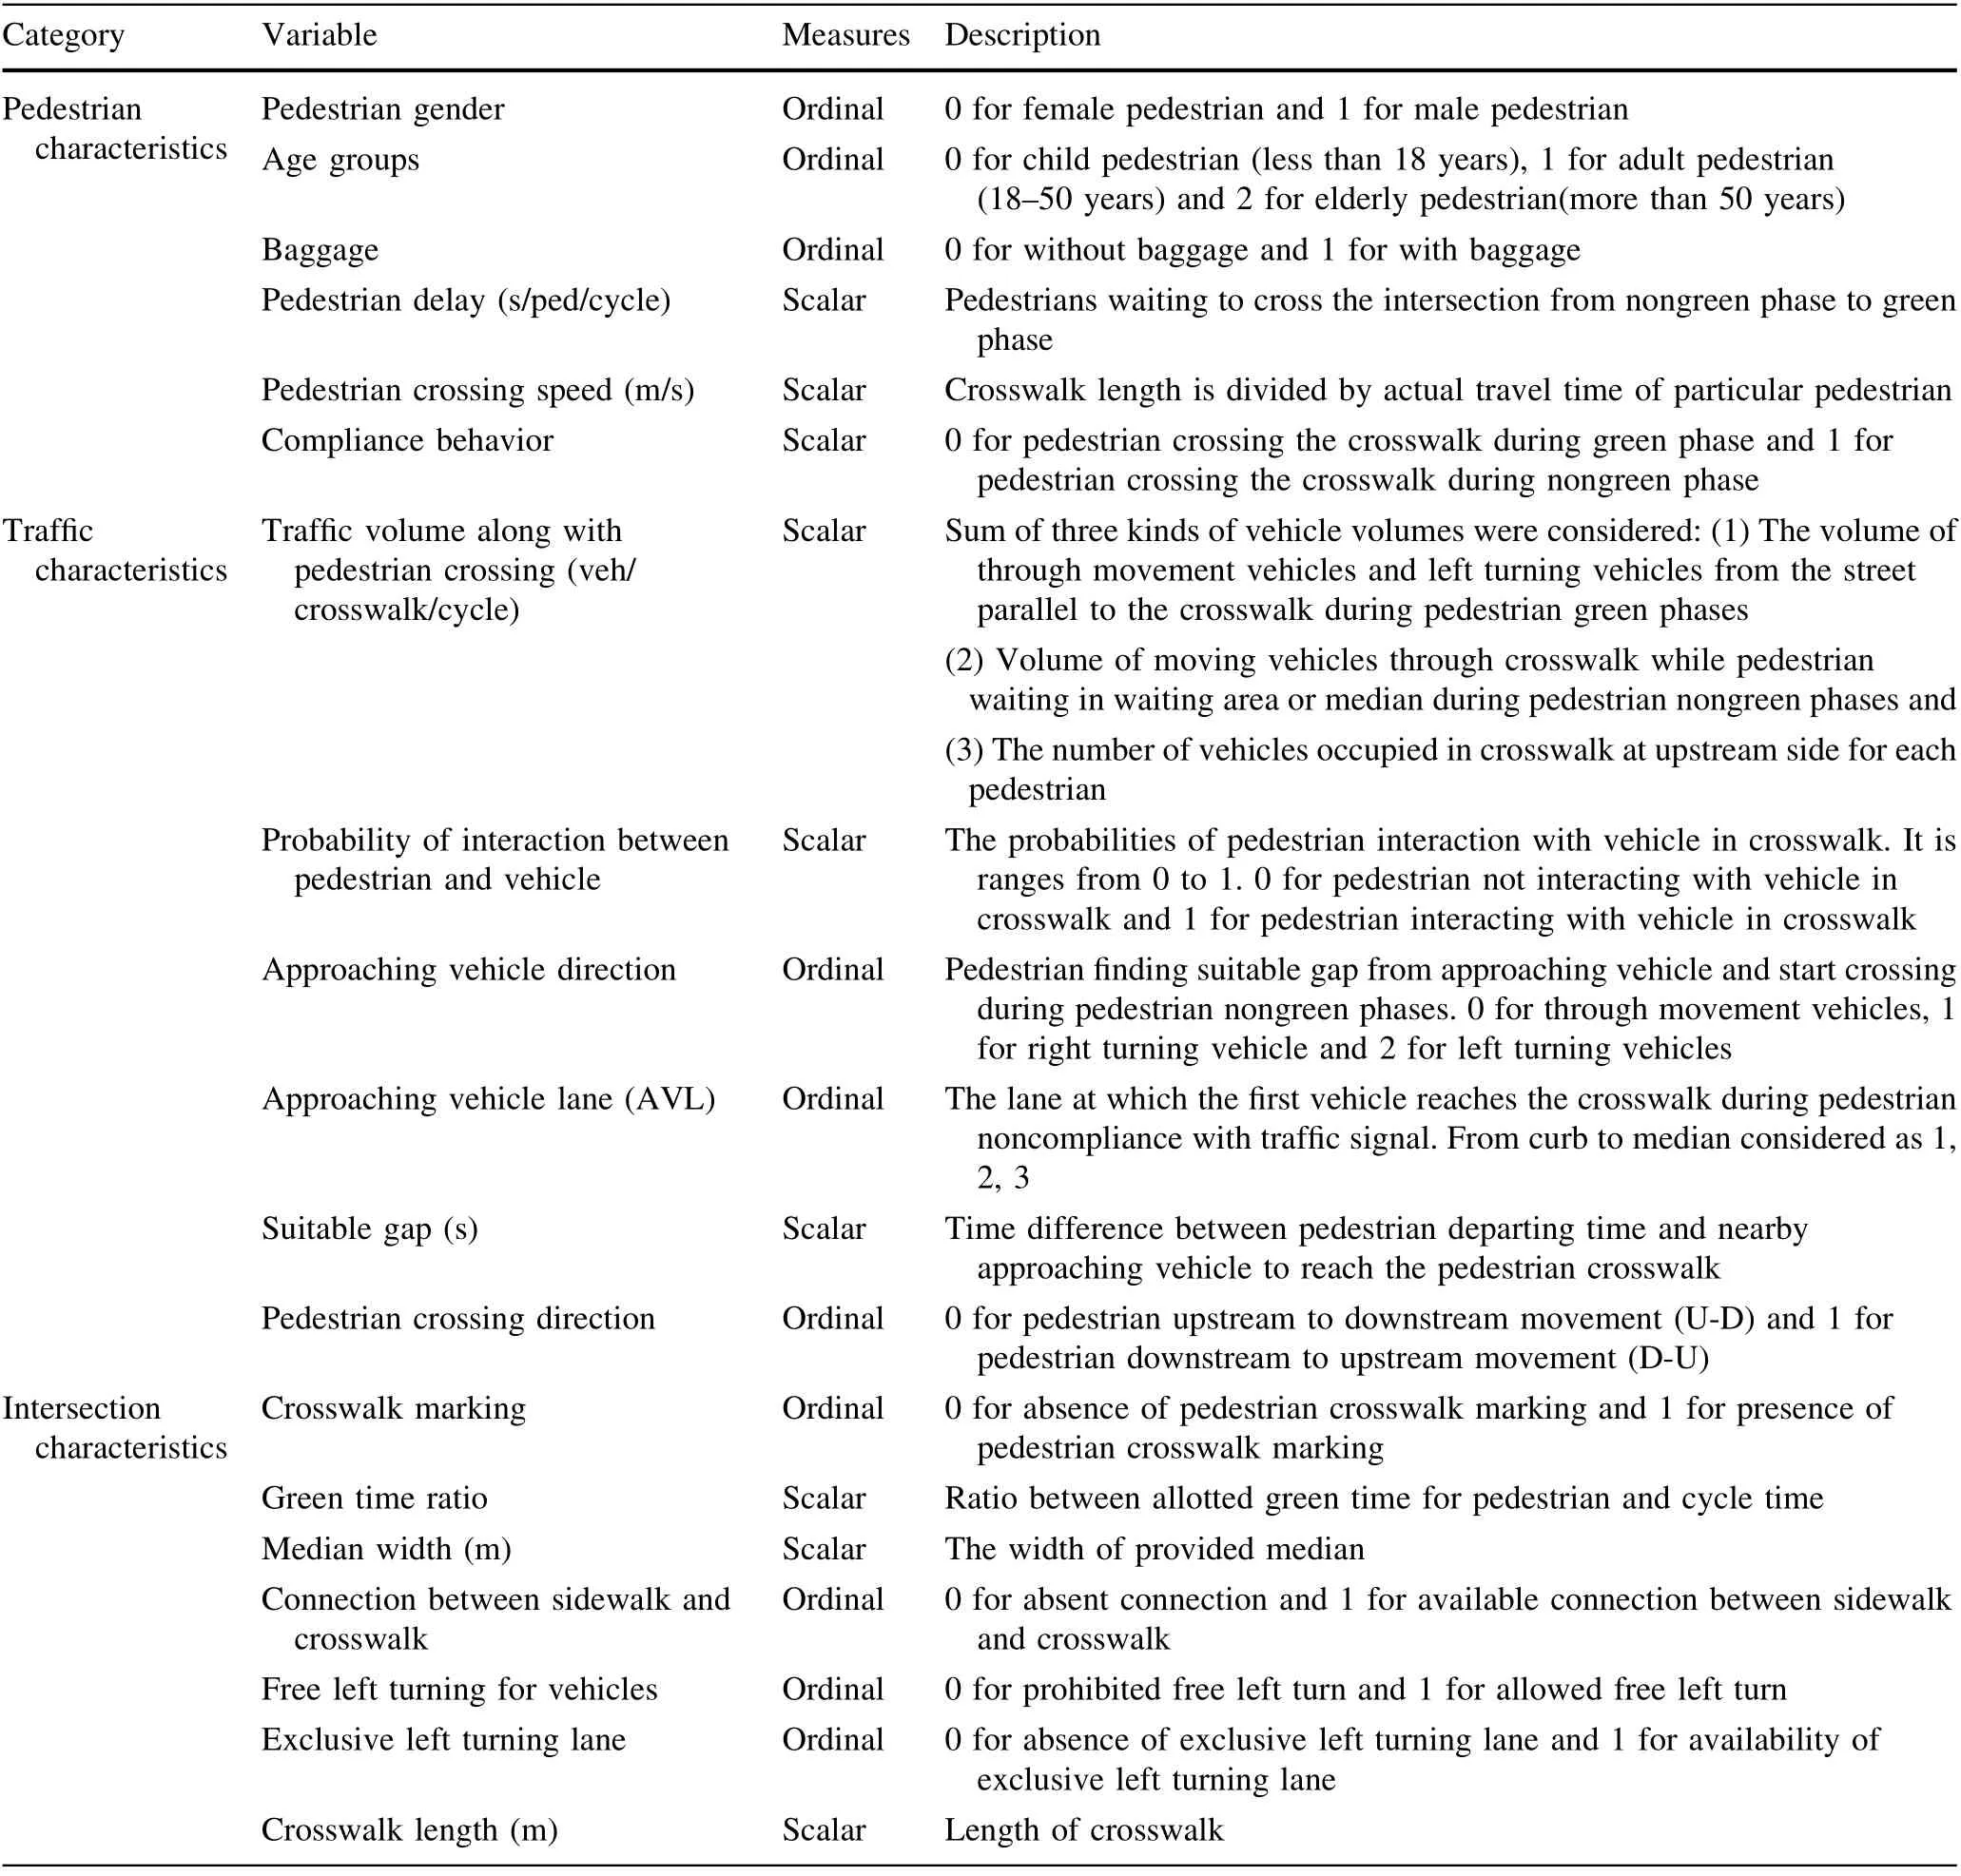
Table 1 Selected variables and descriptions
4.2 Video-graphic survey
The characteristics of the pedestrian,traffic,and geometric conditions at signalized intersections were collected with a video-graphic survey.Cameras were set up in the direction of pedestrian upstream to downstream movement and downstream to upstream movement at selected crosswalk in each intersection. The video-graphic survey covered the selected crosswalk and recorded pedestrian movements throughout the study area.The required data were extracted manually in laboratory;it takes longer duration but has theadvantage of providing more accurate data and long-lasting record of events.
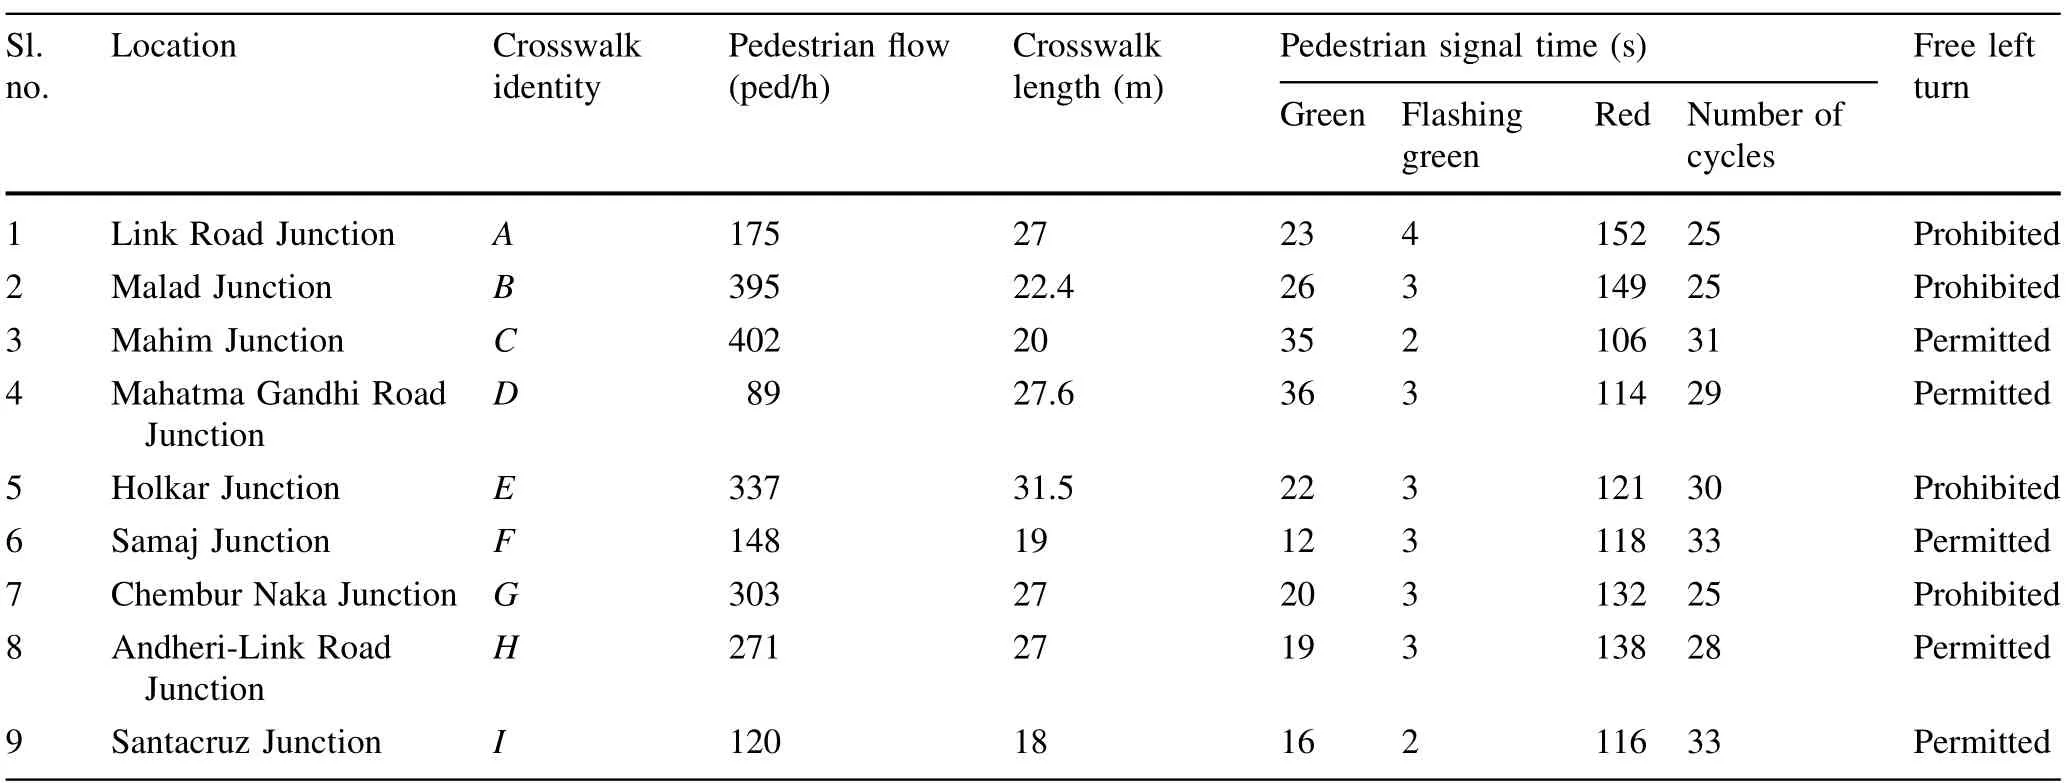
Table 2 Selected study locations and basic information
4.3 User perception survey
Questions were asked to pedestrians immediately after crossing the crosswalk by a number of trained investigators who stood on either side of the crosswalk. Meaning and importance of each question have been explained to each pedestrian personally and were also stated in user perception survey form before acquiring their rating. Ratings range from 1 to 5 for pedestrian safety, convenience, and efficiency level. The sample photos of the investigators conducting the survey are shown in Fig. 2.Figure 3 shows a sample user perception survey form and the explanation of LOS that was given to pedestrians.
4.4 Data
The required data were extracted from collected video tapes using AVS video editor software at an accuracy of 33 ms (30 frames per second). The listed variables were extracted from video for each pedestrian who have responded to the user perception survey, and the descriptive statistics are shown in Table 3.
The user perception survey form comprised three questions about how pedestrians perceive when they cross crosswalk at signalized intersections. A total of 654 pedestrians participated in the user perception survey: 522 males and 132 females.About 7%of pedestrians were less than age 18, 79% were 18-50, and 14% were aged 50 or older. The gender and age distribution of each survey site are shown in Table 4. A selected portion of a larger population is chosen as samples to gain information about the whole population.Sample size test were conducted at 99%confidence interval. Total population is 2,240 pedestrians from selected sites,and it is reasonable to assume a margin error of 5% with a response rate of 50%, which yields an approximate sample size of 513 pedestrians. The value of statistical sample size result(513 ped)is less than real-time respondents’size(654 ped);it shows the significance level of collected samples for developing PLOS models.
Three sets of scores were collected from respondents and analyzed in four groups, namely the safety, convenience, efficiency, and combined score (sum of safety,convenience and efficiency scores). The observed PLOS score was the average combined score, and was computed by applying the centroid method between combined scores at each cycle. In this study, the triangular membership function was used for model formulation. Therefore, the outcome of the centroid method was equal to the average combined scores. The detailed statistics of each score group for all locations are summarized in Table 5.
5 PLOS model
PLOS is an important measure of performance in analyses of signalized intersections based on user perceptions. In this study, an alternative methodology is proposed for evaluation of PLOS at signalized intersections. A PLOS model is developed and validated using data from nine locations, which consists of 654 pedestrian samples. The modeling process includes the following steps:(a)identification of significant variables via Pearson’s correlation,(b)estimation of the coefficients for significant variables in the FLR model,and(c)definition of the threshold value for each LOS category based on FCM clustering.

Fig. 2 Selected crosswalk (E) and investigators with respondents pedestrians
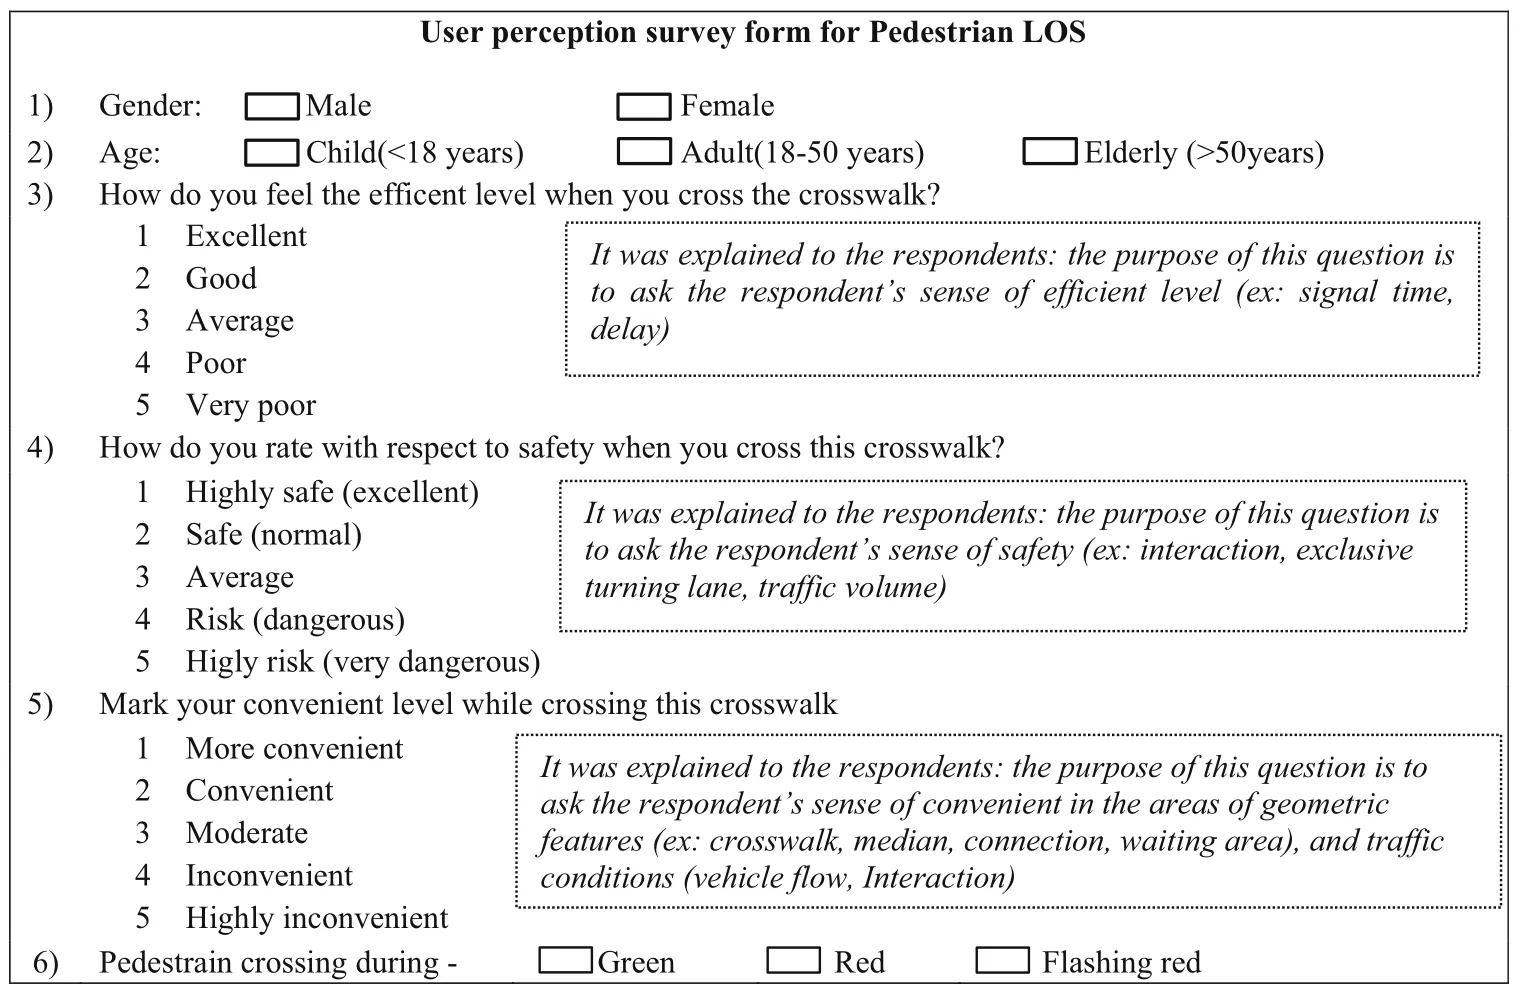
Fig. 3 Pedestrians perceptions survey form
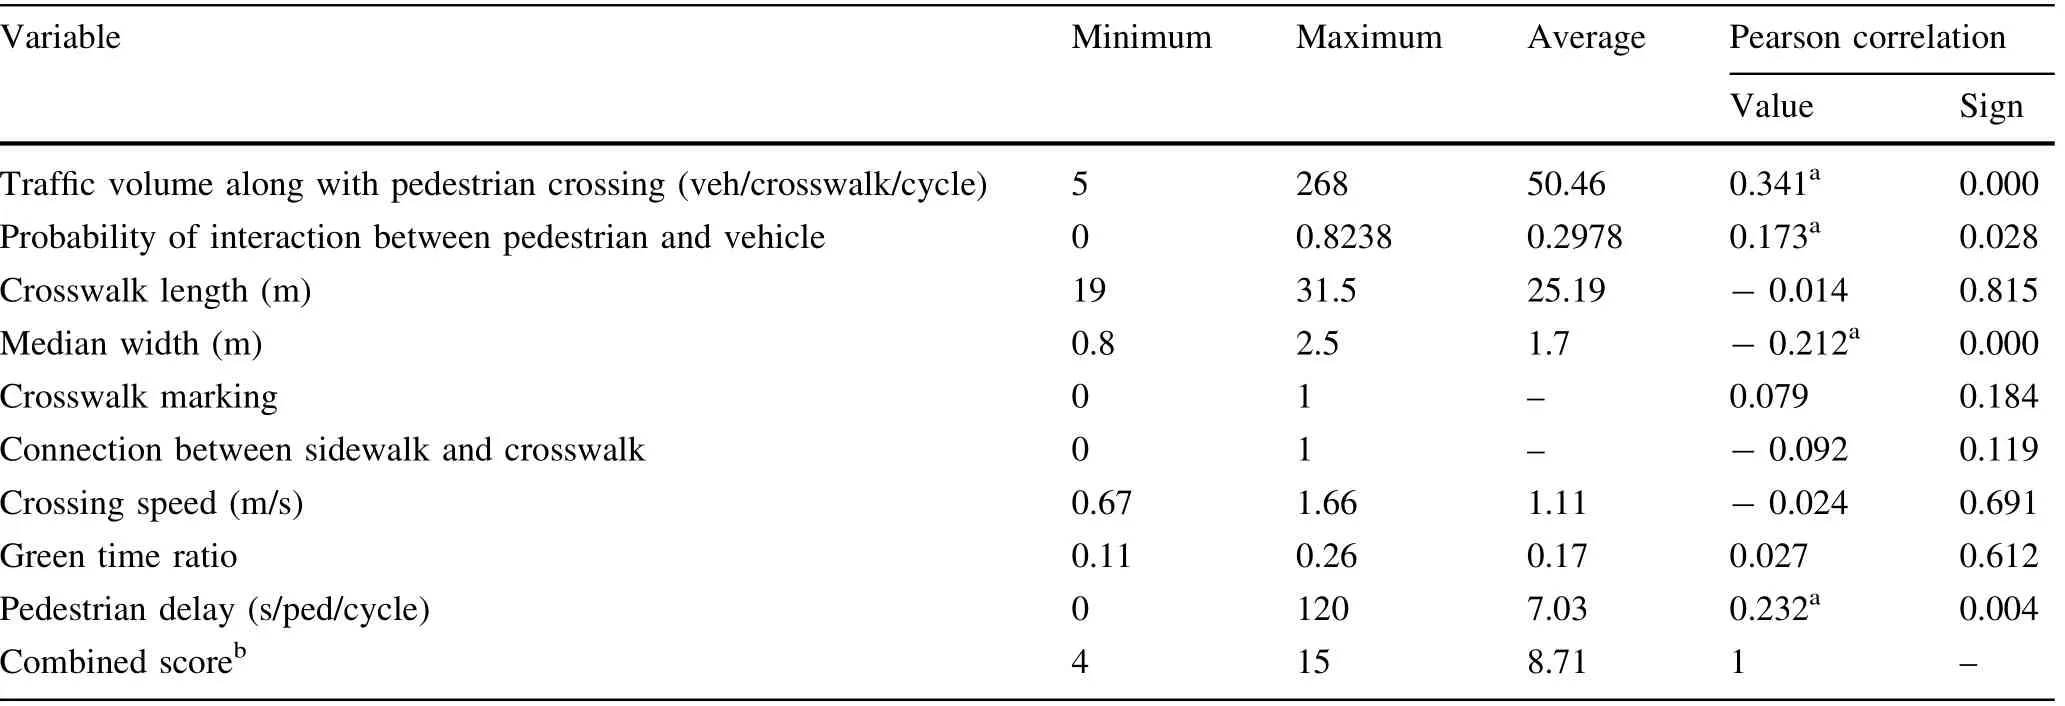
Table 3 Statistics of selected variables and Pearson correlation results

Table 4 Gender and age distribution of each surveys site
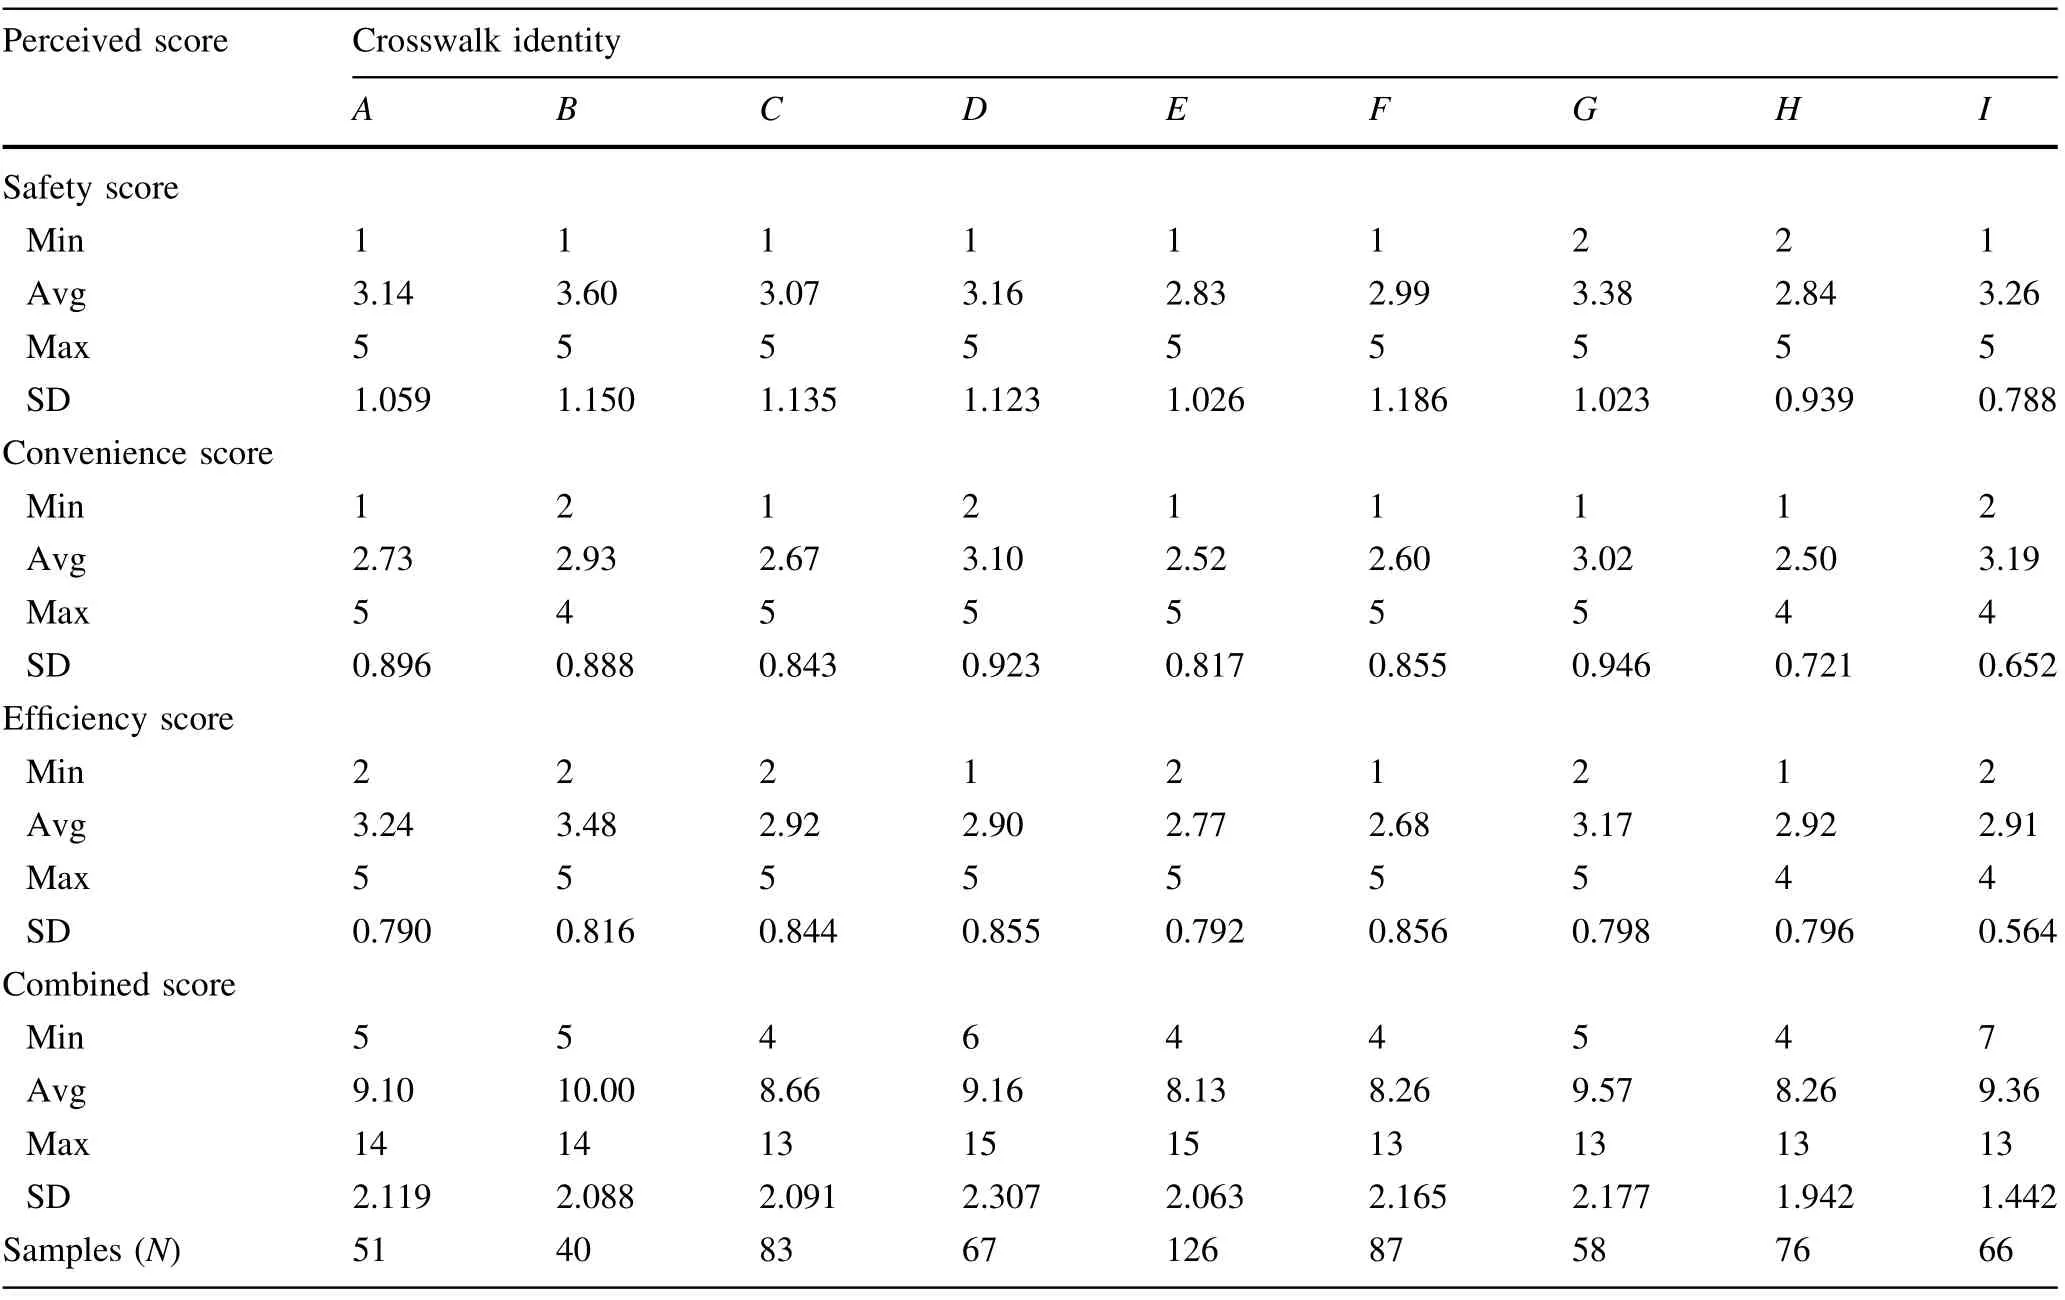
Table 5 Descriptive statistics of pedestrian perception score
5.1 Identification of significant variables
Observed PLOS scores (sum of safety, convenience, and efficiency scores) of each pedestrian who have responded to user perception survey were calculated and compared with all the possible influencing variables which were listed in Table 3.The significant variables were identified by Pearson correlation test for PLOS model development. A 95% confidence level was selected with a corresponding critical p value of 0.05.If the calculated p values were less than 0.05, then the corresponding variables were included in the model and the other variables were neglected. The Pearson correlation test was performed using the statistical package for the social science (SPSS 16.0) and the results are also shown in Table 3.
From Table 3, the factors, traffic volume along with pedestrian crossing, pedestrian delay, probability of interaction between pedestrian and vehicle, and median width were found to have significant effect on the PLOS at signalized intersections.The following section briefly outlines some of the aspects of the variables and how the dependent variable responds to them.
5.1.1 Vehicular volume
The vehicular volume had more significant effect with a positive sign at 99% confidence interval. The effect of vehicular volume is obtained by adding volume of parallel through movement vehicles (Vparallel), volume of moving vehicles while pedestrian waiting in the waiting area or median (Vmoving), and volume of occupied vehicles in crosswalk (Voccupied) while pedestrian crossing crosswalk.As vehicle frequency increases, the pedestrian sense of safety and comfort decreases and the PLOS score increases.
From selected study locations, pedestrian green phases were found to share with vehicular movement which are moving parallel to pedestrian crosswalk and it highly affects pedestrian sense of safety. Pedestrian’s waiting in the waiting area or in the median feel insecure and inconvenient while facing high vehicle movement. Vehicles were also found to occupy pedestrian crosswalk marking and crossing area, influencing pedestrian safety and convenience levels.
5.1.2 Pedestrian delay
Ensuring efficiency level, proper signal phase, and signal timing is essential in pedestrian sense of efficiency at the signalized intersection. Efficiency level is affected by pedestrian waiting time delay or pedestrian nongreen phases.Pedestrian waiting time delay had significant effect on PLOS score with a positive sign. It is inferred that an increase in the value of pedestrian delay results in increase of PLOS score.The pedestrians arriving at green phase did not receive any waiting time delay,and the minimum value for waiting time delay is zero.
5.1.3 Probability of pedestrian interaction with vehicle in crosswalk
The probability of pedestrian interacting with vehicle in crosswalk had significant effect on PLOS score with positive sign, and it indicates that an increase in the value of probabilities of interaction results in an increase in the PLOS score. The value of probability of interaction is calculated by the following equation [47]:

where Ppvdenotes the probability of pedestrian interaction with vehicle in crosswalk, Davthe approaching vehicle direction, L the approaching vehicle lane, Gsthe suitable gap, and Dpcthe pedestrian crossing direction. The mentioned parameters are described in Table 1.
In Eq. (11), the sign of approaching vehicle direction is negative;i.e.,pedestrians are feeling vulnerable when they encounter a left turning vehicle. The signal phases allow vehicles for free left turning and this affects the pedestrian safety during green phases. Usually, pedestrians identify the gap size from the first lane of the crosswalk to the approaching vehicle and will not comply with traffic signal based on that. However, for lanes farther from the pedestrian, they are unable to identify the gap size and often interact with vehicles which may result in accidents or delay to pedestrians, and hence, the sign of approaching vehicle lane is positive. The sign of suitable gap is negative; i.e., as the pedestrian acceptance gap size increases,the frequency of interaction between vehicles and pedestrian decreases. The acceptance of a smaller gap size causes the pedestrian to feel risky. The sign of pedestrian crossing direction is positive, i.e., the pedestrian safety level during crossing the D-U direction is lower than the U-D direction crossing. The probability of pedestrian interacting with vehicle in crosswalk is zero when the pedestrian and driver comply with traffic signals.
5.1.4 Pedestrian facilities
Pedestrian sense of safety and convenience in the signalized intersection environment are highly affected by the presence of refuge island and median width conditions.According to Pearson’s correlation result, the value of median width had significant effect on PLOS at signalized intersection:The sign of model variable is negative;i.e.,as the median width increases, the PLOS score decreases.Shorter median width or refuge island affects the pedestrian convenience level. When the median width is decreased, pedestrians are forced to wait in crosswalk or road and it ultimately affect pedestrians’ sense of convenience and safety.
5.2 Development of PLOS model
The four significant variables identified from the correlation test were considered to be the most probable primary factors that affect pedestrians’ sense of safety, convenience,and efficiency at signalized intersections,and these variables were used to develop the PLOS model. Thepreliminary structure of the proposed PLOS model is represented in the following mathematical expression:
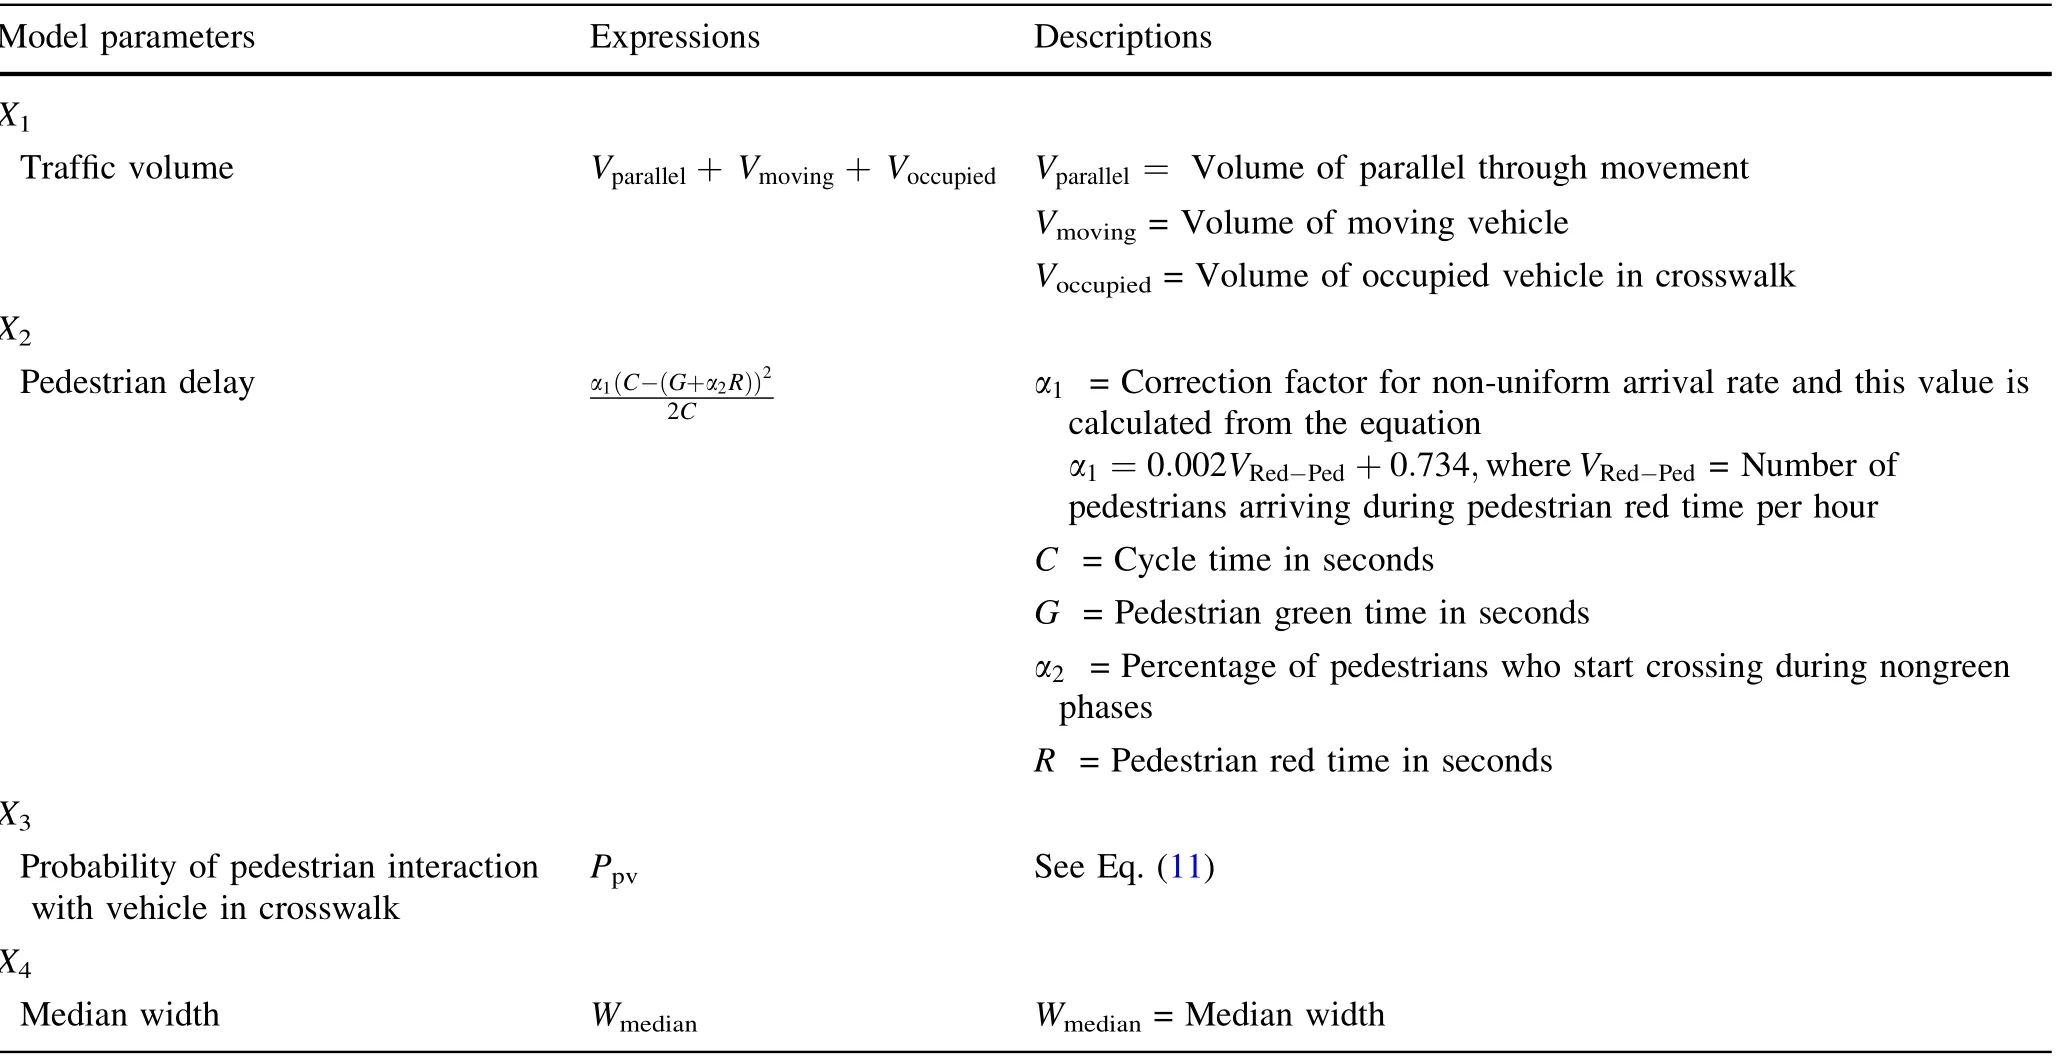
Table 6 Model parameters with descriptions

and the terms in the expression are described in Table 6.The traffic volume per crosswalk per cycle was counted from video, and the median width was measured directly from the field using measuring wheels. Values of the pedestrian delay and the probability of pedestrian interaction with vehicles in crosswalk are calculated using the equations developed by the authors [47-49], as shown in Table 6.
The four-step FLR technique was applied to the mathematical model using the MATLAB R2014 to find the estimate of the independent variables. Table 7 shows the estimated values of independent variables from FLR analysis. The fuzzy regression model for the PLOS constructed from the four-step method is

The PLOS score (SPLOS) was predicted for all input observations using the developed PLOS model from the FLR technique. The predicted and observed PLOS scores were compared using Origin Pro 9.1 and the root mean square error value(1.0905)shows that the developed PLOS model results are close to the observed values. The Rsquare value (0.6117) indicates that 61.17% of the variation in the predicted PLOS score has been explained by explanatory variables and the predicted model fairly fits with the observed values. The t values for independent variables were estimated and the results presented in Table 7. Comparison of estimated t values with t table values indicates that all variables are significant at 95% confidence interval. Therefore, the model results are useful in estimating the pedestrian perceived level of service score with respect to safety, convenience and efficiency at signalized intersections.
5.3 Proposed PLOS threshold values for LOS classification
According to the HCM 2010, pedestrian conditions in a signalized intersection are categorized by six LOSs: A-F,where A represents the best operational conditions and F the worst operational conditions. A minimum of 4 and a maximum of 15 for the predicted combined PLOS score were used in this analysis. The clustering technique was performed in MATLAB R2014 using FCM algorithm. In FCM clustering, the objective function was minimized to obtain the best threshold values. The optimization is stopped when the improvement in objective function between consecutive iterations is less than 0.001. Figure 4 displays the clustering results of the input data and Table 8 shows the proposed threshold value for each PLOS category.
In Table 8, the conditions for pedestrian crossing a crosswalk have been classified into A (best possible) to F (worst possible) and rated with respect to safety, convenience, and comfort level. Based on pedestrian perception survey, the percentages of PLOS A-F were 2.75,16.75, 28.75, 32.875, 7.625, and 11.25, respectively.
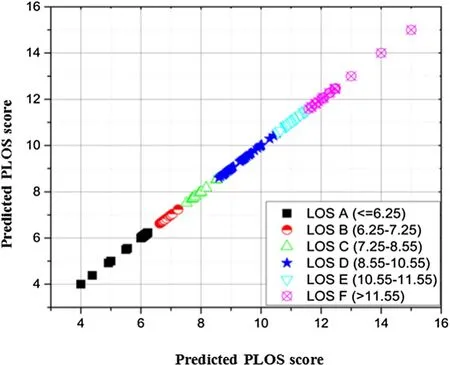
Fig. 4 Results of PLOS ranges from FCM analysis
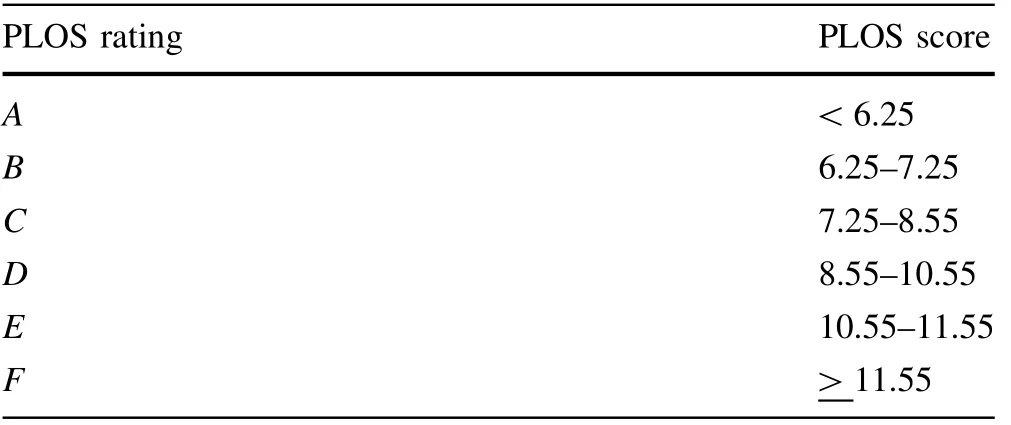
Table 8 PLOS rating
The best threshold values for a fixed number of clusters and the parameterized cluster shapes were regularly identified using the clustering technique. While performing clustering technique, fitness function was plotted using the identified threshold values in the end of each iteration process. The best fitness function was identified based on statistical performance evaluation parameters such as MAPE and RMSE. Then, a box plot was used to test the threshold values and to verify which of the PLOS scores falls under the same category. The box plot was made using the predicted and observed PLOS scores. In order to verify the correctness of the obtained threshold values, the threshold values with respect to the predicted PLOS score from FCM and the threshold ranges with respect to the observed PLOS score from the box plot were compared.
For an observed PLOS range from 6 to 7, the predicted PLOS score is 6.25 using the FCM technique and the observed threshold value is 6.5 for the field data obtained using the box plot technique.Thus,the predicted value lies in threshold 1. The observed threshold values closely match with the FCM clustering predicted threshold values.Likewise, other threshold values for the predicted PLOS scores were compared with threshold ranges of the observed PLOS scores.All of the predicted values from the FLR technique were found to lie between the observed ranges found using the box plot technique. Further, the error values between observed and predicted threshold values were calculated for FCM (0.65) clustering techniques and are found to be small. The results infer that a reasonable good classification has been found for PLOS categories at signalized intersections using the FLR technique.
5.4 Validation
The validation of the developed model and the defined threshold values were carried out with data collected at a new crosswalk in the Santacruz Junction, Mumbai, India.Video-graphic survey and user perception survey were also conducted at this location, and a total of 66 pedestrians were interviewed with the same user perception survey form immediately after crossing the crosswalk. From the response of the 66 respondents, the observed pedestrians perceived LOS score was 9.76 and the observed LOS rating with respect to the observed LOS score was D. From the field survey,the observed median width and traffic volume per crosswalk per cycle at the selected crosswalk were 0.7 m and 41 veh/crosswalk/cycle, respectively. The estimated pedestrian delay and probability of pedestrian interaction with vehicle in crosswalk were 40.73 s/ped and 0.261, calculated using expressions given in Table 6. The predicted PLOS score and rating were 9.82 and PLOS D,respectively, obtained from Eq. (9) and Table 7. The percentage difference between the observed PLOS score and the predicted PLOS score was 0.62% and the error shows that the predicted value was close to the field-observed value. PLOS categories for predicted and observed scores were also identical at PLOS D. The minimum difference between the observed and predicted PLOS scores proves that the proposed PLOS models have high accuracy in estimation of the perceived PLOS score with respect to safety, convenience, and efficiency level at signalized intersections.
Furthermore, the individual pedestrian perceived LOS categories were compared with their predicted counterparts.Statistical performance tests were performed,and the results were compared using statistical software Origin Pro 9.1. The mean absolute percentage error (MAPE), root mean square error (RMSE), and rate of success prediction were compared between the observed values and predicted values and the results were 12.57%, 1.463%, and 56%,respectively. The performance results of the proposed threshold for PLOS category imply more precise and reliable solutions.
5.5 Sensitivity analysis
A sensitivity analysis is a technique used to determine how different values of independent variables impact a particular dependent variable under a given set of assumptions.It is used to test the presence of uncertainty and model simplification. In the sensitivity analysis, a special type of bar chart, such as tornado diagram, is used to analyze the impact of variables and the chart is categorized vertically and ordered. In this study, a sensitivity analysis was performed between PLOS model dependent variable and independent variables. From the tornado diagram, the importance of each variable was examined and the impacts of independent variables were ranked with respect to the dependent variable. The data were taken from Santacruz Junction,and values were considered as baseline values for sensitivity analysis. Independent variables such as traffic volume along with pedestrian crossing, pedestrian delay,probability of pedestrian interaction with vehicle, and median width were changed by ± 5%, 10%, 15%, and 20%, and the effect of these changes on the dependent variable (PLOS score) are given in Table 9. Tornado diagram is plotted for understanding the positive and negative changes of 20% from base values in independent variables and the result is shown in Fig. 5.
Figure 5 shows that if traffic volume (X1) is reduced by 20%, then there is a huge reduction in PLOS score; and if increased by 20%, a more increase in PLOS score is witnessed. Likewise, other variables such as pedestrian delay(X2) and the probability of pedestrian interaction with vehicle in crosswalk (X3) have the same effect on PLOS score.The median width(X4)has reversed effect on PLOS score but the effect is comparatively lesser. From the results variables are prioritized and the ranks between the variables are rated as follows:
Severity rank 1:Variable X3-probability of pedestrian
vehicle interaction.
Severity rank 2: Variable X2-pedestrian delay.
Severity rank 3: Variable X1-traffic volume.
Severity rank 4: Variable X4-median width.
Finally, PLOS can be improved by changing the most significant variables at Santacruz Junction. From the ranking results, it is observed that variable X3has more impact than other variables on PLOS score. Therefore, the first remedial measure to improve the PLOS is to reducethe impact of variable X3. Likewise, all variables can be improved as per the ranking order.

Table 9 Sensitivity analysis of PLOS variables
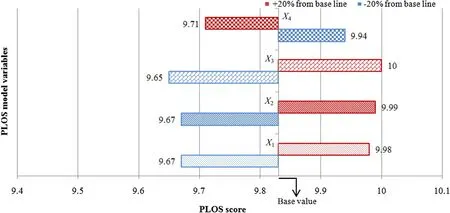
Fig. 5 Tornado diagram for sensitivity analysis of PLOS model variables
6 Conclusion
This study has identified several factors which significantly affect pedestrians’ perception of safety, convenience, and efficiency while crossing signalized intersections. To provide a safe environment for pedestrians, proper methodologies that support transport planners and decision makers to find and evaluate the elements to improve walking are needed.In India,most signalized intersections are operated by sharing the pedestrian signal phase, which allows pedestrian crossing and parallel through and turning vehicle movement simultaneously. Earlier studies showed that more than 60% of pedestrians do not comply with signal phase due to impatience and experience interaction with vehicles in crosswalk.The existing condition of pedestrian facilities has been measured using LOS categories. This study has identified that pedestrian delay, traffic volume,probability of pedestrian interaction with vehicle, and median width significantly affect PLOS while pedestrians are crossing signalized intersections under mixed traffic conditions.The developed PLOS model accurately predicts pedestrians’ perceptions of crossing at signalized intersections. The field data consist of qualitative data (pedestrian perception score with respect to safety, convenience,and efficiency) and quantitative data (pedestrian, traffic,and geometric characteristics) for the selected signalized intersections. To overcome the limitations of the CLR techniques, the FLR technique is used to develop a PLOS model that fits in mixed traffic conditions and is found able to predict accurate PLOS score. In this study, we defined threshold values for six levels of PLOS ratings using fuzzy data mining techniques.
The study shows that the pedestrian delay has a greater effect on PLOS than other variables and an increase in pedestrian delay led to a decrease in pedestrian perceived efficiency and convenience. It is recommended to reduce the pedestrian delay by shortening cycle length and to increase pedestrian flow by providing more pedestrian green phase for improving PLOS at signalized intersections. Prohibiting free left turning and pedestrian noncompliance behavior,and providing exclusive free left turn lane can reduce interaction between pedestrians and vehicles in crosswalk. Meanwhile providing signal control scheme to separate pedestrians from vehicles, proper crosswalk markings, and placing adequate space between crosswalk and vehicle stop line can also be considered to increase pedestrian perceived safety and convenience.Besides, providing adequate median width for accommodating pedestrians while waiting to cross the crosswalk can improve pedestrian convenience level and increase PLOS at signalized intersections.
Most of the existing Indian studies and Indo-HCM have developed qualitative or quantitative measurement-based PLOS models and a combined qualitative and quantitative PLOS model for Indian traffic conditions is still missing in existing works. The proposed PLOS model has been developed by considering the pedestrian behavioral characteristics, influencing variables in mixed traffic conditions,and combination of qualitative and quantitative data.Therefore, the accuracy of the proposed PLOS model is better than the existing PLOS models. In this study, the FLR technique has been used for the first time to develop the PLOS model. This method is effective in dealing with qualitative input data and has provided more accurate results when compared with CLR techniques. Apart from this, we have also used a novel approach of combining qualitative and quantitative data in the model development,which can provide new directions for planners and designers to improve existing conditions of intersections.Furthermore, the fuzzy clustering technique has been applied for the first time to identify the threshold values of PLOS classification at signalized intersections under Indian conditions. The developed model and proposed threshold values are useful to transport designers for understanding about the convenience of a specific intersection and its ability to accommodate pedestrian movement.It also helps in assessing and prioritizing the requirements of pedestrians at existing intersections.
Nevertheless, the developed model still has a few limitations to be addressed in the future. (1) In this study,triangular membership was utilized to develop the PLOS model. Other membership shapes have not been attempted and can be tried to identify the variation in FLR model and model consistency. (2) The developed model is specific in nature and works well for high flow conditions but requires additional calibrations for locations with lesser flow conditions. (3) Euclidian distance method was used for identifying the distance between the variables while performing FCM clustering. Application of other methods such as the nearest neighbor or single linkage can be considered for future scope of this study.(4)For field application purpose,we have simplified the developed model by establishing various relationships to estimate the independent variables of the PLOS model, for example, establishing the relation between suitable gap and the probability of pedestrianvehicle interaction. In addition, the comparisons of pedestrian perceptions related to complaints and noncompliants can be added into the future research.
Open AccessThis article is distributed under the terms of the Creative Commons Attribution 4.0 International License (http://creativecommons.org/licenses/by/4.0/), which permits unrestricted use,distribution,and reproduction in any medium,provided you give appropriate credit to the original author(s) and the source, provide a link to the Creative Commons license, and indicate if changes were made.
 Railway Engineering Science2019年4期
- Railway Engineering Science的其它文章
- An application of Bayesian multilevel model to evaluate variations in stochastic and dynamic transition of traffic conditions
- Data analytics approach for travel time reliability pattern analysis and prediction
- Influence of adverse weather on drivers'perceived risk during car following based on driving simulations
- Calibrating HCM model for roundabout entry capacity under heterogeneous traffic
- Traffic prediction using a self-adjusted evolutionary neural network
- Case study scenarios in site selection of hazardous material facilities based on transportation preferences
