A wheat chromosome 5AL region confers seedling resistance to both tan spot and Septoria nodorum blotch in two mapping populations
Wenjing Hu, Xinyao He,Susanne Dreisigacker,Carolina P.Sansaloni,Philomin Juliana, Pawan K. Singh,*
aKey Laboratory of Wheat Biology and Genetic Improvement for Low&Middle Yangtze Valley,Ministry of Agriculture,Lixiahe Region Institute of Agricultural Sciences of Jiangsu Province,Yangzhou 225007,Jiangsu,China
bInternational Maize and Wheat Improvement Center(CIMMYT), Apdo.Postal 6-64a,06600 Mexico D.F., Mexico
Keywords:Parastagonospora nodorum Pyrenophora tritici-repentis QTL mapping Resistance breeding Triticum aestivum
ABSTRACT Tan spot (TS) and Septoria nodorum blotch (SNB), caused by Pyrenophora tritici-repentis and Parastagonospora nodorum, respectively, are important fungal leaf-spotting diseases of wheat that cause significant losses in grain yield. In this study, two recombinant inbred line populations, ‘Bartai' × ‘Ciano T79' (referred to as B × C) and ‘Cascabel' × ‘Ciano T79'(C × C)were tested for TS and SNB response in order to determine the genetic basis of seedling resistance. Genotyping was performed with the DArTseq genotypingby-sequencing (GBS) platform. A chromosome region on 5AL conferred resistance to TS and SNB in both populations,but the effects were larger in B × C(R2 = 11.2%-16.8%)than in C × C(R2 = 2.5%-9.7%).Additionally,the chromosome region on 5BL(presumably Tsn1)was significant for both TS and SNB in B × C but not in C × C.Quantitative trait loci(QTL)with minor effects were identified on chromosomes 1B,2A,2B,3A,3B,4D,5A,5B,5D,6B,and 6D. The two CIMMYT breeding lines ‘Bartai' and ‘Cascabel' contributed resistance alleles at both 5AL and 5BL QTL mentioned above. The QTL on 5AL showed linkage with the Vrn-A1 locus, whereas the vrn-A1 allele conferring lateness was associated with resistance to TS and SNB.
1. Introduction
Tan spot(TS) caused by Pyrenophora tritici-repentis [anamorph:Drechslera tritici-repentis(Died.)Shoem.]and Septoria nodorum blotch (SNB) caused by Phaeosphaeria nodorum [anamorph:Parastagonospora nodorum (Berk.) Castellani & Germano][1,2]are leaf spotting diseases of common(Triticum aestivum L.)and durum (T. turgidum L. var. durum) wheat. Both diseases are important and can be devastating in many wheat producing regions worldwide[3-7].
A number of practices have been used to manage these diseases, including rotations with non-host crops and destruction or avoidance of infested straw, stubble, and volunteer plants by either burning or burying[8].Fungicides are also effective, but their use is not cost effective when grain prices are low. In parallel with resistance genes, fungicides exert high selection pressure on pathogen populations, and their excessive or continual use leads to the possibility of fungal resistance/tolerance. Resistant varieties combined with appropriate cultural practices are considered to be the most cost-effective and environmentally benign way to manage these diseases[9].
Both qualitative and quantitative resistance have been reported for TS and SNB [10]. P. tritici-repentis is known to produce at least three host-specific toxins that interact with corresponding specific host sensitivity genes to cause necrosis and/or extensive chlorosis associated with susceptibility[4].Ptr ToxA causes necrosis and its corresponding sensitivity gene Tsn1 is located on chromosome 5BL[11].Ptr ToxB and Ptr ToxC cause chlorosis, and their sensitivity genes are Tsc2 on chromosome arm 2BS[12]and Tsc1 on chromosome arm 1AS[13],respectively.Quantitative trait loci(QTL)for TS resistance have been mapped on several wheat chromosomes [4].Shankar and co-authors reported that QTL on chromosomes 1A and 2A had major effects on TS resistance and behaved additively to tsn1 on 5BL[14].
Eight P. nodorum necrotrophic effectors (NEs) or toxins(SnToxA, SnTox1, SnTox2, SnTox3, SnTox4, SnTox5, SnTox6 and SnTox7) and their corresponding host sensitivity loci(Tsn1, Snn1, Snn2, Snn3-B1 and Snn3-D1, Snn4, Snn5, Snn6 and Snn7) have been described for the wheat-P. nodorum pathosystem [15-17], with the latter loci being located on chromosomes 5BL,1BS,2DS,5BS,5DS,1AS,4BL,6AL,and 2DL,respectively [16,18-24]. Additional resistance QTL have been identified on chromosomes 2A,2B, 5A,and 7A [15].
Both P. tritici-repentis and P. nodorum produce ToxA. The ToxA gene in the former was obtained from the latter via horizontal gene transfer [25]. Tsn1 has been cloned and Tsn1:ToxA is the best-studied interaction in both pathosystems[11].Normally Tsn1 leads to susceptibility to TS and SNB in the presence of races producing SnToxA,but is not active in some genetic backgrounds, suggesting that race-nonspecific resistance QTL act upstream of the ToxA-Tsn1 interaction,diminishing the effects of Tsn1 [26]. This hypothesis was verified by Kariyawasam et al. [27], who identified a major QTL on 3BL that had an inhibitory epistatic effect on the Ptr ToxA-Tsn1 interaction.
The objectives of the present study were to 1) map QTL underlying TS and SNB resistance at the seedling stage in two bi-parental populations, and 2) evaluate the effects of a 5AL chromosome region on the response to both diseases, given its linkage with the Vrn-A1 locus.
2. Materials and methods
2.1. Plant materials
Two recombinant inbred line (RIL) populations were used in the present study;the female parents were CIMMYT breeding lines Bartai (pedigree BABAX/LR42//BABAX/3/ERA F2000) and Cascabel (SOKOLL//W15.92/WBLL1), and the shared male parent was Ciano T79 (BUCKY/(SIB)MAYA-74/4/BLUEBIRD//HD-832.5.5/OLESEN/3/CIANO-67/PENJAMO-62). All three parents had a spring growth habit. The ‘Bartai' × ‘Ciano T79'population (hereafter referred to as B × C) comprised 231 F2:7lines, and the ‘Cascabel' × ‘Ciano T79' population (C × C) had 226 F2:7lines. The two populations have been used for mapping spot blotch resistance QTL in our previous studies[28,29].
2.2. Disease screening
Mexican P. tritici-repentis (Ptr) isolate MexPtr1 and P. nodorum isolate MexSn4 were used to screen for TS and SNB,respectively. Both isolates are ToxA producers based on inoculation experiments using differential genotypes, infiltration experiments, and PCR with the ToxA genetic marker(data not shown). The isolates were grown on V8-PDA media[30], and conidiospore concentrations for inoculation were adjusted to 4 × 10³spores mL-1(MexPtr1) and 1 × 10⁷spores mL-1(MexSn4)[31,32].
Evaluations of TS and SNB response were conducted on seedlings in a greenhouse at 22 °C day and 18 °C night temperatures with a 16-h photoperiod. Experiments were arranged in a randomized complete block design with two replicates, with four plants per entry grown in plastic containers as experimental units to derive mean values for subsequent analysis. Two trials were carried out for each disease in autumn 2016. Cultivars Erik and Glenlea were included in each trial as resistant and susceptible controls,respectively. Inoculations were performed 14 days after planting when the second leaf was fully expanded. A hand sprayer was used to apply the inocula to seedlings until runoff(about 0.5 mL inoculum per plant).When the leaves were dry,the trays were moved to a humid chamber(RH 100%,20 °C)to facilitate infection. After 24 h, the plants were transferred back to the greenhouse bench. A linear scale of 1-5 was used to evaluate both diseases at seven days post-inoculation(dpi)[30,33,34].
2.3. Genotyping
The two populations were genotyped with the DArTseq genotyping-by-sequencing(GBS)platform at Genetic Analysis Service for Agriculture (SAGA) in Guadalajara, Mexico. This genotyping platform is based on a combination of complexity reduction methods developed for array-based DArT and sequencing of resulting representations on next-generation sequencing platforms [35]. Additionally, several KASP markers for genes such as Rht-B1, Rht-D1, Vrn-A1 (Table S1)were applied following Dreisigacker et al. [36]. STS marker fcp623 was used for genotyping the Tsn1 locus following the protocol in Faris et al. [11]. Markers with missing data points>20% and segregation ratios beyond the 0.5-2.0 range were excluded from further analysis. Redundant markers were deleted using the BIN functionality of the ICIMapping ver. 4.1 software[37].
2.4. Linkage and QTL analysis
The JoinMap v4.1 software [38]was applied to construct linkage groups (LGs) using the Haldane algorithm with LOD values from 3 to 20 for grouping and the Maximum Likelihood algorithm for ordering within each LG. Chromosome anchoring of LGs was done through blasting GBS marker sequences against the IWGSC Chinese Spring reference genome (v1.0).MapQTL v6.0 software[39]was used for QTL mapping.Interval mapping (IM) was first performed to detect potential QTL for each trait, and then multiple QTL mapping (MQM) for each QTL was executed with the closest linked markers as cofactors. QTL were taken as significant and reported if they exceeded a LOD threshold of 3 in at least one experiment or a threshold of 2 in both experiments. The software MapChart ver. 2.3 [40]was used to draw genetic and physical maps in this study.
2.5. Statistical analysis
Analysis of variance (ANOVA) was performed with the AOV functionality in ICIMapping ver.4.1 software[37].Broad-sense heritability estimates were calculated for ANOVA results using the formula h2=), whereis the genetic variance,is the genotype-by-experiment interaction,is the error variance, y is the number of experiments,and r is the number of replicates.
2.6. Gene survey in the 5AL QTL region
The JBrowse tool in T3/Wheat (https://triticeaetoolbox.org/wheat/) was used to retrieve information of high confidence genes from the 5AL QTL region, and the corresponding annotation information was obtained from the URGI website(https://urgi.versailles.inra.fr/download/iwgsc/IWGSC_RefSeq_Annotations/v1.0/). Physical positions of markers in IWGSC RefSeq v1.0 were obtained from either T3/Wheat or URGI via BLAST searches.
3. Results
3.1. Phenotypic analysis
Based on ANOVA (Table 1), both diseases showed significant effects of genotype and genotype by environment interaction in the two populations (P <0.001). Broad and continuous variation was observed for both diseases in the two populations (Fig. 1). Although all parental lines showed relatively high resistance, significant variation within the populations was observed, implying different resistance alleles in the parents. Both populations exhibited more resistance to SNB than to TS,and SNB showed higher heritability estimates than TS(Table 1).
3.2. Genotyping and linkage analysis
Around 18,000 GBS markers were scored for each population.Additionally, 11 KASP markers were assayed in the B × C population and 13 in the C × C population(Table S1).Tsn1 was polymorphic in the B × C population but monomorphic in the C × C population. After filtering, 1475 and 1798 nonredundant, high quality markers were selected for the B × C and the C × C population, respectively. Using the markers, 35 and 43 linkage groups were generated for the B × C and theC × C population, respectively, representing all 21 wheat chromosomes. The linkage map of B × C covered 4094 cM,with an average marker density of 2.8 cM/marker, whereas the linkage map of C × C covered 5231 cM, with a marker density of 2.9 cM/marker (Table S2).
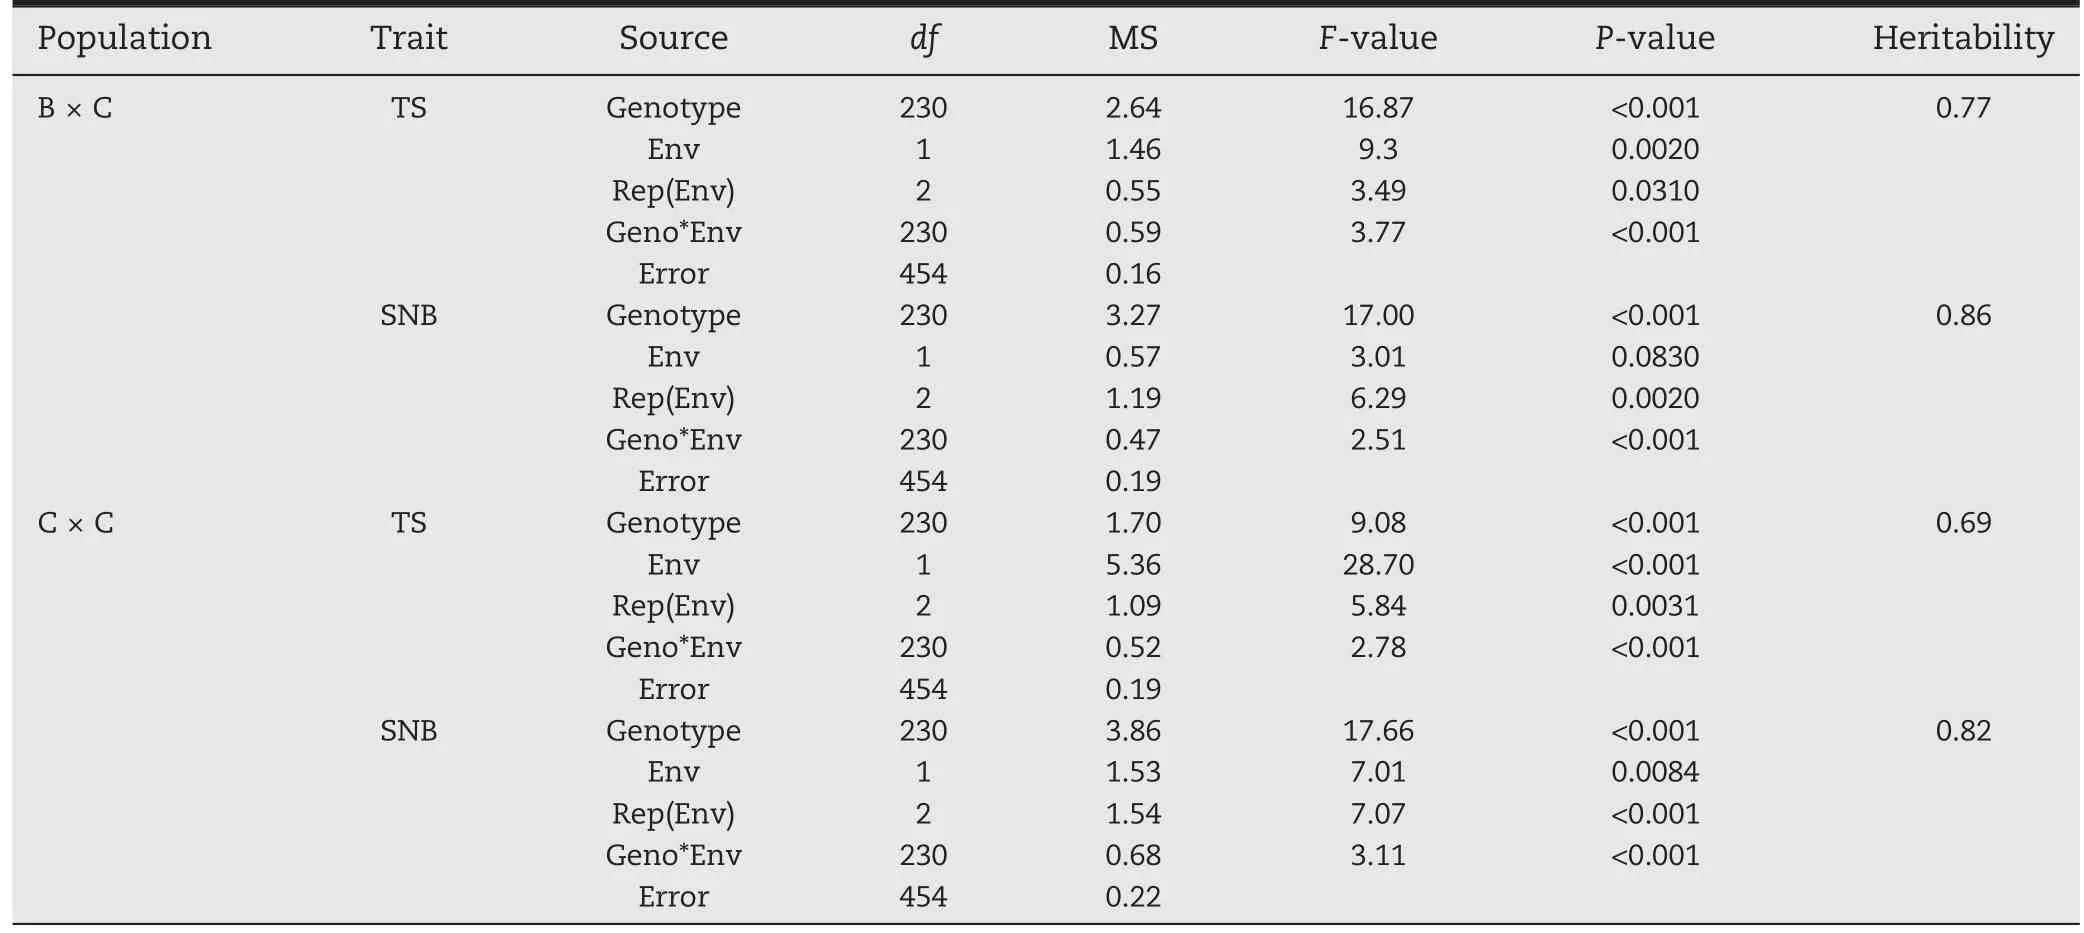
Table 1-Analysis of variance for greenhouse experiments of tan spot (TS) and Septoria nodorum blotch (SNB), and their heritability estimates in the‘Bartai' × ‘Ciano T79'(B × C)and ‘Cascabel' × ‘Ciano T79'(C × C)populations.

Fig.1-Histograms for tan spot(a and c)and Septoria nodorum blotch(b and d)scores in the‘Bartai' × ‘Ciano T79'population(a and b)and the‘Cascabel' × ‘Ciano T79'population(c and d).Disease scores for the resistant check Erick and susceptible check Glenlea are presented,as well as those for the parents,where B stands for‘Bartai',CA for ‘Cascabel',and C for‘Ciano T79'.
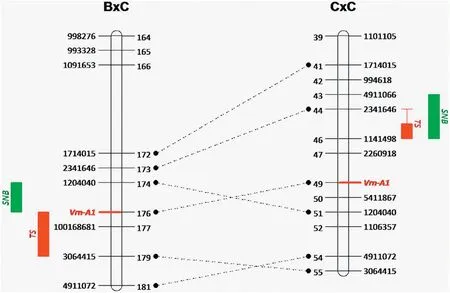
Fig.2- Alignment of the 5AL QTL regions in the ‘Bartai' × ‘Ciano T79'(B × C)and the‘Cascabel' × ‘Ciano T79'(C × C)populations.QTL regions for tan spot(TS)and Septoria nodorum blotch(SNB)and GBS markers are indicated on the outer sides of the linkage groups,whereas marker positions are indicated on the inner sides.Shared markers between the two populations are connected with dotted lines.Linkage groups are only partially presented to show the QTL regions.
3.3. QTL mapping
3.3.1. The B × C population
Two major QTL for TS resistance were detected in the B × C population; one was located on chromosome 5AL in the Vrn-A1 region(Fig.2)and the other on 5BL linking to Tsn1(Fig.S1),accounting on average for 14.2% and 20.3% of phenotypic variation,respectively(Table 2).Resistance alleles at both loci were contributed by the resistant parent Bartai. Additionally,QTL with minor effects were found on chromosomes 3B, 4D and 5B,with resistance alleles from Ciano T79.
Regarding SNB resistance, the 5AL QTL remained significant, with an average phenotypic variation explained of 16.8%; but the 5BL QTL was less significant, showing an average value of 4.2%.Additional minor QTL were detected on 2B and 4D, with the resistance source being Ciano T79 (Table 2, Fig.S1).
The 5AL and 5BL QTL act in an additive mode for both diseases (Fig. 3), and the same mode of action was found when all QTL were considered(Fig.S2).
3.3.2. The C × C population
Unlike B × C, where major QTL with phenotypic effects >10%were detected, all identified QTL showed minor effects in C × C.A QTL on 5AL was found to be effective against both TS and SNB(Table 3 and Fig.2).Other minor QTL detected in this population included those on 3A,5A,5B and 5D for TS,and 1B,2A,2B,6B and 6D for SNB(Table 3,Fig.S3),none of which was shared between the two diseases nor between the two populations. QTL identified in this population were also in additive in effect(Fig. S2).
The chromosomal region on 5AL harboring Vrn-A1 was associated with resistance to both diseases in both populations. In B × C, the QTL range for TS and SNB overlapped at Vrn-A1, whereas in C × C, the QTL range for TS was located within that for SNB (Fig. 2). When the projected positions of the markers in the IWGSC Chinese Spring reference genome(v1.0)were used,the QTL for TS and SNB overlapped in B × C,in similar manner to those in C × C,and there was a distance of 2.2 Mb between the two QTL(Fig.4).
3.4. Gene analysis in the 5AL QTL region
The 5AL QTL region was defined based on QTL information from the current and a few previous studies,as shown in Fig.4.Physical positions of GBS markers 2341646 and 1204040 that encompassed the core QTL region were used to delimit a region for a survey of annotated genes. The region extending from 582.6 to 589.3 Mb on chromosome 5AL had 88 high confidence genes,including Vrn-A1(Table S4).NBS-LRR genes that are typically associated with disease resistance were not found in the region; however, several genes or gene families that have been reported to be associated with disease resistance were found,including an ABC transporter,Dirigent protein, Receptor-like kinase, Beta-glucosidase, Chaperone DnaJ-domain containing protein, Cysteine protease, F-box family protein, Glucan endo-1,3-beta-glucosidase, Glycosyltransferase, and Pentatricopeptide repeat-containing protein(Table S4), serving as potential candidate genes for this QTL.
4. Discussion
In the present study, the 5AL region was significant in both populations for both diseases. Previous studies also reported several QTL on 5AL, mostly for TS. QTs.fcu-5AL was reported by Chu et al. [41]on chromosome 5A between markers barc1061 and cfa2185, explaining up to 18% of variation in seedling experiments.Later,QTs.fcu-5A.1 between barc360 and gwm6 [42]and QYls.lrc-5A closely linked to gdm132 [43]were identified for TS resistance.Recently,QTs.zhl-5A was mapped between markers iwa7025 and iwa5173, accounting for phenotypic variation from 6%to 14%depending on the Ptr isolates assayed [27]. Position comparison of the above-mentioned QTL and those in the current study clearly indicated that the current QTL overlapped with those in Chu et al. [41]andKariyawasam et al.[27](Fig.4).The 5AL QTL regions in Chu et al.[42]and Zwart et al.[43]were extended far from the regions shown in Fig.4 and thus were not drawn;however,their peak regions fall into the same region, as shown in Fig. 4 based on shared markers [42,43]. The Ptr races for which the 5AL QTL showed significant effects were races 1, 2 and 5 in Chu et al.[41], races 1 and 2 in Chu et al. [42], races 1, 2, 3 and 5 in Kariyawasam et al. [27], and race 1 in the current study. It might be concluded that this chromosome region confers a broad spectrum of resistance against Ptr isolates, or that the underlying gene is involved in a yet unknown host-toxin interaction.

Table 2-QTL for tan spot(TS) and Septoria nodorum blotch(SNB)resistance in the‘Bartai'× ‘Ciano T79'population.
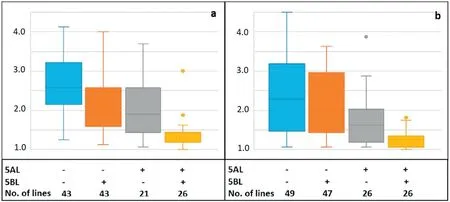
Fig.3-Phenotypic effects of different combinations of the 5AL and 5BL QTL for TS(a)and SNB(b)in the‘Bartai' × ‘Ciano T79'population.‘+'and‘-' denote the resistant and susceptible alleles,respectively.
As for SNB,QSnb.fcu-5AL was mapped between barc151 and fcp13, with phenotypic effects of 11% for seedling resistance and 9 to 18% for adult plant resistance [44]. Of its flanking markers,only barc151 was mapped in Fig.4 and thus the distal region could not be determined;it is likely that this QTL region overlapped with the 5AL QTL regions for TS. Additionally,QSnn.niab-5A.1 was found by Cockram et al.[2]and confirmed by Jighly et al. [45], however, its physical location was from 679.5 Mb to 702.5 Mb,beyond the QTL region discussed above.It should also be noted that it was identified in an infiltration experiment using SnTox1, providing further evidence that QSnb.fcu-5AL may be different from QSnn.niab-5A.1.
The 5AL region has been related to either TS or SNB in previous studies, whereas the current study demonstrated that QTL regions for TS and SNB overlapped in both populations.However,it is still inconclusive if the QTL regions in B × C and C × C represent the same underlying gene. Most likely they are different,due to their positions on the physical map, which are 2.2 Mb apart; but we cannot exclude the possibility that QTL were assigned to a wrong marker interval in one of the populations due to mapping errors, causing the same QTL to appear in different locations in the two populations. As for the possible underlying gene(s) for the QTL, NBS-LRR genes might not be involved considering the absence of such genes in the projected region of the QTL in the Chinese Spring reference genome, although we cannotexclude the possibility that Chinese Spring does not have the resistance gene(s)at all.NBS-LRR genes are generally regarded to be responsible for race-specific resistance against biotrophic diseases [46]; thus it is possible that no such gene was present in the QTL region, considering that TS and SNB are both necrotrophic diseases. Nevertheless, Tsn1, the first identified gene for susceptibility to both TS and SNB,contains an NBS-LRR domain[11],which must be ascribed to its ability to interact specifically with ToxA in both P.tritici-repentis and P.nodorum.In this regard,the underlying gene(s)for the 5AL QTL might not be an NBS-LRR type considering its ability to confer resistance to a wide range of P. tritic-repentis isolates that produce host-specific toxins,as discussed above.

Table 3-QTL for tan spot(TS)and Septoria nodorum blotch(SNB)resistance in the‘Cascabel'בCiano T79'population.
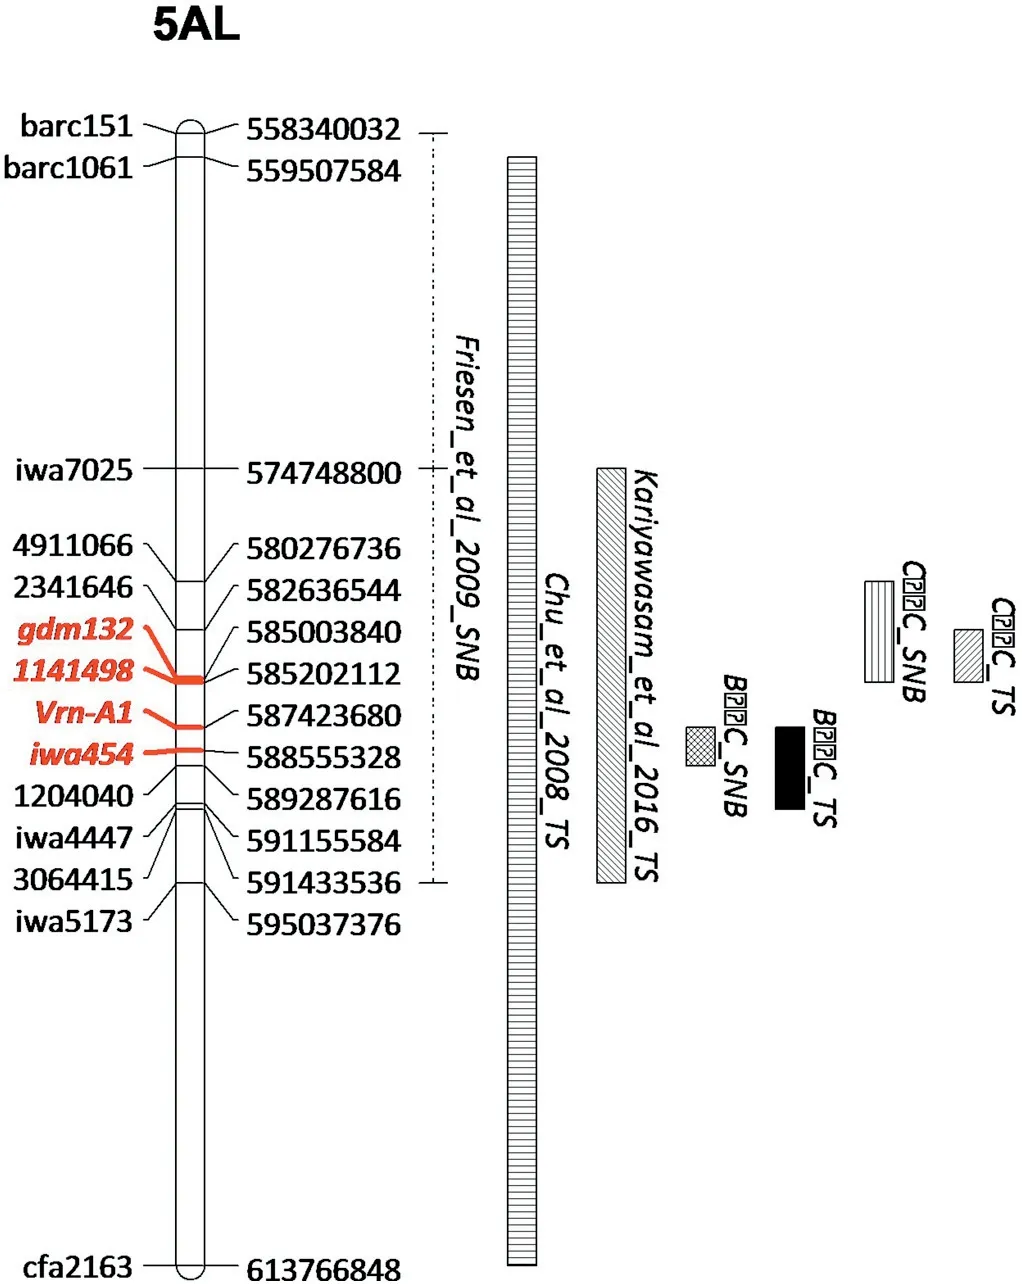
Fig.4-Physical locations of markers and QTL regions for tan spot(TS)and Septoria nodorum blotch(SNB)resistance that were reported in the current and previous studies.The physical locations on 5AL were from the IWGSC Chinese Spring RefSeq(v1.0)and shown on the right of the map.QTL confidence intervals were from the respective studies;but the distal region of the SNB QTL in Friesen et al.[44]was unknown,due to the failure in mapping the distal marker cfp13.Vrn-A1 and GBS marker 1141498 that fell in the peak regions for TS and SNB in the present study are in bold and highlighted in red,as well as gdm132 and iwa454 for TS QTL in Chu et al. [41],Zwart et al. [43]and Kariyawasam et al. [30].
Apart from Tsn1,only two genes have been cloned for leafspotting diseases in wheat, Snn1 for SNB [47]and Stb6 for Septoria tritici blotch (STB) [48], both encoding members of the wall-associated receptor-like kinase family.In this regard,a receptor-like kinase gene was found in the 5AL QTL region and could be a candidate gene. Among other possible candidate genes, ATP-binding cassette (ABC) transporter is famous due to its role in Lr34/Yr18/Sr57/Pm38/Sb1 conferring broad-spectrum resistance in wheat, via transporting or sequestering xenobiotic compounds [49]. In the 5AL QTL region, there are two genes for “ABC transporter B family protein” clustered together at 588.7 Mb, being 1.3 Mb away from Vrn-A1. Dirigent proteins are involved in lignan and lignin biosynthesis as well as in resistance to abiotic and biotic stresses [50], and here we found three dirigent protein genes clustered at 583.6 Mb on 5AL.Interestingly,Juliana et al.[51]also found a TS resistance QTL associated with a dirigent protein, but that one was located on 2AL. Additionally, there are other disease resistance-related genes in the 5AL region,like glucan endo-1,3-beta-glucosidase, glycosyltransferase, F-box family protein, pentatricopeptide repeat-containing protein, cysteine protease and chaperone DnaJ-domain containing protein that are highlighted in Table S4. Nevertheless,further research is needed in order to narrow down the QTL region and number of candidate genes.
Another new finding of the current study was the localization of vernalization gene Vrn-A1 in this region. It is possible that the gene is associated with disease resistance in the field because Vrn-A1 could contribute to disease escape by its effect on flowering date,as has been reported in Fusarium head blight[52],spot blotch[28]and STB[53].The association of Vrn-A1 with seedling resistance to TS and SNB may imply its linkage with unknown resistance gene(s), although the possibility that Vrn-A1 has pleiotropic effects on disease resistance cannot be ruled out. Limited by the resolution of an ordinary QTL mapping study like the current one, it is difficult to determine the relative positions of the QTL for TS and SNB, and Vrn-A1, for which a fine mapping study on the chromosomal region will be needed.
The two mapping populations used in the current study have also been characterized for resistance to SB,in which the resistance allele of the 5AL QTL was associated with the vrn-A1 allele that confers lateness[28,29].The same applied to the resistance to TS and SNB in the present study, as well as resistance to FHB and STB as mentioned above, partly explaining why CIMMYT materials generally show resistance to those diseases,at least in Mexican environments,since the vrn-A1 allele is fixed in almost all CIMMYT spring wheat materials [36]. This implies that the utilization of the vrn-A1 allele in breeding might be beneficial in terms of mitigating multiple fungal diseases,as long as the breeding lines are not too late, and this can be achieved by selecting early vrn-A1 lines since there are other genes contributing to earliness.
Tsn1 has long been recognized as a major factor in experiments where ToxA-Tsn1 interaction happens [11]. In the B × C population, the underlying gene for the 5BL QTL must be Tsn1, considering that both MexPtr1 and MexSn4 produce ToxA,although Tsn1 was not mapped under the peak of the QTL (Fig. S1), which must be ascribed to errors in genotyping of the marker fcp623 that made Tsn1 appear a bit away from its real position. In the C × C population, both parents had the Tsn1 allele for susceptibility, thus explaining why the 5BL QTL was not detected.
It is noteworthy that unknown host-toxin interaction or unidentified QTL might exist in the two populations analyzed in the current study. It was unexpected that Ciano T79, the Tsn1 carrier, showed moderately resistant reactions to both diseases in both populations. Lines with Tsn1 usually exhibit susceptible reactions when ToxA-producing isolates are inoculated, but some loci may have epistatic effects on Tsn1,at least in the TS system known so far,minimizing the effects of the ToxA-Tsn1 interaction, for example the 3BL QTL reported by Kariyawasam et al. [27]. Another possibility could be that the isolates used in this study secrete unknown toxins that interact with QTL that were not identified in this study. Further research is required to clarify the confounding issues.
Declaration of Competing Interest
None.
Acknowledgments
This work was supported by the Bill and Melinda Gates Foundation and the United States Agency for International Development (USAID) through the Cereal Systems Initiative for South Asia (CSISA), Durable Rust Resistance in Wheat(DRRW)/Delivering Genetic Gains in Wheat (DGGW) and the CGIAR Research Program for Wheat (CRP WHEAT) project.Technical support from Nerida Lozano was highly appreciated. The first author is grateful for the financial support of The National Key Research and Development Program of China on Molecular Design Breeding in Wheat(2016YFD0101802).
Supplementary data
Supplementary data for this article can be found online at https://doi.org/10.1016/j.cj.2019.05.004.
- The Crop Journal的其它文章
- Positional cloning of PmCH1357 reveals the origin and allelic variation of the Pm2 gene for powdery mildew resistance in wheat
- The Crop Journal 作物学报(英文版) (Started in 2013, Bimonthly)
- Wheat powdery mildew resistance gene Pm64 derived from wild emmer(Triticum turgidum var.dicoccoides) is tightly linked in repulsion with stripe rust resistance gene Yr5
- Wheat breeding in northern China: Achievements and technical advances
- Breed ing w heat for resistance to Fusarium head blight in the Global North: China,USA,and Canad a
- Pyramiding disease resistance genes in elite winter wheat germplasm for Western Canada

