基于“策略—反馈”的琶洲中东区韧性城市设计
陈碧琳 孙一民 李颖龙
1 研究背景
国内外已有大量文献辨析韧性城市的概念[1],阐述工程韧性、生态韧性到社会—生态韧性的理念演变[2]。目前学界仍在进一步探讨城市韧性的分层研究、规划策略和评价体系。
在城市韧性分析方法方面,梅尔等[3]将城市系统的演变分解为基于空间要素流动的“多层模型”,研究世界三角洲城市系统的韧性演进规律。第一层为自然基底层,由土壤、水系、生态绿地等子系统组成;第二层为城市网络基础层,由交通系统、水利市政等子系统组成;第三层为城市占用层,由土地利用、产业发展等子系统组成。戴伟等[4]在此基础上指出外部不确定扰动与内部蓝绿基底和城市系统的矛盾引发了三角洲空间规划的焦点问题。
涉及与韧性相关的“脆弱性”概念时,当前对脆弱性与韧性的关系存在2种意见:1)若脆弱性的定义与对抗灾害扰动的能力有关,则脆弱性和韧性是一组存在负相关关系的概念;2)若脆弱性接近风险的定义,则脆弱性与韧性相关程度较低[5]。笔者倾向于第一种意见并在韧性评价中引入脆弱性分析。
自然基底层与城市网络基础层、城市占用层的对立,造就珠三角特有的脆弱性(图1)。其中,自然脆弱性(海平面上升、降雨量峰值提高、土地沉降等)受到气候变化的影响,人为脆弱性则体现为城市扩张带来的环境污染、硬质表面增多和蓝绿系统碎化[6]。
在韧性策略方面,研究主要集中于城市与社区层面。社区作为城市子系统,是韧性表达与落实的载体,各子系统韧性相互作用,造就了城市整体韧性[7]。申佳可等[8]基于此解读了韧性社区规划设计的3个维度,即环境支撑、空间多样和以人为本。而针对三角洲这一特定区域,戴伟等提出了基于系统韧性的三角洲空间规划方法,即目标确定、系统解译、系统预测、系统规划与系统反馈。
在韧性评价体系方面,城市尺度上,基于韧性城市指标体系[9],Hernantes等[10]建立了一套成熟的城市韧性评价体系,涉及韧性构建的领导力和参与者、城市基础设施与自然资源、多方合作等层面。社区尺度上,彭翀等[11]综述了一系列社区韧性评估体系,这些体系通常采用分类的方法,对韧性进行赋值和换算的定量评估。
2 韧性城市框架的提出
过去的韧性城市研究提供系统韧性的研究方法,分析城市系统的韧性演进规律,从城市、社区以及三角洲区域等尺度上提出韧性规划设计框架和评价体系。然而,目前缺乏在珠三角城市组团层面(城市组团既包含多个城市社区,又参与构成城市整体)、针对城市基础设施与环境的韧性城市设计机制研究,包括如何通过韧性策略解决珠三角脆弱性的问题,如何通过设计实践在城市组团层面提升城市整体韧性,如何通过定量方法对韧性策略和设计实践进行反馈评价。因此,在已有研究的基础上,笔者立足于珠三角城市组团尺度,通过案例分析,试图建立一套全过程的韧性城市设计体系。
作为城市组团,广州琶洲中东区具有珠三角的脆弱性特征,是珠三角韧性演进落实的载体,因此笔者以其为研究对象,建立微观尺度上的“分析—策略—方案—反馈”韧性城市设计机制,对韧性城市系统的整体性、连结性、多样性、冗余性和灵活性[12]等属性进行评价。1)聚焦城市自然基底层和网络基础层,针对城市基础设施与环境,通过灾害模拟指出低洼的地形、洪涝灾害的干扰与破碎的城市空间共同导致了琶洲中东区的脆弱性;2)提出琶洲中东区3个层次的韧性设计策略,包括结构性策略、连接方式和节点处理;3)对应上述策略阐述琶洲中东区城市设计方案,包括通过强化蓝绿系统和绿色基础设施来整合城市各个功能区,增强滨水区的步行可达性,塑造分散式雨水存储系统和多用堤岸模式;4)利用GIS、Fragstats和Depthmap等软件,分别对琶洲中东区场地现状、原控规和方案设计3个样本进行景观连接度、空间集成度和雨水存储量的数据对比分析,以此评估该韧性策略是否为琶洲中东区提供环境支撑,塑造多样化、以人为本的城市空间。从微观层面试图构建“分析—策略—方案—反馈”的韧性城市设计框架(图2),以点带面,为珠三角城市的韧性研究和设计实践提供参考。
3 适应气候变化的琶洲中东区脆弱性分析及韧性城市设计策略
SCUT-UC Berkeley工作坊首先通过洪涝灾害情景模拟,探讨琶洲中东区的脆弱性问题,针对这些问题提出3个层次设计策略:1)结构性策略:连接现有破碎的蓝绿系统;2)连接方式:构建基于公共交通为导向(TODs)、垂直水岸的滨水步行可达空间;3)节点处理:分散式雨水存储系统与多用堤岸模式。
3.1 琶洲岛脆弱性分析
琶洲岛的脆弱性体现在2方面:1)低洼地形(图3)和海平面上升引起的应对洪涝灾害的脆弱性;2)破碎化的城市空间导致其应对气候干扰的能力随城市的扩张而变弱。
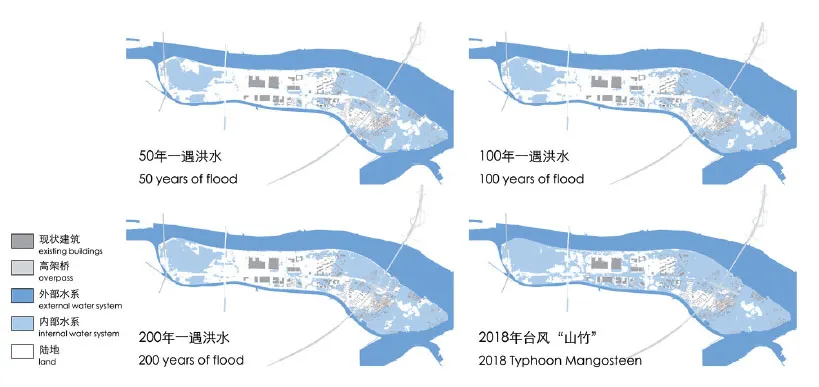
琶洲岛四面环水,珠江多年平均最高潮位为8.227 m(广州高程,珠基高程3.227 m),高于现状堤顶高程,由于过度依赖堤坝、水闸等刚性手段,面对洪涝灾害的适应能力较弱。脆弱性分析运用情景模拟的手法建立琶洲岛不同程度雨洪灾害的预测模型(图4),通过模拟发现台风“山竹”的最高潮位(珠基高程3.227 m)高于200年一遇洪水位(珠基高程2.680 m)①,从侧面说明刚性工程标准不能很好地适应洪涝灾害的干扰。
此外,琶洲岛保留了不同时期的村落和工业区,其逐渐衰落的基础设施不能有效应对气候干扰。场地被多条快速过境交通切割,不同城市空间相互孤立,滨水空间被阻隔,公共交通无法有效覆盖场地,导致交通和步行可达性较差。
3.2 琶洲中东区韧性城市设计整合策略
3.2.1 结构性策略:连接现有破碎的蓝绿系统
城市空间的破碎化体现在:1)分割与不连续的空间形态;2)兼容性差的空间功能;3)阻隔性大的空间联系[13]。基于社会—生态韧性理论,通过建立绿色基础设施[14],为城市提供可浸区,以下渗、调蓄、滞流、蒸腾、蒸发等方式控制城市雨水径流;同时通过引入休闲娱乐、观赏学习的设施塑造多用空间,加强人与自然的结合。因此,琶洲中东区城市设计采取连接城市蓝绿系统的措施,整合生态环境景观与高密度城市建成区,通过韧性设计提升城市系统的整体性和稳固性、多样性和灵活性、冗余性和连接性来整合空间形态、丰富空间功能、加强空间联系。

1 珠三角城市脆弱性背景分析Background analysis of vulnerabilities of PRD cities

2 “分析—策略—方案—反馈”的韧性城市设计框架Resilient urban design mechanism of “analysis - strategy - scheme - feedback”
结合琶洲岛地形和水系绿地,方案设计连接破碎的蓝绿系统,以此为结构骨架设置可浸区和防涝片(图5),缝合水系统和绿地系统,串联新旧建成区。将抬高的堤围和处于低地的村落进行统一设计,结合原有河涌和农田,建设城市湿地公园,既可调蓄雨水,又可供休憩观赏。
3.2.2 连接方式:构建基于TODs、垂直水岸的步行可达空间
由于紧凑高效的土地利用可支持气候适应性的韧性城市发展[15],因此规划设计须考虑在集中建设区与生态底线区之间以弹性发展区作为缓冲[16],划定建设区边界,保持城市建成区和生态保护区的动态平衡。另外,城市密度与公共交通依赖性密切相关[17],因此韧性设计须通过提升公共交通组织的冗余度来适度提高城市密度。
鉴于此,针对琶洲中东区重点地段城市空间孤立隔离的问题,方案设计采用基于TODs、垂直水岸的步行可达空间联系的手法。以公共交通为导向,按500 m步行半径合理调整地铁站点,在站点周边进行紧凑混合的城市开发,采取“小街区、密路网”的组织形式,建立多层次的步行连接体系,增强城市与滨水空间的步行可达性。依据村落和工业区的肌理,方案搭建顺应水岸形态的路网结构,增强城市与水的相互渗透。
3.2.3 节点处理:分散式雨水存储系统与多用堤岸模式
与现有的集中式防洪排涝工程设施相比,城市分散式雨水管理景观基础设施采取分散滞流的管理模式,均衡分布于城市内部,就近收集雨水,提高雨洪管理能力[18]。
因此,琶洲中东区重要城市节点设计采取更具韧性思维的分散式雨水存储和多用堤岸模式。设计探讨3种雨洪管理策略(表1),并采取更为灵活的分散式雨水存储系统,分别通过道路、河道和绿地来存储雨水(图6),增强城市韧性。同时方案改进了刚性的传统堤坝模式,将堤岸和保留的工业区、村落结合起来,按空间尺度塑造多用、活跃的堤岸空间。
4 琶洲中东区韧性城市设计方案反馈评估
琶洲中东区韧性城市设计方案的评估对韧性评价体系的连接性、整体性、冗余性、多样性和灵活性等指标进行反馈评价,论证不同层次的韧性策略是否有效提升城市韧性。
其中,针对景观空间破碎化问题,吴昌广等开展了景观连接度研究[19],Guzy等通过Fragstats的平均欧氏最邻近距离(ENN_MN)和连接度(CONNECT)参数研究绿地配置对半水生龟物种丰富度的影响[20]。针对城市空间可达性问题,利用Depthmap软件将空间结构转译成轴线图进行可达性分析,在苏州、南京等国内城市得到应用[21]。
4.1 基于结构性策略的景观连接度分析
通过GIS(10.5)与Fragstats(4.2)软件平台,分别对场地、原控规和设计方案的地理数据以10 m网格进行栅格化处理(图7),笔者选取类型层次的景观指数如斑块类型面积(CA)、斑块数量(NP)、平均斑块面积分布(AREA_MN)、ENM_MN、斑块结合指数(COHESION)以及500 m步行范围内的连接度进行比较。基于上述景观指数的比较分析,衡量3个不同样本的景观结构特征,对上文提出的结构性策略做出反馈,以调试连接现有破碎蓝绿系统的手法是否有效增强城市蓝绿系统的景观连接性、缓解蓝绿空间碎片化的问题。
景观连接度包含结构与功能连接度,描述了景观要素在功能和生态上的有机联系。ENN_MN、COHESION和CONNECT这3个指标可用于衡量韧性城市强调的连接性、整体性和物种多样性。ENN_MN是指基于斑块边缘—边缘距离所得离斑块最近的同类型斑块的距离,用以量化斑块隔离度;COHESION是指斑块的整体性或凝聚度,在类型水平上可衡量相应斑块类型的物理连接度;CONNECT是对景观空间结构单元之间连续性的量度,反映了同类斑块在功能和生态上的有机联系[22]。通过景观指数的分析(表2)可知,相比现状和原控规方案,设计方案的水域和绿地类型的ENN_MN值减小,COHESION值和CONNECT值上升,表明在结构性策略引导下,蓝绿斑块的隔离度下降,而物理和功能上的连接性增强,对加强景观整体性和缓解生境破碎化具有积极意义。

表1 3种雨洪管理策略比较Tab. 1 Comparison of three stormwater management strategies
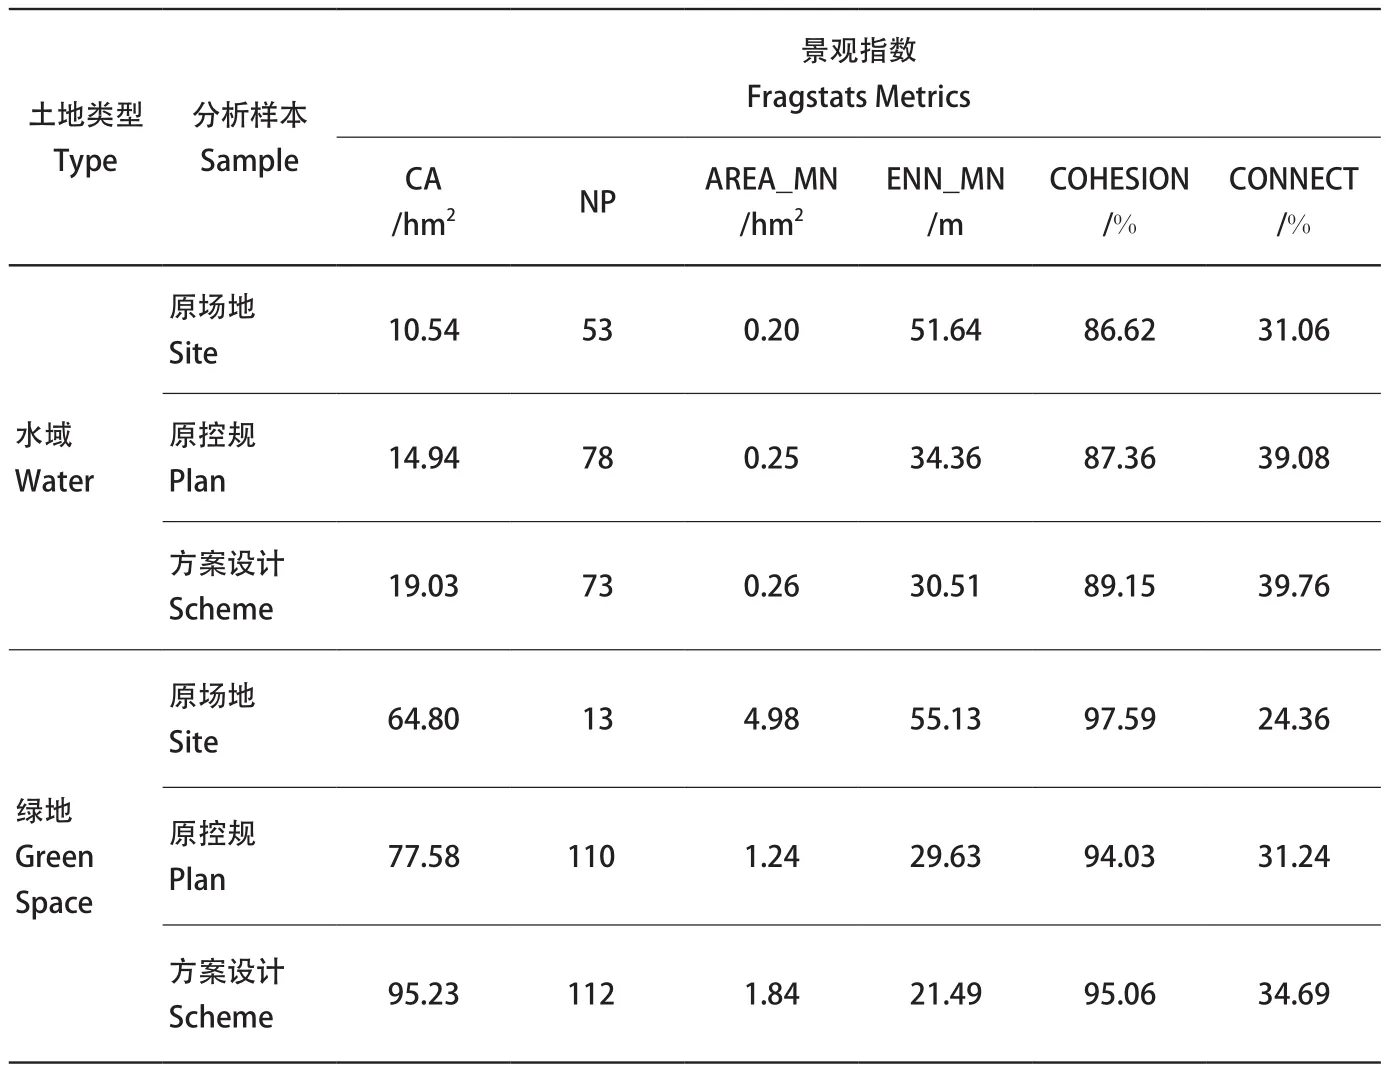
表2 基于类型层次上的水域与绿地景观指数分析Tab. 2 Analysis of Fragstats metrics of water and green space at type-hierarchy level

表3 路网密度对比Tab. 3 Comparison of road network density

表4 雨水存储能力部分指标比较Tab. 4 Comparison of some indicators of rainwater storage capacity
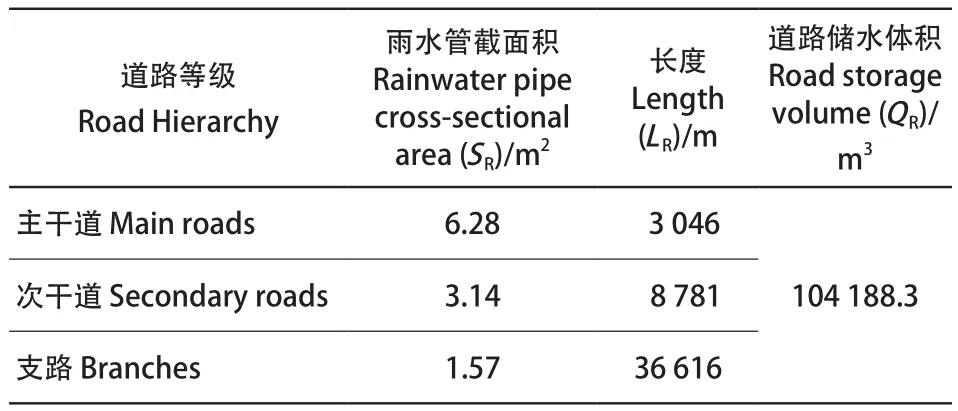
表5 方案设计道路储水计算Tab. 5 Calculation of road rainwater storage in design scheme
4.2 基于连接方式的空间集成度分析
利用Depthmap软件,分别对原场地、原控规和设计方案进行空间集成度分析,以衡量构建基于TODs、垂直水岸的步行可达空间设计是否提升了从城区到达滨水空间的便捷程度,实现韧性评价体系中的交通空间冗余性和城市功能多样性。
空间句法中,集成度反映系统中某一节点与其他节点联系的紧密程度,集成度的值越大,表示该节点在系统中便捷程度越高、公共性越强、可达性越好。集成度分为整体集成度和局部集成度,整体集成度表示节点与整个系统所有节点联系的紧密程度,局部集成度表示节点与附近几步内节点联系的紧密程度,常用3个拓扑单位计算。以整体集成度为X轴、局部集成度为Y轴,建立线性回归方程,R³即为可理解度。可理解度越高的空间,其局部中心性能越能融入全局空间结构之中,从而增强空间系统功能的多样性与复杂性[23]。

3 琶洲岛高程分析Elevation analysis of Pazhou Island
4 琶洲岛洪涝灾害模拟Flood disaster simulation of Pazhou Island
通过软件运算可得,相比原场地和原控规,方案设计的空间集成度更高(图8),尤其是琶洲中东区北侧和南侧的滨水可达性增强,路网密度的提升也加强了交通的冗余性(表3)。另外,通过线性回归方程的分析(图9),发现方案设计的可理解度(R³)最高,表明该样本的城市功能更多样化,有助于实现在可步行尺度内塑造功能混合区。
4.3 基于节点处理的雨水存储量对比分析
根据分散式雨水存储的3种方式(道路、河涌和绿地),研究采用如下公式计算原场地、原控规和方案设计的雨水存储总量(Q)的近似值:

式中LR为道路总长度,为道路雨水管截面积平均值,SW为水域总面积,为水域在各地形点可容纳水位上升的平均值,SG为绿地总面积,为绿地可下渗的雨水高度。
雨水的存储总量与LR、SW和SG存在正相关,笔者以此来比较3个分析样本的雨水能力(表4)。通过对比可发现,设计方案在3个指标上均优于原场地和原控规,储水能力高于二者。
已知SW为19.03 hm³,SG95.23 hm³。参照工程经验,取雨水管截面直径为1 m,支路、次干道与主干道分别敷设2、4、8根雨水管,则分别约为1.57、3.14、6.28m³,并依此计算QR(表5)。取河涌可容纳水位上升均值为0.1 m,可下渗雨水高度均值为0.2 m,则在方案设计中,琶洲中东区重点设计范围可储存雨水总量约为31.4万 m³。台风“山竹”广州平均降雨量为76.2 mm②,重点设计范围面积为354 hm2,则须容纳降雨量约27万 m³。因此,方案设计的雨水存储量高于“山竹”降雨量,增强了琶洲中东区应对洪涝灾害的韧性。
从上述3项对比评估分析中,上文提出的设计策略可得到如下反馈:1)连接和整合城市蓝绿系统,提高结构和功能上的景观连接度,为城市韧性提供了环境支撑;2)构建基于TODs、垂直水岸的步行可达空间,提升了空间集成度和步行可达性,塑造多样化、混合功能、以人为本的城市空间;3)分散式雨水存储系统能有效灵活地适应雨洪灾害的干扰。
5 总结
笔者以琶洲中东区为例,建立了一套“分析—策略—方案—反馈”韧性城市设计机制,通过重构城市与水系统的和谐共生,促进珠三角城市在气候灾害中持续不断地适应和学习,增强城市韧性。
1)笔者从韧性城市和韧性社区的概念内涵、珠三角城市与水的发展空间对立的背景研究出发,指出在微观层面上,韧性城市设计需要在自然基底层和城市网络基础层构建稳固、多样、冗余、整体、灵活、相互连接的环境和城市基础设施。
2)笔者以琶洲中东区为研究对象,分析其因自然与人为因素引起的脆弱性,即低洼地形与洪涝冲击的矛盾、城区与水的割裂。然后,对应琶洲中东区的脆弱性,提出3个层次的韧性城市设计整合策略:提出结构性策略,连接现有的蓝绿系统,整合城市各功能空间;关注城与水的连接方式,即构建基于TODs、垂直水岸的步行可达空间;对场地的节点处理,改进传统刚性的工程手段,采取更为灵活的分散式雨水存储系统。
3)基于原场地、原控规和韧性城市设计方案,笔者运用各类软件平台和数据对比分析,针对上述不同层次的韧性设计策略进行反馈评估。结果表明,相较易受洪涝冲击的场地现状,以及对韧性和人本社区考虑欠缺的原控规方案,韧性城市设计方案在微观层面上能更好地落实珠三角的城市韧性。
总体来说,这套基于“策略—反馈”的琶洲中东区韧性城市设计机制根据韧性理论提出设计策略,运用定量分析的反馈评估手段,为微观层面上珠三角城市组团的韧性构建提供了参考。不过,由于珠三角城市存在复杂多样的脆弱性,对应的韧性设计策略还需进行补充,而针对设计策略的定量反馈方法也有待实践检验和拓展补充。
注释:
① 水文数据来源:广州市水务局。
② 数据来源:广州市政府网站(http://www.gz.gov.cn/gzgov/s2342/201809/4e256dab22ce406ea3bd2b952720 eb64.shtml)。
图表来源:
图1~2、4~5、7~9为作者自绘;图3、6来自SCUT-UC Berkeley工作坊成果;表1~4为作者绘制;表5为作者根据SCUT-UC Berkeley工作坊成果绘制。
1 Research Background
A large number of literatures at home and abroad have analyzed the definitions of resilient city,explaining the evolution of urban resilience from engineering, ecological to social-ecological resilience.At present, the academia is still further exploring the layer approach, planning strategies and evaluation system of urban resilience.
Meyer et al. put forward a “framework model”with the “layer approach” by decomposing different subsystems, and applied it to study the resilience evolution of world delta cities. The first layer is the natural substratum, the second one refers to the infrastructure networks, and the third one involves urban and agricultural land-use patterns. Dai et al.,based on the model, further pointed out that it is the external uncertain disturbances and the contradiction between the internal blue-green substratum and urban system that trigger the major problem of spatial planning of delta regions.
The authors introduce vulnerability analysis into the resilience evaluation. The opposition of the layers of natural substratum, the infrastructure networks and land-use patterns has caused the unique Pearl River Delta vulnerabilities (Fig. 1). Among them, natural vulnerabilities are mainly affected by climate change,while human vulnerabilities are primarily caused by environmental pollution, increasing hard surface and fragmentation of blue-green system.
The resilience strategies researches have focused on 2 levels-city and community. As an urban subsystem, the community is the carrier of resilience expression and implementation. Shen et al. further interpreted 3 dimensions of resilient community planning and design, namely environmental support,spatial diversity and human-oriented concept.
As for resilience evaluation system, on macro-scale of a city, based on the city resilience framework, Hernantes et al. developed a proven evaluation system in the construction of resilience. On micro-scale of communities, Peng et al. reviewed a series of community resilience assessment systems, which generally adopted the method of classification to quantitatively evaluate resilience by assignment and conversion.
2 Proposal of Resilient Urban Design Mechanism
According to the background research,the previous studies on resilient city provided research methods of system resilience, analyzed the resilience evolution of urban systems, and proposed resilience planning framework of cities,communities and delta region. However, there lacks researches in Pearl River Delta on resilient urban design mechanism for urban infrastructure and environment in the micro-level urban groups, which include how to solve the vulnerability problems through resilience strategies, how to implement urban resilience through design practices of urban groups, and how to evaluate resilience strategies through quantitative methods. Therefore, based on the existing researches, the authors focus on the specific micro-scale city groups of Pearl River Delta, and try to establish a whole-process resilient urban design framework through case study.
As a micro-level city group, central and eastern Pazhou, which processes the typical vulnerability characteristics of Pearl River Delta,is the carrier to implement urban resilience. The authors take it as the showcase and propose a resilient urban design mechanism of “analysisstrategy-scheme-feedback” (Fig. 2) at the microlevel, and evaluate the attributes such as integrity,connectivity, diversity, redundancy and flexibility of the resilient urban system: focusing on the layers of natural substratum and the infrastructure networks, the vulnerabilities of central and eastern Pazhou are caused by low-lying terrain, interference of floods, and fragmented urban space through disaster simulation; 3 levels of resilient urban design strategies are proposed, including structural strategy,connecting methods and urban nodes design measures; the urban design scheme is demonstrated,with integrating urban spaces through strengthening the blue-green system, enhancing the accessibility of the waterfront area, and adopting distributed rainwater storage system; based on GIS, Fragstats and Depthmap software, the data of landscape connectivity, spatial integration and rainwater storage are analyzed for current site, original plan,and design scheme, to assess whether the resilience strategies provides environmental support for the climate change, and whether it will shape a diverse,human-oriented urban space.
3 Vulnerability Analysis and Resilient Urban Design Strategies of Central and Eastern Pazhou Adaptive to Climate Change
3.1 Vulnerability Analysis of Pazhou Island
Vulnerabilities of Pazhou Island are reflected in the following: the low-lying terrain (Fig. 3),causes the vulnerability of floods, the fragmented urban space makes this island an isolated area and difficult to respond to climatic disturbances.
Pazhou Island is surrounded by water, and the average highest tidal level of Pearl River is 8.227 m(Guangzhou elevation), which is higher than the current elevation of the embankment (8.05 m). The disaster scenario simulation is employed in vulnerability analysis to establish a predictive model for different degrees of floods in Pazhou Island (Fig. 4). Through simulation,it is found that the highest tidal level of Typhoon Mangosteen (3.227 m of Pearl base elevation) is higher than the 200-years flood level (2.680 m)①,causing backflow of Pearl River, which demonstrates that the rigid engineering means may not adapt well to the floods and waterlogging.
In addition, the declining infrastructure and poor pedestrian accessibility of villages and industrial districts in Pazhou can not effectively cope with climate interference.
3.2 Integral Resilient Urban Design Strategies of Central and Eastern Pazhou
3.2.1 Structural Strategy: Relinking the Existing Broken Blue-Green System
The fragmentation of urban space is embodied in 3 aspects: the spatial form of segmentation;the spatial function with poor compatibility; the spatial connection with strong barriers. Based on social-ecological resilience, green infrastructure can provide city with floodable areas by controlling urban stormwater runoff. Meanwhile, by introducing recreational facilities, green infrastructure strengthens the interaction between human and nature. By integrating ecological environment and high-dense urban built-up area, green infrastructure enhance the integrity and stability, diversity and flexibility,redundancy and connectivity to respectively integrate spatial form, enrich spatial function, and strengthen spatial connection.
According to the existing topography, water system and green space of Pazhou Island, the design scheme reconnects the blue-green system,and utilizes it as the structural framework to arrange the floodable areas and anti-waterlogging spaces (Fig. 5), to suture the blue-green system and to connect historic and new districts.
3.2.2 Connecting Strategy: Creating Walkable Urban Space Based on Transit-Oriented Development and Vertical Waterfront
Compact and efficient land use pattern could underpin climate resilient urban development.Therefore, planners are well-advised to consider the elastic development zone standing as a buffer between the centralized constructed areas and ecological protected districts, to maintain the dynamic balance between built-up area and the ecological region. Besides, because of the high relevance between urban density and public transport, the resilience design enhances the traffic redundancy to moderately increase urban density.
In view of the isolation of city space, the design creates walkable urban space based on transitoriented development and vertical waterfront. With metro stations adjusting in 500-meter walking radius,the design adopts the “small blocks and dense road network” pattern to establish a multi-level pedestrian connection system and enhance walkability between city and water.
3.2.3 Node Design Strategy: Distributed Rainwater Storage System and Multi-functional Embankments
Compared with the existing centralized flood control, decentralized rainwater management,adopts a distributed and stagnation mode, which is evenly distributed within the city to collect rainwater directly.

6 分散式雨水存储模式Distributed rainwater storage mode

7 3个分析样本栅格化图像Raster images of three analyzing samples
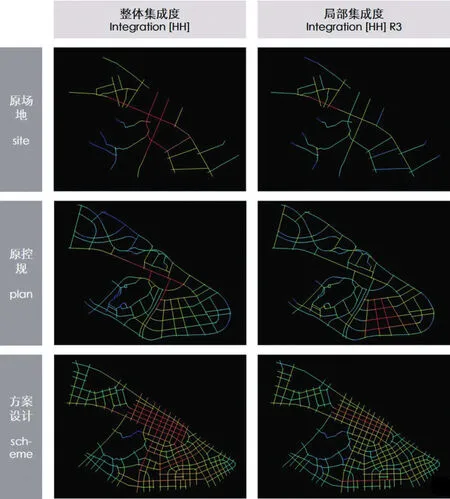
8 空间集成度分析Analysis of spatial integration
Therefore, node design of central and eastern Pazhou prefers the resilient distributed mode and multi-functional embankments. The scheme explores 3 stormwater management strategies(Tab. 1) and adopts a more flexible decentralized stormwater storage system through roads, rivers and green spaces (Fig. 6).
4 Feedback Assessment of Resilient Urban Design of Central and Eastern Pazhou
4.1 Analysis of Landscape Connectivity Based on Structural Strategy
Based on GIS and Fragstats, the geographic data of current site, original plan and design scheme are rasterized by 10 m grids (Fig. 7).The class-level metrics are selected, such as CA,NP, AREA_MN, ENN_MN, COHESION and CONNECT within a 500 m-walking range. Based on the comparative analysis of the above metrics,this research measures the landscape structural characteristics of 3 samples, and provides feedbacks on the above-proposed structural strategies to debug whether relinking the broken blue-green system enhance the landscape connectivity and mitigate the fragmentation problem.
Landscape connectivity includes structural and functional connectivity, describing the organic relationship between landscape elements in function and ecology. The three metrics,ENN_MN, COHESION and CONNECT, can be used to measure connectivity, integrity and species richness which resilient city emphasizes.Among them, ENN_MN is a measurement of patch isolation, by using Euclidean geometry as the mean shortest straight-line distance between the focal patch and its nearest neighbor of the same class; COHESION means the cohesion or integrality that is a measurement to quantify the physical connectivity; CONNECT is a measurement to quantify the continuity of the space structure units, which reflects the organic connection between the function and ecology of the patches. According to the data analysis of the fragstats metrics (Tab. 2), compared with the site and the plan, the ENN_MN value of water system and green land of design scheme is reduced, while the corresponding value of COHESION and CONNECT are increased, indicating that with the guidance of structural strategy, the isolation of blue and green patches is declining, while the physical and functional connectivity is enhanced.
4.2 Analysis of Spatial Integration Based on Connecting Strategy
Based on Depthmap software, the research respectively analyzes the spatial integration of current site, plan and design scheme, to measure whether the walkable spatial design based on transit-oriented development and vertical waterfront improve the convenience between city and water, and whether it can realize the traffic redundancy and the functional diversity.
The integration value reflects the closeness of connection between one node and others in a system. The greater value of the integration would make the convenience higher, the publicity stronger and the accessibility of the node in that system better. Spatial integration can be divided into integral and partial integration. The integral value indicates the closeness of the connection between a node and all nodes in the whole system,while the partial one value indicates the closeness of the connection between a node and the nodes in nearby topological steps. The linear regression equation is established with the integral integration asX-axis and the partial integration asY-axis,and the correlation coefficientR² is marked as intelligibility. The higher the intelligibility value is, the better the space can be integrated into the global spatial structure, thus strengthening diversity and complexity of spatial functions.

9 集成度散点图及线性回归方程Scatter plots and linear regression equation of spatial integration
It can be obtained through calculations that the integration value of scheme design is higher than that of site and plan (Fig. 8), and the upgrade in road network density also reinforces the traffic redundancy (Tab. 3). Besides, the intelligibility (R²)of the scheme is the highest (Fig. 9), illustrating that urban function of this sample is more diversified.
4.3 Comparative Analysis of Rainwater Storage Based on Node Design Strategy
According to 3 ways of distributed rainwater storage (roads, rivers and green land), the following formula is used to calculate the approximate value of the total rainwater storage (Q) of current site,original plan and design scheme (LR: total length of road network,: average value of the cross-sectional area of road rainwater pipes,SW: total area of the water,: average value of the water level that can be accommodated of the water points at various locations,SG: total area of green space,rainwater height that can be infiltrated into the green space).

As demonstrated in the above formula, there is a positive correlation between total rainwater storage andLR,SWandSG. The rainwater storage capacity of 3 samples is compared (Tab. 4) and it is found that design scheme is superior to current site and original plan in all the 3 indicators and the rainwater storage capacity is also better.
SWis known to be 19.03 hm² andSGis 95.23 hm².Referring to engineering experience, the diameter of the rainwater pipe is about 1m, and 2, 4 and 8 rainwater pipes are laid along main roads, secondary roads and branches, respectively (Tab. 5). And the values ofare 0.1 m and 0.2 m respectively, so in the design scheme, 314,000 m³ of rainwater can be stored in the key design scope. On the other hand, the average rainfall of Typhoon Mangosteen in Guangzhou is about 76.2 mm②with the key design scope of 354 hm², and central and eastern Pazhou thus needs to contain about 270,000 m³ rainfall, which means rainwater storage of design scheme is higher than the rainfall volume of Mangosteen.
From 3 comparative assessments, the design strategies proposed above can get the feedbacks as follows: connecting and integrating the urban bluegreen system can improve structural and functional landscape connectivity; creating walkable urban space based on transit-oriented development and vertical waterfront can upgrade the spatial integration and pedestrian accessibility; the distributed rainwater storage system can effectively and flexibly adapt to the interference of floods and waterlogging.
5 Summary
With central and eastern Pazhou as the research object, the authors analyze its vulnerability caused by the contradiction between low-lying terrain and floods and the separation of urban and waterfront. And then 3 levels of integral resilient urban design strategies are proposed: the structural strategy is put forward by relinking bluegreen system; the connecting mode of city and water is proposed by creating walkable urban space based on transit-oriented development and vertical waterfront; a more flexible node design is promoted by improving rigid engineering water conservancy and adopting a distributed rainwater storage system.
Various software and data comparison are utilized to evaluate different levels of resilience design strategies based on current site, original plan and resilient urban design scheme. The feedbacks illustrate that the design scheme can better implement urban resilience in Pearl River Delta at the micro-level, compared with current site which is vulnerable to floods and the original plan which lacks consideration of resilient and human-oriented community.
Generally speaking, this “strategy-feedback”resilient urban design mechanism of central and eastern Pazhou proposes design strategies based on resilience theory and utilizes the quantitative assessment method to provide a reference for constructing urban resilience at micro-level in Pearl River Delta city groups, however, due to complex vulnerabilities in Pearl River Delta, the resilience strategies need to be supplemented, and the corresponding quantitative feedback methods are yet to be tested and further expanded.
Notes:
① Source of the above hydrological data: Guangzhou Water Bureau.
② Source: Guangzhou Municipal Government Website(http://www.gz.gov.cn/gzgov/s2342/201809/4e256dab22ce 406ea3bd2b952720eb64.shtml).
Sources of Figures and Tables:
Fig. 1-2, 4-5, 7-9 are made by authors; Fig. 3, 6 are from design document of Workshop SCUT-UC Berkeley; Tab.1-4 are made by authors; Tab. 5 is made according to the research results of Workshop SCUT-UC Berkeley.

