Study on the relationship between the structure of bacterial flora on the tongue and types of tongue coating in patients with type 2 diabetes mellitus
*,Wei-Wei Chen,Xin-Fu Lin,Xiao Yang,Jie-Wei Luo2,*,Fang-Meng HuangYong-Xi Wu,Shi-Chao Wei
1Community Healthcare Services Center of Gudong Street,Fuzhou,China.2Provincial Clinical Medical College,Fujian Medical University,Fuzhou,China.3Department of Traditional Chinese Medicine,Fujian Provincial Hospital,Fuzhou,China.4Department of Paediatrics,Fujian Provincial Hospital,Fuzhou,China.5Teaching and Research Office of Medical Cosmetology,Department of Management,Fujian Health College,Fuzhou,China.
Abstract
Keywords:Type 2 diabetes mellitus,Oral flora,16S rDNAsequence,Yellow thick coating.
Background
In 2007,the American National Institutes of Health(NIH)established the Human Microbiome Project(HMP)to analyze the relationship between the human microbiome and human health and diseases[1,2].HMP focuses on the 5 major bacterial banks including the human intestinal tract,oral cavity,skin,nasal cavity,and urogenital tract.The National Institute of Dental and Craniofacial Research,which is a part of the NIH,launchedtheHumanOralMicrobiomeDatabase(HOMD)projectin2008[3].HOMD provides comprehensive information regarding 700 prokaryotic species in the human mouth.The sum of the genetic information carried by human microorganisms constitutes the “second human genome”[4].In August 2015,the“National Individual Microbiome Detection Project”waslaunched with theaim offinding biomarkers or risk factors for diseases in oral,skin,and intestinal microbial communities,which were determined as the main research targets.
Oral microflora is one of the most important microfloras affecting human health.An imbalanced oral microflora can not only induce a variety of oral diseases,but also lead to multiple system diseases,such as tumors,diabetes,cardiovascular diseases,and rheumatoid arthritis[5].Type 2 diabetes mellitus(T2DM)is called “Xiaoke”in traditional Chinese medicine.According to the record ofJin Kui Yao Lue,an ancient book of Chinese medicine published in the Han dynasty of China,the typical clinical symptoms of“Xiaoke”is thirsty for drinking water and dry mouth,revealing that the reason why"diabetes"is called as"Xiaoke”isthatthesymptomsofdiabetesare particularly prominent in body’s mouth and tongue.It suggested that as early as Han dynasty of China,Chinese medicine associated the onset of diabetes with the abnormal mouth and tongue symptoms.Currently,it is believed that a two-way interaction exists between diabetes and periodontitis.Susceptibility of patients with type 2 diabetes mellitus(T2DM)to periodontitis is higher than that of healthy individuals,and effective control of periodontitis has a considerable impact on blood glucose regulation.As an initiator of periodontitis,an imbalance oral microbial community may cause an increase in systemic inflammatory factors,such as the cytokines,tumor necrosis factor-alpha(TNF-α),interleukin(IL)-1β,and IL-6,and also increase oxidative stress levels in the body,thereby affecting insulin sensitivity and glucose metabolism.The expression of soluble glycosylated end product receptor increased in T2DM mice infected with porphyromonas gingival,a human periodontal pathogen[6].
Imbalance of oral flora can cause periodontal disease,which may act as an inducer of insulin resistance(IR)in a manner similar to obesity,with adverse effects on T2DM blood glucose control[7].In the current study,we collected tongue coating specimens from patients with T2DM and healthy individuals.Next-generation sequencing technology combined with syndrome differentiation of traditional Chinese medicine(TCM)was used to explore internal relationships between different tongue coating types and bacterial flora structure in tongue coating of patients with T2DM.
Here,the correlation between the structure of oral flora as well as the risk of T2DM and blood glucose control was assessed,in order to find new strategies for the prevention of T2DM by adjusting the imbalance in oral flora,or to locate oral biomarkers of T2DM.
Materials and methods
Diagnostic criteria
The diagnostic criteria for T2DM are stipulated in the“Diagnostic Criteria for Diabetes” issued by the American Diabetes Association(2014 Edition)[8].The classification of tongue coating is as follows:(1)white thin coating(WTC),the coating is white and thin,and the color of tongue can be faintly seen through the tongue coating.The coating is moist,contains saliva and the tongue color is light red.This condition can be described as,“light red tongue,thin white coating”;(2)yellow thick coating(YTC),the coating is light yellow or yellow in color,and the coating quality is relatively thick(the color of tongue can not be seen through the coating),part of the tongue surface is thickly coated,with only a small part of the tongue surface being thinly coated,the quality of coating is dry,and tongue color is light red or red;and(3)mirror-like coating(MLC),wherein most of the tongue coating is stripped and the tongue surface is as smooth as a mirror.The tongue conditions were diagnosed using the diagnosis criteria set byChinese Medicine(2nd edition)[9](Figure1).Each tongue image was determined by two deputy directors of the TCM department of Fujian Provincial Hospital.There was unanimous agreement with regard to the proposed tongue coating classification.
Inclusion and exclusion criteria
Inclusion criteria:patients in T2DM group who met the diagnostic criteria for T2DM and the classification criteria for tongue coating.The tongue coating of the control group has a thin white coating.All patients signed the informed consent form.The study was approved by the medical ethics committee of the Fujian Provincial Hospital(K2014-005-01),Fujian,China.
Exclusion criteria:patients treated with antibiotics within a prior 3-month period; patients with hematological disease,heart failure and kidney failure;patients with infectious diseases such as hepatitis and tuberculosis and those unable to communicate normally or cooperate;patients with oraland maxillofacial tumors,a history of radiotherapy or chemotherapy,or a long-term history of drinking or smoking.
General information
A total of 42 patients with T2DM,who met the inclusion criteria and had visited to Fujian Provincial Hospital,from December 2016 to March 2017 were recruited.These included 22 males and 20 females,the average age was 63.48±11.96 years.9 cases were identified MLC(5 males and 4 females),6 cases of WTC(3 males and 3 females),and 27 cases of YTC(14 males and 13 females).During the same period,28 healthy individuals from the physical examination center of the Fujian Provincial Hospital were recruited as the control group.The average age of control group,which included 15 males and 13 females,was 64.13±5.23 years,and all 28 exhibited WTC.Age and gender differences between groups were not significant.The median of glycosylated hemoglobin(HbAlc)in the T2DM group was 10.00(8.80,11.30),while that of the control group was 5.00(4.80,5.40).The difference between the 2 groups was significant(Z=-8.299,P<0.001).Median of maximum blood glucose within 5 days in the T2DM group was 15.14(10.32,18.30)mmol/L,while the median of maximum blood glucose within 5 days in the control group was 5.00(4.60,5.60).There were significant differences between the two groups(Z=-8.260,P<0.001).
Methods
Preparation of tongue coating samples and DNA extraction
Samples of tongue coating were acquired according to the procedure described in the HMP manual(Manual of Procedures for Human Microbiome Project,Version 12.0 Accession:phd003190.2).Subjects were not allowed to drink alcohol and gargle with medicine for 1 day before the test,and fasted for 8 hours before the test.Brushing and eating were not allowed in the early morning on the day of the test.A special swab was used to extract the sample,and the swab was required to be in full contact with the tongue coating for a contact time of not less than 20 seconds.Samples of tongue coating were stored in a-80℃refrigerator within half an hour after sampling and sent to the laboratory for DNA extraction within 4 hours.DNA extraction was performed in strict accordance with operating instructions of the QIAamp®DNA Mini Kit.Extracted DNA samples were subjected to PCR amplification using 16s rRNA universalprimer 515F/806R (515F:XXXXXGTGCCAGCMGCCGCGGTAA,806R:XXXXXGGACTACVVGGGTATCTAATC),synthesized by Thermo Fisher Scientific using the reaction system of IonAmpliseq™Sample ID panel.
V4 region of 16S rRNAgene analysis
The target region of the 16S rRNA gene was amplified by PCR,and the linker was ligated to the amplification product and purified.The unamplified library was purified using Agencourt® AMPure® XP Reagent 1.5x sample volume,and then the library was amplified to further purify the amplified library,and Qubit quantified and library quality inspection was performed in a 10 μL amplified Ion AmpliSeqTMlibrary.The library construction process was performed in accordance with the Ion AmpliSeqTMLibrary Kit 2.0(thermo fisher)operating manual.

Figure1 Classification of tongue coating
All sequences were searched for chimeric structures via vsearch analysis software on Linux ubuntu system platform.Next,operational taxonomic unit(OTU)clustering was carried out at 0.97 similarity.Operational taxonomic units(OTUs)were screened after clustering and those with only more than two OTUs were retained.A species richness table was obtained by annotating OTU representative sequences with an abundance greater than 2 with a rdp-classifier.
Library quantification was performed using the Ion Plus Fragment Library Kit and mixed proportional homogenization was performed according to data volume requirements of each sample.A specific variable region,V4,was amplified with a 16S specific primer,and an amplified fragment of about 300 bp was obtained.Ion PGMTMSystem was used for sequencing,and the 28 samples from the control group used two Ion 314TMChip Kit v2 chips,and the remaining samples used an Ion 318TMChip Kit v2 chip.
OTU clustering
Clean Reads with identical sequences were sorted according to their abundance.Singletons(only one sequence corresponding to read)were filtered out.Then all sequences were searched for chimeras via vsearch analysis.Subsequently,sequences were clustered into OTUs according to 0.97 similarity.The clustered OTUs were screened,and only those with more than 2 OTUs(similar to the singletons screening mentioned above)were retained.A species richness table was obtained by annotating the OTU representative sequences with an abundance greater than 2 with rdp-classifier.The abundance of each OTU in each sample was estimated,and the sequence with the highest abundance in each OTU was selected as the representative sequence of that OTU.Each representative sequence was compared with the 16S DNA of known species,using the Ribosomal Database Project,to classify each OTU species.
Significant difference analysis
Measurement data which conformed to the normal distributionwereexpressedasmean±standard deviation.For measurement data that did not conform to the normal distribution,the median quartile spacing was used:median(25%,75%)and the Wilcoxon rank sum test was used to detect species with significant differences in abundance among different groups;the Wilcoxon rank sum testwas used to group significantly different species obtained in the previous step.Linear discriminant analysis(LDA)was used to evaluate the influence of species with significant differences in data reduction and peacekeeping,where a LDA score>3 and aP<0.01 were the criteria for determining different flora.The tree plot was constructed using R statistical software(R Version 3.1.3).Redundancy analysis(RDA)was mainly used to reflect the relationship between the flora and environmental factors.
Results
OTU and species annotation analysis
Preliminary calculation of OTUs abundance illustrated the species richness of the samples.Cutadapt was used to splitthe python script,and the numberof sequencing samples was counted.The Chi-square test was used to analyze the reads between the two groups.The median reads of the T2DM group was 22558.50(13518.25,323383.25),which was higher than the median of the control group 16753.00(13326.25,24492.25)(Zvalue=-2.253,P=0.024).There were 8131 different OTUs in this experiment,of which 719 OTUs showed significant differences between the two groups in the level ofP<0.05.The OTUs were compared with the 16S rDNA database of known species for annotation of parallel species.The species showed differences included 16 at the phylum level,31 at the class level,54 at the order level,88 at the family level,and 161 at the genus level.
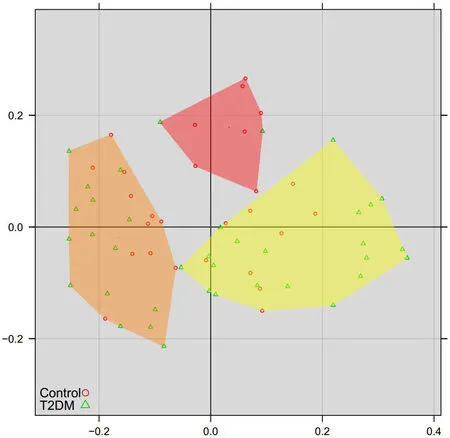
Figure2 Principal coordinates analysis of inter-sample species diversity at the genus level
Principal coordinate analysis(PCoA)analysis
To further demonstrate differences in species diversity between samples,we used PCoA method to demonstrate difference between samples.Results of the PCoA of species diversity between samples at the genus level is shown(Figure2).The PcoA method reduces the dimensions into 3 principal components:group 1,group 2 and group 3.These three groups show aclearseparation trend,with group 1 samples concentrated in the left region,group 2 samples concentrated in the upper region and group 3 samples concentrated in the right region,showing the statistically significant difference(P<0.05).Thus,it was concluded that the diversity of tongue-coating microorganisms was highly correlated with group 1,group 2,and group 3.
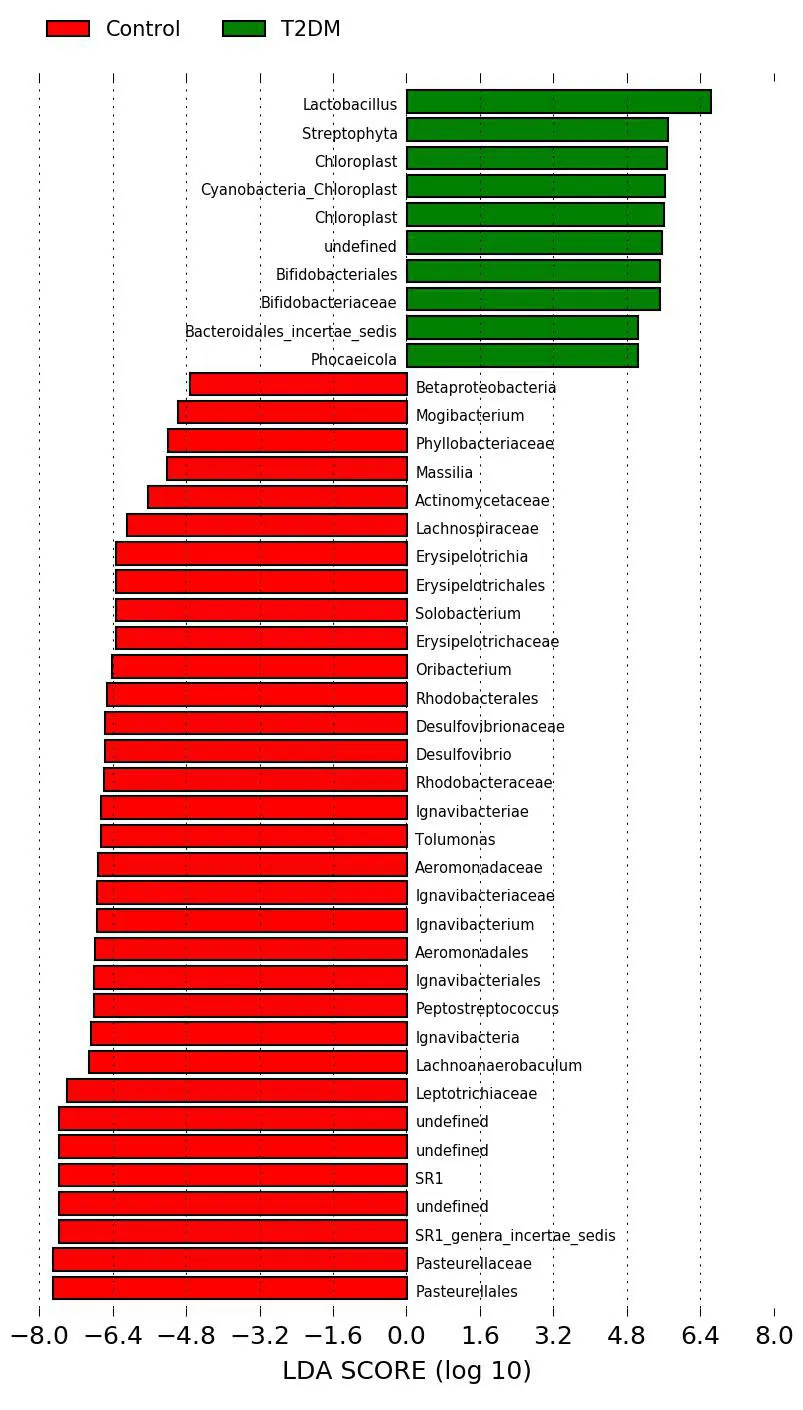
Figure3 LDA value histogram of type 2 diabetes mellitus group and the control group
LDA effect size
LDA was used to estimate the influence of abundance of each component species on the difference effect,and to determine the community or species that had a significanteffecton sample division [10].The Wilcoxon rank sum test was used to detect species showing a significant difference in abundance between two groups.Then,Wilcoxon rank sum test was used to analyze the difference between groups of significantly different species obtained in the previous step.Finally,LDA was used to evaluate the influence of species with significant differences in data reduction and peacekeeping,where a LDA score>3 and aP<0.01,was the criterion for determining different flora.The histogram of LDA value distribution in the T2DM group and the control group is shown(Figure3).The evolutionary branching diagram of LDA effect size is shown(Figure4).As is evident from the analysis,the dominant bacterial genera of T2DM includesLactobacillus,Streptophyta,Chloroplast,Cyanobacteria-Chloroplast,andBifidobacteriaceaeamong others.The dominant bacterial genera in the control group belongs toPasteurellales,Pasteurellaceae,Leptotrichiaceae,Lachnoanaerobaculum,andIgnavibacteriaamong other bacteria.
Analysis on the types of oral flora
Using the red line in Figure5 as the threshold,all 70 samples are clustered into 3 categories.The last 3 categories include 64 samples,and the dominant characteristics of each category are defined as a group.Structural characteristics of these three groups are shown(Figure6).Each group has dominant bacteria,and the order of dominance in group 1 bacteria arePrevotella>Neisseria>Veillonella>Streptococcus>Fusobacterium>Leptotrichiaand so on.The order of dominant bacteria of group 2 areNeisseria>Prevotella>Fusobacterium>Streptococcus>porphyromonasetc.The dominant bacteria of group 3 arePrevotella>Fusobacterium>Streptococcus>Neisseria>Leptotrichia>Rothia>Veillonella>porphyromonas>f_Pasteurellaceae>Capnocytophaga>Actinomyces>Alloprevotella,etc.,in that order.
The microflora structure and distribution of T2DM and different tongue coating subgroups,and the risk prediction of microflora groups
In Table1,the bacterial distribution of the T2DM and control groups was tested using the Fisher’s Exact Test(χ2=5.916,P=0.044),which indicated that there were significant differences in the microflora structure of three “group”types between the T2DM and control groups.The proportion of“group 1”microflora in the control group(25.9%)is significantly higher than that in the T2DM group(5.4%).“group 2”and “group 3”in the T2DM group represent an increased risk(OR value)relative to “group 1”,which is used as the reference(Table1).This suggested that T2DM tongue coating might have a specific microflora structure.
According to the requirement of Fisher’s Exact Test,some data were combined to explore the relationship between “group 3”microflora structure and patients with YTC.The distribution of different bacterial types in the tongue coating groups of the YTC(T2DM patients with YTC)and the non-YTC(containing healthy individuals as well as T2DM patients with WTC and MLC)is performed(χ2=7.934,P=0.02),indicating that there are significant differences in the microflora structure of three “group”types between the YTC and the non-YTC groups.Further,compared with group 1 and group 2,group 3 has a significantly dominant microflora structure(χ2=7.120,P=0.008)accounting for 65.4%,indicating a close relationship between “group 3”microflora structure and patients with YTC(Table2).This suggested that different types of tongue coating have different composition of flora,which may be involved in the formation and change of tongue coating.
Associationbetweenmicroorganism groupand HbA1c in T2DM group
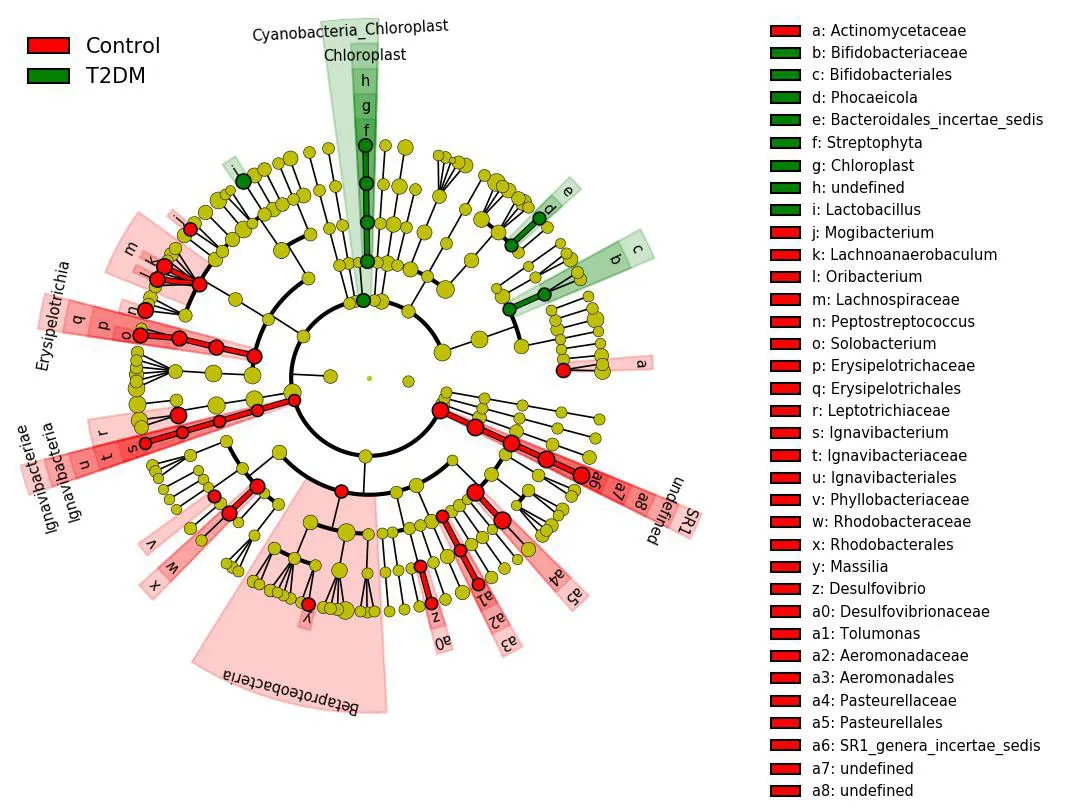
Figure4 Evolutionary bifurcation diagram of LDA effect size
R software was used to calculate and compare the HbA1c of each microorganism"group".No significant difference is observed,suggesting that the HbA1c in the samplesstudied isnotassociated with the microflora structure of these three tongue coating groups(Figure7).
The red nodes in the branches depict dominant bacteria in the control group,the green nodes depict dominant bacteria in the T2DM group,and the yellow nodes depict non-dominant bacteria in two groups.T2DM:Type 2 diabetes mellitus group;LDA,Linear discriminant analysis.

Figure5 Treeplot at the level
The red line is the threshold value,all 70 samples are clustered together in three categories,and the last three types of bacteria include 64 samples.
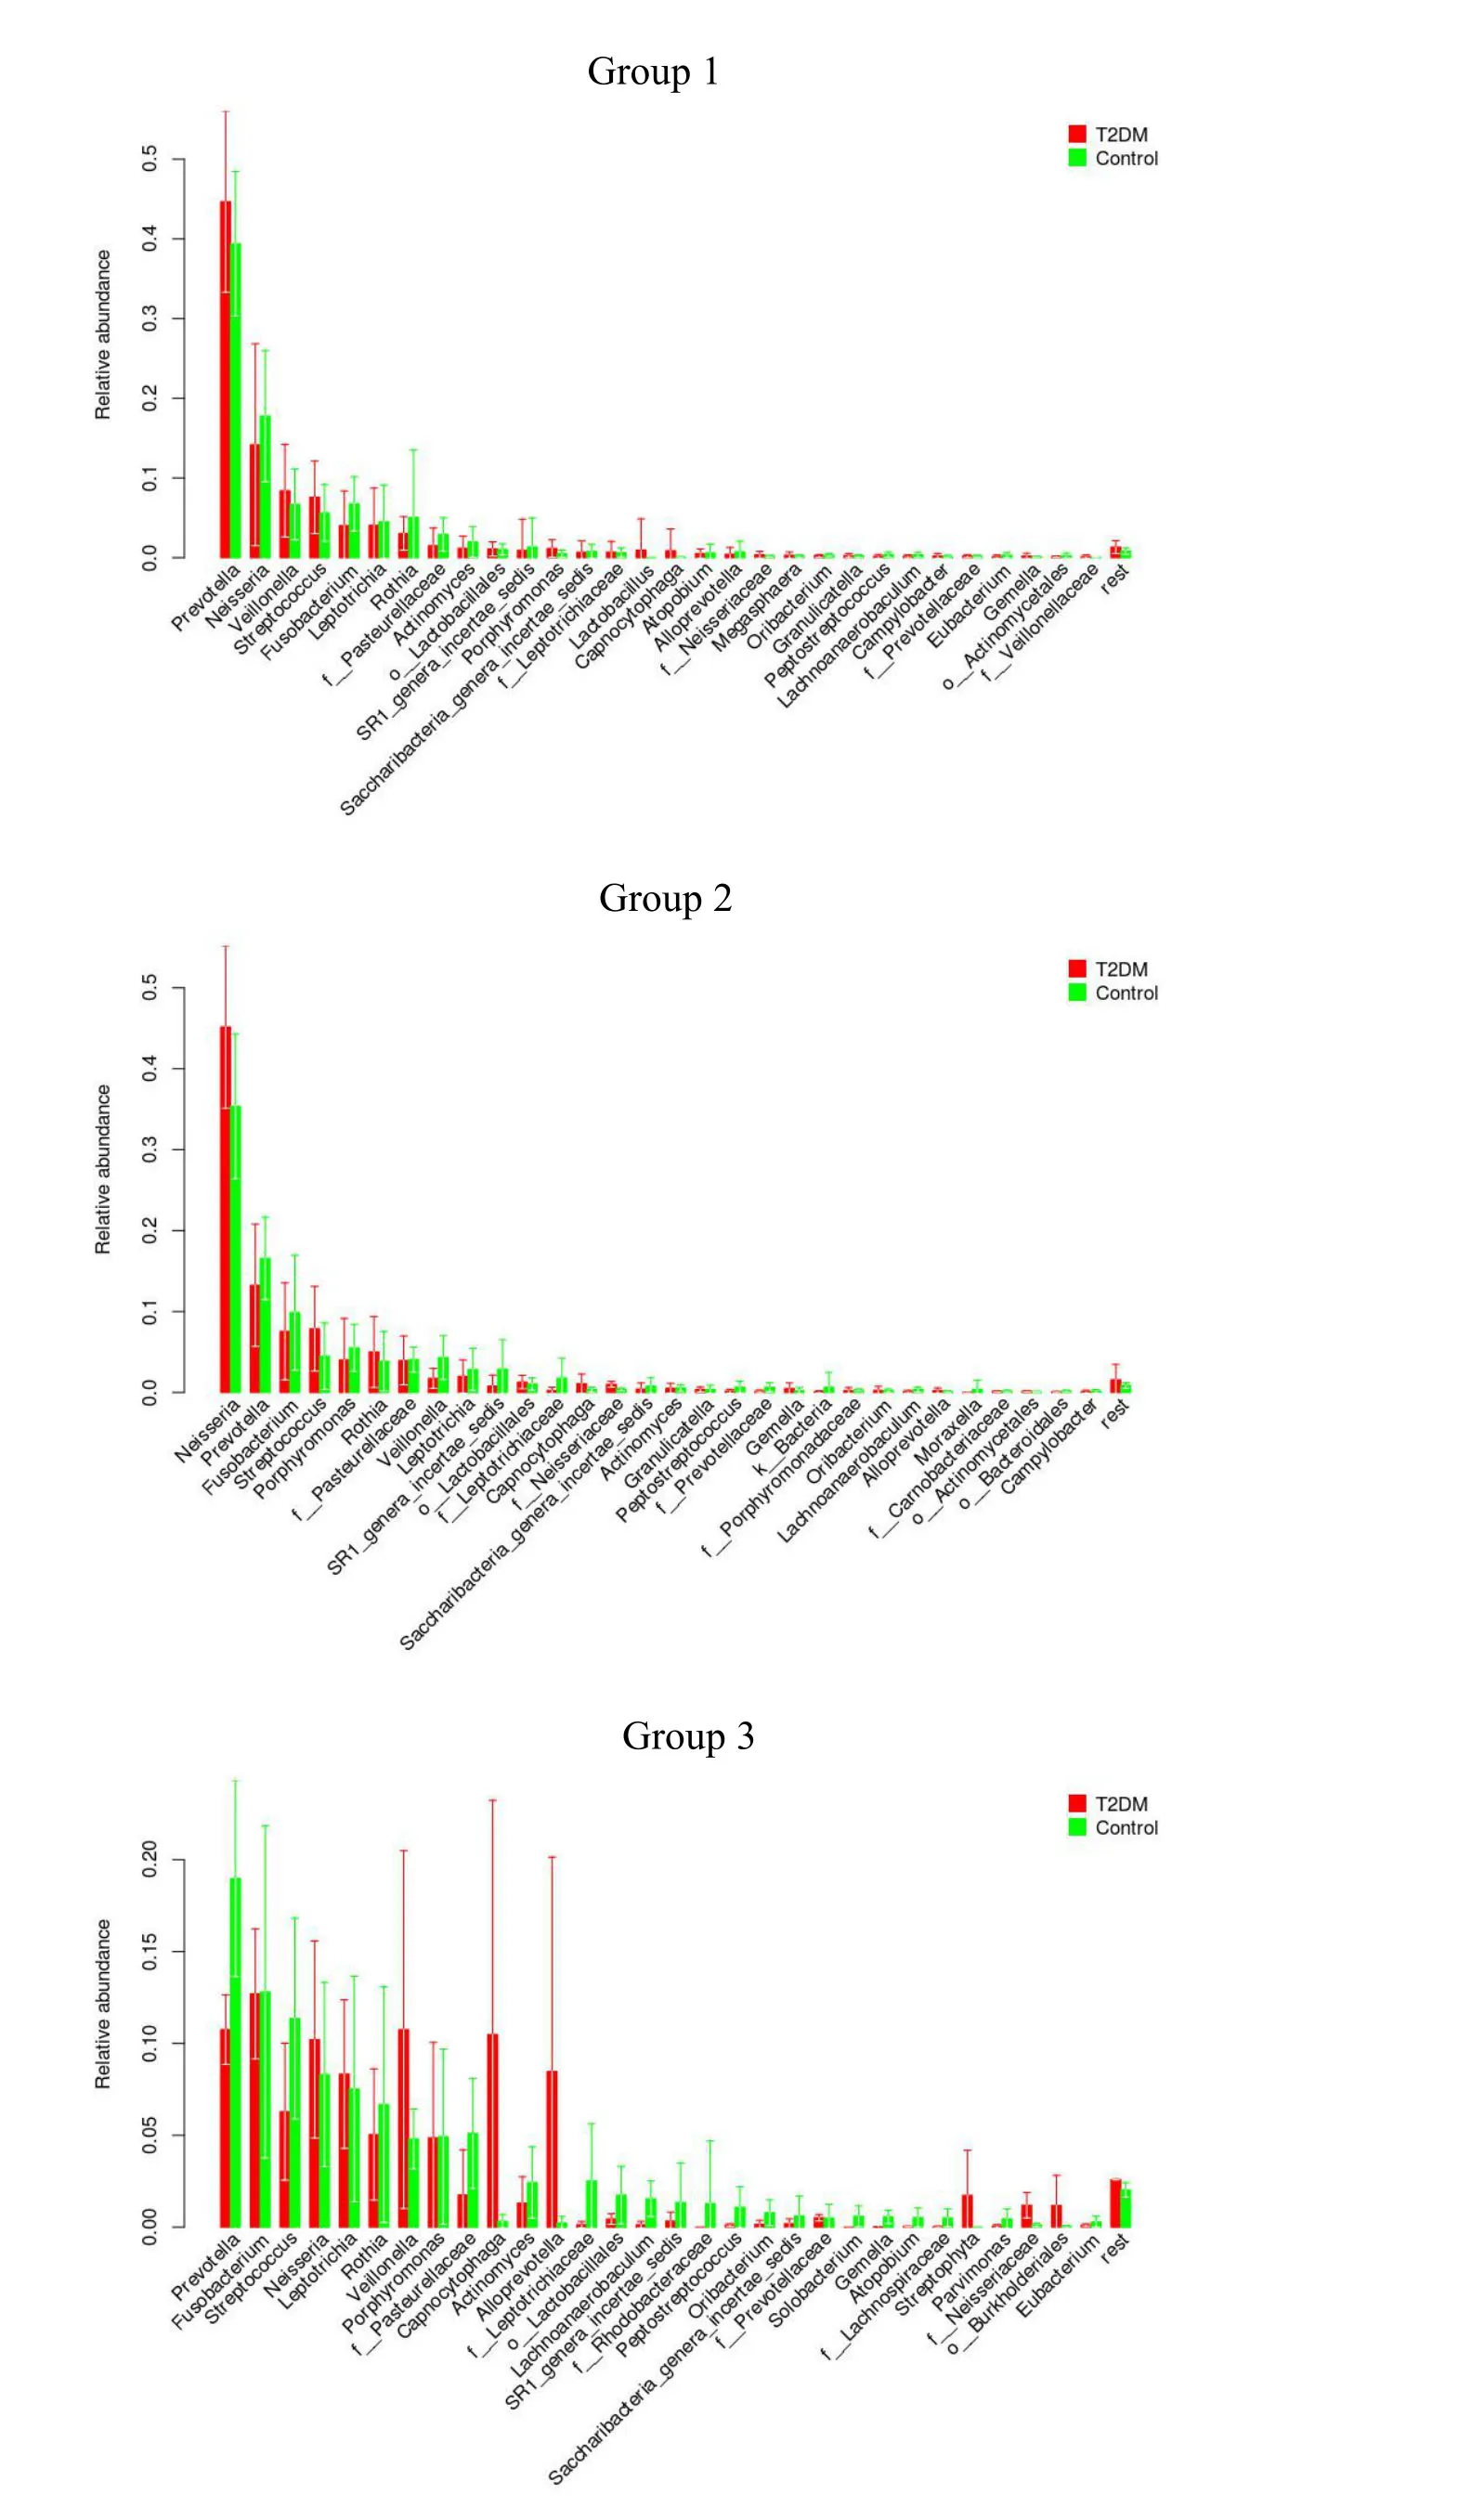
Figure6 Distribution chart of bacterial groups in type 2 diabetes mellitus and control groups
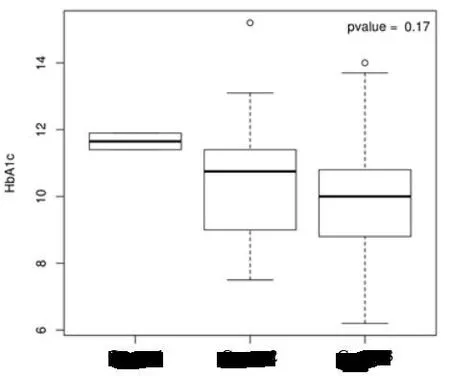
Figure7 Box plots of the association between the microflora structure of each group and HbA1c
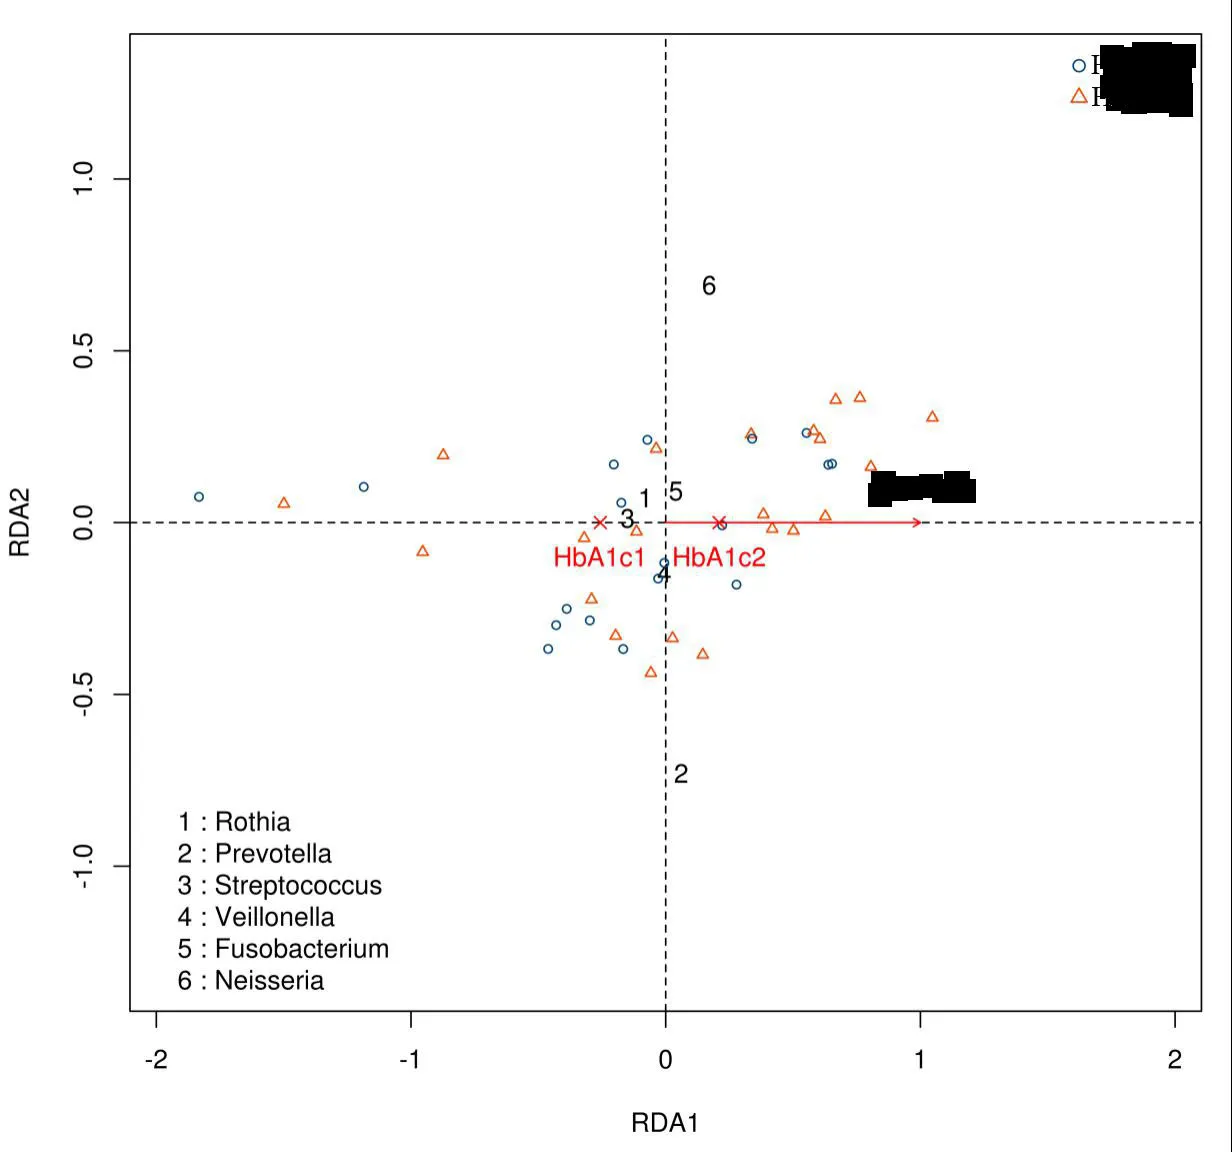
Figure8 RDAanalysis diagram
HbA1c1 is the group with HbA1c value less than or equal to 10 mmol/L;HbA1c2 is group with HbA1c value more than 10 mmol/L.Neisseria,FusobacteriumandPrevotellaand HbA1c2 are highly correlated,whileRothia,Streptococcus,andVeillonellaare highly correlated with HbA1c1 group.RDA,Redundancy analysis.a:Chi-square segmentation showed that the proportion of group 1 microflora in the control group(25.9%)was significantly higher than that in the T2DM group(5.4%);(χ2=3.873,P=0.049).T2DM:Type 2 diabetes mellitus group.

Table1 Comparison with risk estimates of the structure and distribution of microflora of the type 2 diabetes mellitus group and the control group

Table2 Comparison of the microflora structure of non-YTC group and YTC group
RDAanalysis
Redundancy analysis(RDA)was mainly used to demonstrate the association between the bacterial communities and environmental factors(Figure8).It is divided into 2 groups,based on HbA1c values:a group with a HbA1c value less than or equal to 10 mmol/L;and a group with a value more than 10 mmol/L.The analysis indicates thatNeisseria,Fusobacterium,andPrevotellaare highly correlated with HbA1c values higher than 10 mmol/L,whileRothia,Streptococcus,andVeillonellaare highly correlated with HbA1c values less than 10 mmol/L.These results indicated that oral flora was related to blood glucose levels.
Discussion
T2DM is characterized by chronic hyperglycemia caused by IR and insulin secretion dysfunction.Chronic inflammation and innate immune system activation are evident in T2DM pathogenesis[11,12,22].A imbalanced oral microbe flora is associated with oral disease,and may cause T2DM.For example,periodontal pathogenic bacteria and their cell membrane components,such as lipopolysaccharide(LPS),may not only cause local inflammation and periodontal tissue destruction,but also induce immune responses and systemic inflammation in the host’s body [14,15].The mechanism underlying LPS-induced T2DM may be summarized as follows:firstly,LPS inhibits the expression of related genes in host osteoblasts,interferes with the differentiation of periodontal osteoblasts,and prevents self-recovery of periodontal bone;Secondly,it may activate conduction pathways within host inflammatory target cells via toll-like receptors,protein kinase C,PI3K signal transduction etc.,thereby stimulating target cells to secrete inflammatory factors,generate systemic inflammation,and induce T2DM[16,17].
Tumornecrosisfactor-alpha(TNF-α)playsan important role in the inflammatory mechanisms of oral microorganismsleading to T2DM.TNF-α may co-operate with interferon-γto cause abnormal mitochondrial function in β cells of the islets,activate oxidative stress reaction via metalloproteinase,and promote apoptosis of the β cells of pancreatic islets.Mitogen-activated kinase is induced to phosphorylate serine residues of insulin receptor substrate-1,which interferes with signal transduction after insulin binds to the receptor,thereby inhibiting glycogen synthesis and reducing insulin sensitivity to cause T2DM[7].In addition,numerous studies have shown that adiponectin,inflammatory cytokines IL-1 β,IL-6,IL-113,and c-reactive protein may be involved in the process of insulin resistance,which increases the risk of T2DM[18-20].
Other studies have suggested that innate immune system activation may be a joint mechanism of T2DM and atherosclerosis[21].Imbalance of oral microflora initiates or promotes the process of arteriosclerosis[22,23].A large number ofStreptococcusandVeronellacan be detected in atherosclerotic plaque,as wellPorphyromonasgingivaland Orangiomycetesare detected in almost all atherosclerotic plaques[24,25].In addition,trimethylamine N-oxide(TMAO)is an intestinal microbial metabolite associated with atherosclerosis[26,27].Changes in TMAO and its nutritional precursors(choline and l-carnitine)have been found to interfere with insulin sensitivity during weight loss in obese individuals[28].In addition,oral microorganisms may also cause T2DM or interfere with glucose regulation via certain metabolic pathways.A three-year follow-up study showed that individuals who used a mouthwash more than twice a day had a 55%higher risk of developing T2DM or pre-T2DM than those who used little or no mouthwash,and that 30%of them developed or were diagnosed with T2DM[29].Mouthwash can interfere with the balance of oral microorganisms,which reduce the dietary nitrate to nitrite and nitric oxide,which acts as a protective factor in the cardiovascular system and plays a key role in maintaining human blood pressure,blood sugar,and vascular tension.The above findings indicate that oral microbial imbalance may affect the occurrence or aggravation ofT2DM via various mechanisms.Because changes in the internal environment of the body may affect the homeostasis of oral microbiomes,we investigated the link between oral microbiomes and the pathogenesis of T2DM.
In this study,we found dominant flora with different characteristics in three groups of tongue coating.In group 1,the dominant bacteria werePrevotella,Neisseria,VeillonellaandStreptococcus,among others.In the group 2,the dominant bacteria wereNeisseria,Prevotella,Fusobacterium,andStreptococcus,among others.In group 3,the dominantbacteria werePrevotella,Fusobacterium,Streptococcus,andNeisseria,among others.Prevotellacan break down glucose and produce fermentation products of acetic acid,succinic acid,isobutyric acid,and lactic acid.Fusobacteriumis a common non-bacillus gram-negative anaerobic bacterium found in the digestive tract and the respiratory tract of the normal human body,which is associated with many infectious inflammatory reactions and the incidence of periodontaldisease [31,32].Streptococcusis a gram-positive coccus,widely observed in human feces and the nasopharynx,and is associated with suppurative inflammation as well as with toxigenic and allergic diseases.It is also the dominant bacteria in the mouth of patients with T2DM.Neisseriais gram-negative coccus,associated with the formation of dental plaque biofilm[33].Veillonella,which is an anaerobic coccus and a component of normal human flora,is commonly found in the mouth,pharynx,gastrointestinal tract,and the female reproductive tract.It is mostly found in inflammation related to mixed infections,and its pathogenicity is notstrong.VeillonellaandStreptococcusare involved in the early formation of plaque biofilm,and the abundance ofVeillonellain the intestinal flora of obese individuals with T2DM is higher than that of obese individuals without T2DM[34,35].The above findings showed that the microflora structure of T2DM was different from that of the healthy individual and “group 2”and“group 3”microflora in the T2DM group represented an increased risk.There was a close relationship between the “group 3”microflora and YTC.However,the role of YTC in the incidence of T2DM needs further investigation.
In addition,RDA results showed that the dominant oral flora of patients with T2DM with poor glucose regulation(HbA1c>10 mmol/L)was different from that of patients with T2DM with acceptable glucose regulation(lHbA1c≤10 mmol/L).The possibility exists that inflammation and imbalance of the internal environment caused by the disease itself may lead to an imbalance of oral microorganisms,which in turn leads to poor blood glucose regulation seen in T2DM.We hypothesized that the microbiome structure of the human mouth may vary depending on the glycemic control of patients with T2DM.
Conclusion
This study indicates that the incidence of T2DM is related to the imbalance of oral microflora in the human body,and that the structure of oral microflora may change with the degree ofblood glucose regulation.Additionally,the tongue coating flora structure may influence the formation of different tongue coating types in this metabolic condition.
 Traditional Medicine Research2019年6期
- Traditional Medicine Research的其它文章
- Tu Youyou:A scientist moving forward in controversy
- Treatment of diabetic foot ulcer with medicinal leech therapy and honey curcumin dressing:a case report
- Effectiveness of health coaching on diabetic patients: A systematic review and metaanalysis
- Effects of Siwei Yuganzi decoction on LXRα and CYP7A1 in hyperlipidemic rats
- A systematical review of traditional Ayurvedic and morden medical perspectives on Ghrita(clarified butter):a boon or bane
- The research of acupuncture on the treatment of alcohol dependence: hope and challenge
