Ag/reduced graphene oxide(RGO) nanocomposites for detection of TNT
2019-10-16 08:57DONGJunYingCHENDongLiangCHENJingYIRuiZHANGDongShengXUPeng
北京化工大学学报(自然科学版) 2019年5期
DONG JunYing CHEN DongLiang* CHEN Jing YI Rui ZHANG DongSheng XU Peng
(1.College of Mechanical and Electrical Engineering, Beijing University of Chemical Technology, Beijing 100029;2.CAS Key Laboratory of Standardization and Measurement for Nanotechnology, National Center for Nanoscience and Technology, Beijing 100090, China)
Abstract: The modified Hummers method was employed to generate graphene oxide, and Ag/reduced graphene oxide (RGO) nanocomposites were synthesized at different temperatures by using sodium citrate as the reductant. Scanning electron microscopy (SEM), transmission electron microscopy (TEM), X-ray diffraction (XRD), X-ray photoelectron spectroscopy (XPS) and Raman spectroscopy were employed to characterize the reaction products. The results indicate that RGO has been synthesized successfully, and Ag particles are distributed evenly on the surface of RGO. The RGO prepared at a reaction temperature of 120 ℃ shows the best surface-enhanced Raman scattering (SERS) activity. The Ag/RGO nanocomposites modified by 10-5 mol/L 4-aminothiophenol (PATP) successfully detect a 10-5 mol/L 2,4,6-trinitrotoluene (TNT) alcohol solution.
Key words: sodium citrate; reduced graphene oxide; Ag/RGO; surface-enhanced Raman scattering (SERS); trinitrotoluene (TNT)
Introduction
2,4,6-trinitrotoluene (TNT) is the most widely used explosive in military and terrorist attacks[1]. It has carcinogenicity as well as biological toxicity, resulting in hematological diseases[2], which seriously threat human health and natural environment. Therefore, it is of great significance for trace detection on TNT. At present, there are many methods to detect TNT, including gas chromatography-mass spectrometer (GC/MS)[3], fluorimetric method[4], ion mobility spectroscopy (IMS) and electrochemical method[5].
Surface-enhanced Raman scattering (SERS) is based on the electromagnetic enhancement mechanism of rough metal substrate and the charge transfer enhancement mechanism between substrate and analyte[6]. SERS is an effective method for detecting trace TNT, based on the aggregation of metal nanocolloid or Meisenheimer complex compound formed by the π-donor-acceptor interaction between TNT and composite materials[7-8].
Graphene is a 2-D carbon material with sp2hybrid orbitals, with large specific surface area (~2 630 m2/g), which can adsorb molecules and metal nanoparticles effectively. Combining with metal nanoparticles, graphene can not only prevent nanoparticles’ agglomeration due to the van der Waals force between the carbon layers, but also achieve the trace detection of organic molecules via surface plasmon resonance of metal nanoparticles. Au and Ag nanoparticles are widely used in the detection of TNT for their easy preparation, stability and the prominent ability of SERS enhancing[9]. The hybrid methods of graphene and its derivatives with Ag/Au include in-situ synthesis and off-site hybridization. Chemical reduction[10-11]is widely used for its accessible raw materials, simple equipment and controllable synthesis process.
Few previous studies related to SERS activity concern about reaction temperature while preparing nanocomposite material as SERS substrate. In order to obtain better SERS performance and avoid the toxicity, graphene oxide (GO) and AgNO3were employed as the precursor in this paper, and sodium citrate as reducing agent to synthesize Ag/RGO nanocomposites directly. The Ag/RGO nanocomposites modified by 10-5mol/L 4-aminothiophenol (PATP) are prepared to detect TNT in alcohol solution.
1 Experimental
1.1 Materials
Graphite powders (C,≥99%, Alfa Aesar), sulfuric acid (H2SO4, 95%-98%, Beijing Chemical Works), potassium permanganate (KMnO4, ≥99.8%, Beijing Chemical Works), hydrogen peroxide (H2O2,≥30%, Aladdin), silver nitrate (AgNO3,≥99.8%, Aladdin), sodium citrate (C6H5Na3O7·2H2O,≥99.7%, Beijing Chemical Works),p-aminothiophenol (PATP, 4-NH2C6H4SH, Sigma Aldrich), 2,4,6-trinitrotoluene (TNT, C7H5N3O6, 1 mg/mL, Aladdin). All chemicals are of A.R. grade purity and are used without purification. The water used in the experiment is ultrapure water (18 MΩ·cm, Beijing University of Chemical Technology).
1.2 Preparation of Ag/RGO
Graphite oxide was synthesized based on modified Hummers method[12]. 0.016 g of GO was dispersed in 100 mL pure water, then ultrasonic agitating(200 W) for 2 h, to form a uniform and stable GO aqueous solution (0.16 mg/mL). 25 mL of GO solution was added to the 100 mL three-necked flask, and then 0.275 g of sodium citrate was put into the solution. The flask was heated to 90 ℃, 120 ℃, 150 ℃ respectively to prepare three kinds of RGO. 0.025 5 g silver nitrate was added into the solution and stirred for 2.5 h, and then the solution was naturally cooled to room temperature. The generated sediments were centrifuged at 10 000 r/min for 10 min and washed with pure water, then dispersed in 5 mL pure water. Three kinds of synthesized productions with different reaction temperature of 90 ℃, 120 ℃ and 150 ℃ are respectively denoted as Ag/RGO 90, Ag/RGO120 and Ag/RGO150.
1.3 SERS measurement
1.3.1Detection of probe molecule
Equivalent Ag/RGO90, Ag/RGO120, Ag/RGO150 dispersed liquids were mixed with PATP ethanol solution respectively. The adsorption equilibrium was achieved after vibrating the solution for several seconds and standing for 3 h at room temperature.
1.3.2Detection of TNT
The process to detect TNT with Ag/RGO is as follows: 100 μL of Ag/RGO mixture, 100 μL of PATP ethanol solution (1×10⁻⁵mol/L), 400 μL of water and 300 μL of ethanol solution were added into centrifuge tube, and then vibrated for seconds and kept at room temperature for 3 h to achieve adsorption equilibrium. The mixed solution with a concentration of 1×10⁻⁶mol/L TNT was painted on aluminum foil and then cured by vacuum drying. The samples on foils were prepared for SERS test consequently.
1.4 Characterization methods
The analysis of micromorphology was conducted with Tecnai G2 F20 U-TWIN transmission electron microscope (TEM) operated at 200 kV. X-ray diffraction (XRD) was performed at scanning angle between 5° and 90° and scanning speed of 10(°)/min with X’Pert Pro MPD X-ray diffractometer. ESCALAB 250 Xi XPS spectrometer (Thermo Fisher Scientific) was employed by using the laser source with 1 486.6 eV Kα ray of Al. Raman spectra was collected through a Renishaw inVia plus Raman spectrometer by using the radiation of 514 nm laser light source to explore the morphologies, structures, elements and SERS activities of the samples.
2 Results and discussion
2.1 Characteristics of micromorphology

Fig.1 HRTEM micrographs and particle size distributions of GO, Ag/RGO90, Ag/RGO120, Ag/RGO150
The morphologies of Ag/RGO and the distribution of Ag nanoparticles were observed by TEM. Fig.1(a) shows that the GO has a lamellar structure with a few folds on the surface. While in Fig.1(b), (d) and (f), the silver nanoparticles were dispersed in the RGO nanosheets. It reveals that GO with negative charges and Ag+with positive charges were combined by electrostatic attraction. The silver ions were reduced to metallic silver by sodium citrate. As shown in Fig.1(c), (e) and (g), the silver nanoparticles in both cases of 90 ℃ and 120 ℃ show a similar size of 20 nm, and the size of nanoparticles prepared at 150 ℃ increases to around 39 nm. Silver ions can be reduced at 90 ℃ by sodium citrate. With continued increase of reaction temperature, the remnant sodium citrate will react further with silver ions, resulting in less particles covering the crystal nucleus and causing the existence of some larger particles on RGO layers. While temperature reaches 150 ℃, the solution boils to excess and the crystal nucleus will grow continuously which leads to aggregation.

Fig.2 XRD patterns of graphite, GO, Ag/RGO90, Ag/RGO120,and Ag/RGO150
2.2 Analysis of chemical phase and crystal structure
Fig.2 shows the XRD patterns of graphite, GO and Ag/RGO nanocomposites prepared at various temperatures. As shown in Fig.2(a), a characteristic diffraction peak of graphite appears at 26.4°, which belongs to (0 0 2) crystal plane. This characteristic diffraction peak of graphite disappears after oxidation, and another wider diffraction peak appears at 10.6° attributing to (0 0 1) crystal plane of carbon. According to the Bragg equation, the interplanar distance of GO is 8.34 Å, larger than that of graphite (3.37 Å), which indicates that the crystal structure of graphite was damaged during oxidation process. There are many oxygen-containing functional groups such as carboxyl, carbonyl and hydroxyl groups on the surface of the lamellar. Larger interlayer spacing is beneficial for doping other molecules.
The XRD patterns of Ag/RGO nanocomposites show that the diffraction peak of GO at 10.6° disappears after reduction by sodium citrate, and new diffraction peak appears between 20° to 25°. According to the Bragg equation, the interplanar distance of graphene in nanocomposites is 4.04 Å, larger than that of graphite(3.37 Å) resulting from the remaining unreduced oxygen-containing functional groups in RGO. In Fig.2(b), four characteristic diffraction peaks appear simultaneously at 38.1°, 44.3°, 64.4°, 77.5°, which refers to (1 1 1), (2 0 0), (2 2 0), (3 1 1) crystal plane of Ag respectively according to the standard card PDF#04-0783, indicating successful preparation of Ag/RGO nanocomposites.
2.3 Analysis of element composition

In order to prove the successful preparation of Ag nanoparticles in Ag/RGO nanocomposites, an Ag3d high resolution XPS analysis of Ag/RGO nanocomposites was carried out. Ag3d5/2is sensitive to surrounding chemical environment[13], thus this peculiarity can be used to distinguish the silver ion from metallic silver. The Ag3d5/2of pure metallic silver located at 368.1 eV[14]. In Fig.4, the characteristic peak position of Ag3d5/2for Ag/RGO nanocomposites centred at 368.3 eV, which is similar to that of metallic silver. And the separation distance between Ag3d5/2and Ag3d3/2spin orbit is 6 eV[14]. This result can further prove that the existence of silver is elementary substance in the nanocomposites.
2.4 Analysis of molecular structure
Fig.5 and Table 1 show the Raman spectra of GO, Ag/RGO90, Ag/RGO120, Ag/RGO150, the peak position of D/G and the peak intensity ratio. The D band, arising from a breathing mode of k-point photons of A1gsymmetry vibration, and the G band, arising from the first order scattering of the E2gphonon of sp2C atoms, can be observed from both GO and Ag/RGO samples[15]. The D band in GO is located at 1 355 cm-1and the G band at 1 602 cm-1. Resulting from the chemical reduction, the peak intensity of oxygen functional groups in GO reduces, and the nanostructures of sp2orbit will be repaired and restored. The G band will red-shift from 1 610 cm-1to 1 596 cm-1, indicating the formation of graphene nanosheets. The ratio of Raman intensity of the D and G band (ID/IG) in graphene is inversely proportional to the reciprocal of the average crystallite size[15]. With the increase of reaction temperature,ID/IGincreases from 0.95 of GO to 1.19 of Ag/RGO150, which indicates the increasing formation of oxygen-containing functional groups.

Fig.3 C1s high resolution XPS spectra of GO, Ag/RGO90, Ag/RGO120, and Ag/RGO150

Fig.4 Ag3d high resolution XPS spectra of Ag/RGO90, Ag/RGO120, and Ag/RGO150
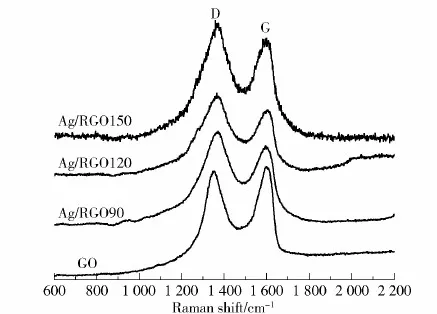
Fig.5 Raman spectra of GO, Ag/RGO90, Ag/RGO120, Ag/RGO150

Table 1 Raman peak positions and D/G intensity ratio of
2.5 Analysis of SERS activity
Fig.6 shows the SERS spectra of PATP with different concentration of Ag/RGO90, Ag/RGO120 and Ag/RGO150. There are two main characteristic peaks in the Raman spectra of PATP[15]: the band at 1 086 cm-1arising from C—S complete stretching vibration and the band at 1 593 cm-1arising from C—C complete stretching vibration. The Raman spectra of 10-3mol/L pure ethanol solution of PATP in Fig.6 shows the characteristic peaks of ethanol which are at 883 cm-1,1 052 cm-1,1 098 cm-1,1 278 cm-1and 1 455 cm-1[16]. The characteristic peak of PATP can not be detected in 10-3mol/L pure ethanol solution by Raman spectrum, while mixed with Ag/RGO nanocomposites, the characteristic peak of 10-7mol/L PATP can be detected clearly(1 086 cm-1, 1 593 cm-1).

Fig.6 SERS spectra of different concentration of PATP on Ag/RGO90, Ag/RGO120, Ag/RGO150
For the mixture of Ag/RGO and PATP, the SERS spectra shows great diversity from the Raman spectra of PATP powder. The characteristic peaks of C—S complete stretching vibration modes and the C—C complete stretching vibration modes all take frequency shift in different degrees. This phenomenon may derive from the interaction between the sulfhydryl groups and benzene ring on PATP molecules and the Ag/RGO. There are three new characteristic peaks generated in SERS spectra belonging to the Agvibration modes of the oxidation coupling products 4,4′-dimercaptoazobenzene(DMAB) at 1 144 cm-1, 1 393 cm-1and 1 439 cm-1respectively[15].
Comparing Fig.6(a), (b) and (c), while the PATP concentration is 10-6mol/L, the PATP characteristic peak of Ag/RGO150 can not be detected, only the characteristic peaks of ethanol can be detected. Whereas with Ag/RGO90 and Ag/RGO120, the PATP characteristic peak can still be detected. While the concentration of PATP decreases to 10-7mol/L, the characteristic peaks of PATP of Ag/RGO120 are still distinct, and the SERS intensity of Ag/RGO120 is much higher than that of Ag/RGO90. When reaction temperature is higher, the aggregation of Ag nanoparticles in Ag/RGO150 could result in the weakest SERS activity, showing the Ag/RGO120 has the best SERS activity for PATP in the three nanocomposite materials. Therefore, Ag/RGO120 is employed as the SERS substrate in the following work.
Meantime, we found that the intensity of SERS does not increase with the concentration of the probe molecule. 10-5mol/L of PATP shows the highest intensity in Fig.6. When the concentration of the probe molecule is too high, the transfer of charge between the substrate and the molecule is hindered by excess molecules that are not adsorbed, which weakens the enhancement effect. As the concentration reduced further, the probe molecule cannot completely cover the surface of the substrate, which leads to a high Raman spectrum background and influences the enhancement effect.
2.6 TNT detection by SERS
TNT contains three —NO2groups to form a stable chemical structure, which makes it difficult to interact with Ag/RGO. So PATP is employed as a connector. Selective oxidation coupling reaction occurs between Ag/RGO and PATP, generating DMAB substance and Ag—S band. Then the SERS detection can be conducted by the mixture interacting with TNT.
In order to detect TNT more efficiently, appropriate substrate and PATP concentration are significant. In this paper, Ag/RGO120 as the SERS substrate and PATP with a medium concentration of 10-5mol/L are selected to detect TNT.

Fig.7 SERS spectra of TNT on Ag/RGO120

3 Conclusion
Sodium citrate reduction method was employed to synthesize Ag/RGO nanocomposites at three different temperatures. The results of the morphology and property characterization indicate that the Ag/RGO at a reaction temperature of 120 ℃ possesses the best SERS activity.
The PATP at concentration of 10-6mol/L can be detected by Ag/RGO nanocomposites. The trace detection of TNT ethanol solution of 10-5mol/L is achieved by the Ag/RGO120 nanocomposites modified by suitable concentration of PATP. The obvious SERS characteristic peaks of TNT indicate that Ag/RGO can serve as the SERS active substrate for TNT detection.