Introduction of fretting-contact-induced crack closure: Numerical simulation of crack initiation and growth path in disk/blade attachment
Chen HU, Dasheng WEI, Yanrong WANG, Xianghua JIANG
School of Energy and Power Engineering, Beihang University, Beijing 100083, China
KEYWORDS
Abstract Fretting fatigue crack initiation and growth in titanium alloy dovetail assembly was investigated by the Finite Element Method (FEM). Firstly, contact stress was calculated precisely with an elastic-plastic material model. Secondly, the location and angle of crack initiation were determined by the parameter of the maximum shear stress range on the critical plane,and the angle of crack growth was predicted by the Maximum Tangential Stress (MTS) criterion, which showed agreement with experimental observation. Finally, the fretting-contact-induced crack closure behavior was simulated by the node release technique in software ABAQUS with both elastic and elastic-plastic material models. The simulation shows that the variation of the contact status between fretting surfaces will result in crack closure even for the elastic material model.The fretting crack closure ratio decreases as the crack grows out of the contact area and it has great impact on the effective range of Stress Intensity Factor (SIF) as well as the crack growth rate.
1. Introduction
The dovetail assembly is widely applied in the blade and disk attachment of aero-engine compressors, where fretting fatigue often occurs on the contacting faces. Fretting conditions may result in a reduction of the fatigue limit of a material up to 50%.1Therefore,there have been more and more experimental and numerical investigations on fretting fatigue.2-5In fretting fatigue analysis, the precise calculation of contact stress is a key step because of the strong-nonlinearity in contact analysis especially for elastic-plastic materials. Moreover, due to the limitations of some analytical formulas, the Finite Element Method(FEM)has been extensively used in engineering structures because of its capability to obtain the stress-strain field around the contact zone.It has been realized that the mesh size of a Finite Element(FE)model has a significant effect on contact stress calculation, and the convergence check with mesh refinement is crucial.
Many approaches and parameters have been put forward and adopted to predict the location and angle of crack initiation.6Yang and Mall7carried out a numerical analysis of two-stage crack growth. He assumed that crack initiation occurred in the shear mode at the location of the highest shearstress amplitude,and numerical results agreed with experimental observations. Lykins et al.8conducted fretting crack initiation experiments in titanium alloy and evaluated several parameters including the Smith-Watson-Topper (SWT)parameter, the critical plane SWT parameter, and the Fatemi-Socie (FS) parameter.9,10Va´zquez et al.11investigated the initial crack path of Al7075-T651 alloy with cylindrical contact and used some multi-axial parameters to predict the crack initiation path. According to experimental crack initiation paths, numerical results showed that the SWT parameter gave much better estimations than those of the FS parameter.In the authors’ previous investigation,12based on the critical plane method,an approach introducing the cyclic strain range and the stress gradient was developed to predict the fatigue life of specimens,which was in agreement with experiment results.
After initiation, a crack would grow in mixed mode in the vicinity of the fretting contact area under multi-axial stress field. Golden and Calcaterra13conducted constant-amplitude loading dovetail fretting fatigue experiments and evaluated a fracture mechanics life prediction methodology. Proundhon and Basseville14used the FEM to analyze the growth of fretting cracks and study the influences of the crack angle and the friction between crack faces. Wahab et al.15presented the application of a fretting fatigue crack propagation predictive technique based on extended finite element method and achieved good agreement with experimentally measured crack trajectory.
One problem related to crack growth is how to introduce the effect of crack closure. Elber16firstly discovered the phenomenon of crack closure, i.e., Plasticity-Induced Crack Closure (PICC), which is the most widely investigated kind of crack closure. However, it has been reported recently that a new kind of crack closure mechanism is found in fretting fatigue experiments, or called fretting-contact-induced crack closure.17According to the results of numerical analysis, this type of crack closure is different from PICC in that it occurs for both elastic and elastic-plastic material models,18which will have a significant effect on crack growth life. However,investigation on fretting-contact-induced crack closure in engineering structures such as the dovetail assembly has been inadequate so far, and its impact on crack growth life is not clear.
In summary,the FEM is used to investigate crack initiation and crack growth in the dovetail assembly. The first section is focused on contact analysis including the establishment of an FE model and the calculation of contact stress. The next section is concentrated on fracture mechanics analysis, where crack initiation, crack growth, and the crack closure ratio are determined sequentially, and the effective range of stress intensity factor is obtained based on the crack closure ratio.Finally, some conclusions are drawn based on numerical results.
2. Calculation of contact stresses
2.1. The model of dovetail assembly
The geometry of the dovetail assembly investigated in this study is depicted in Fig. 1, which contains a blade and disk part. The symbol n and t represent the normal and tangential direction of the contact surface, respectively. The point A and B are the boundaries of contact surface, and there is one fillet with radius r=2 mm at each point.The symmetric boundary condition is set on B1,and the cyclic symmetric boundary condition is set on B2. The cyclic tension stress on B3is used to represent the centrifugal load of the rest part of the blade,and the load ratio is R=0. The curve C is another side of the disk. The penalty friction formulation in FE software ABAQUS is adopted with a friction coefficient of 0.3. The local coordinate is established to plot the results of contact stresses.
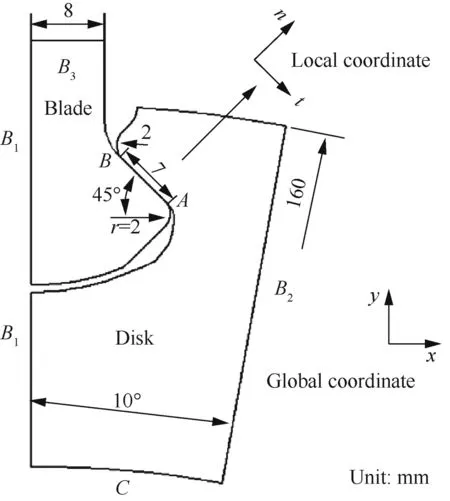
Fig. 1 Geometry and boundary conditions.
The material data of titanium alloy TC4 at 20°C is used in calculation. The stress-strain relationship is illustrated in Fig. 2. The Young’s modulus of TC4 at this temperature is 109 GPa, Poisson’s ratio is 0.34, and the yield stress is 880 MPa.19
2.2. Determination of the element size of the FE model
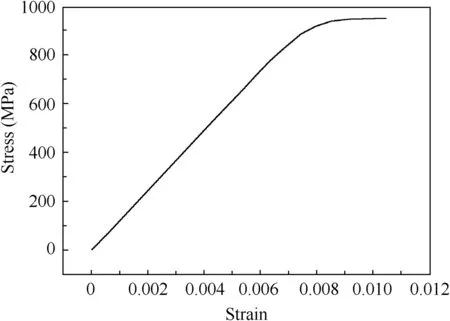
Fig. 2 Stress-strain relationship of TC4 at 20°C.
An FE model is established by using 4-node bilinear plane strain elements.The initial element size along the contact zone is 50 μm, and the corresponding von-Mises stress is presented in Fig.3,which reveals that the location of the maximum von-Mises stress is near point B shown in Fig. 1. Therefore, this area is chosen to determine the element size and carry out the following crack analysis. In addition, it shows that the maximum von-Mises stress, 975.9 MPa, is beyond the yield stress of TC4, that is to say, an elastic-plastic material model should be used.
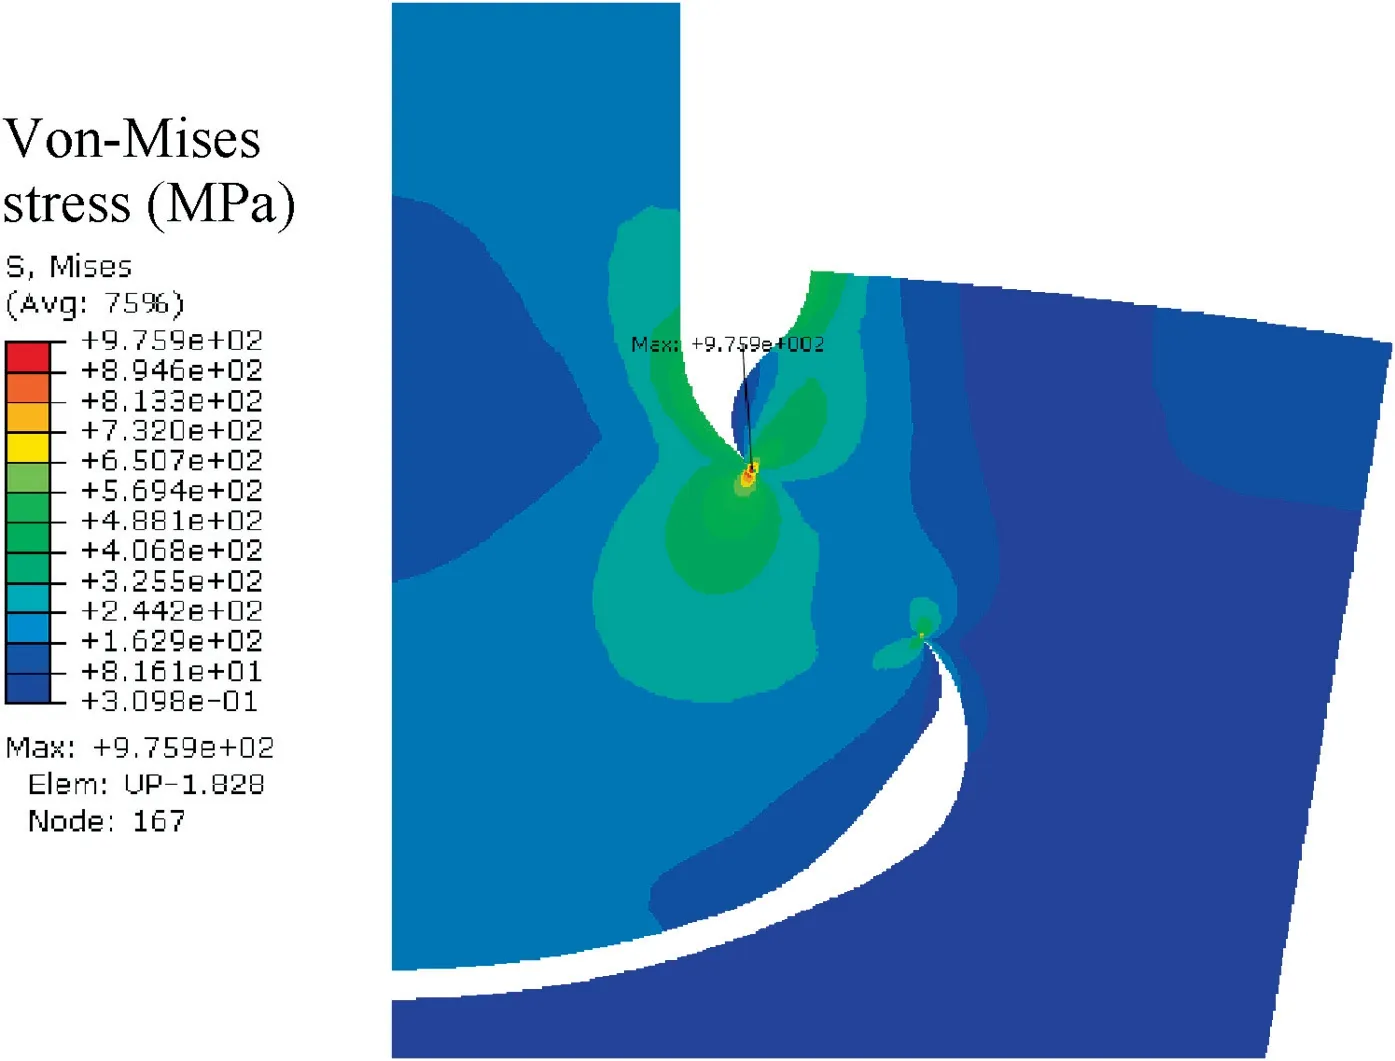
Fig. 3 Contact stress of coarse mesh.
Six FE models with different element sizes are adopted to study the influence of mesh quality on numerical results and to improve the precision of contact analysis. The parameters of No.1 to No.6 FE models are listed in Table 1.The normal stress in the t direction σt,shear stress τtn,and normal stress in the n direction σnin the local coordinate along the contact zone of different models are depicted in Fig. 4,of which point B is located at a point of 0.3 mm. The following criterion for stress components to reach convergence is adopted as suggested by Wei et al.20


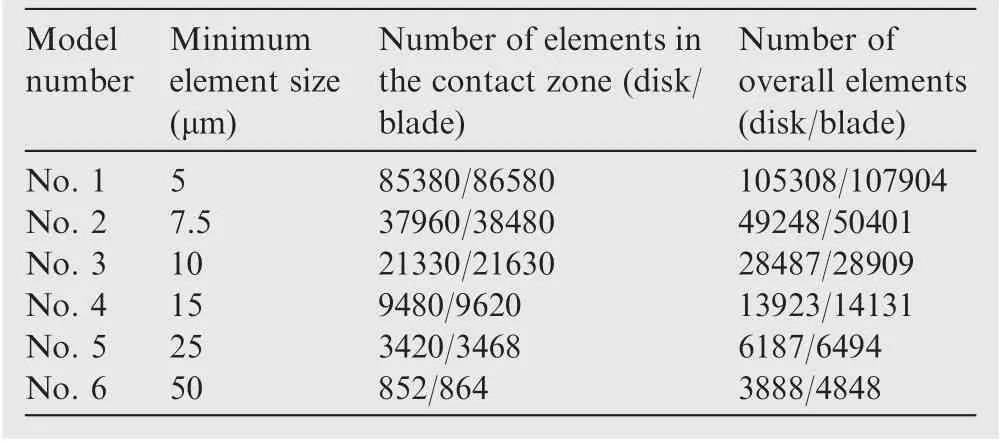
Table 1 Details of FE models.
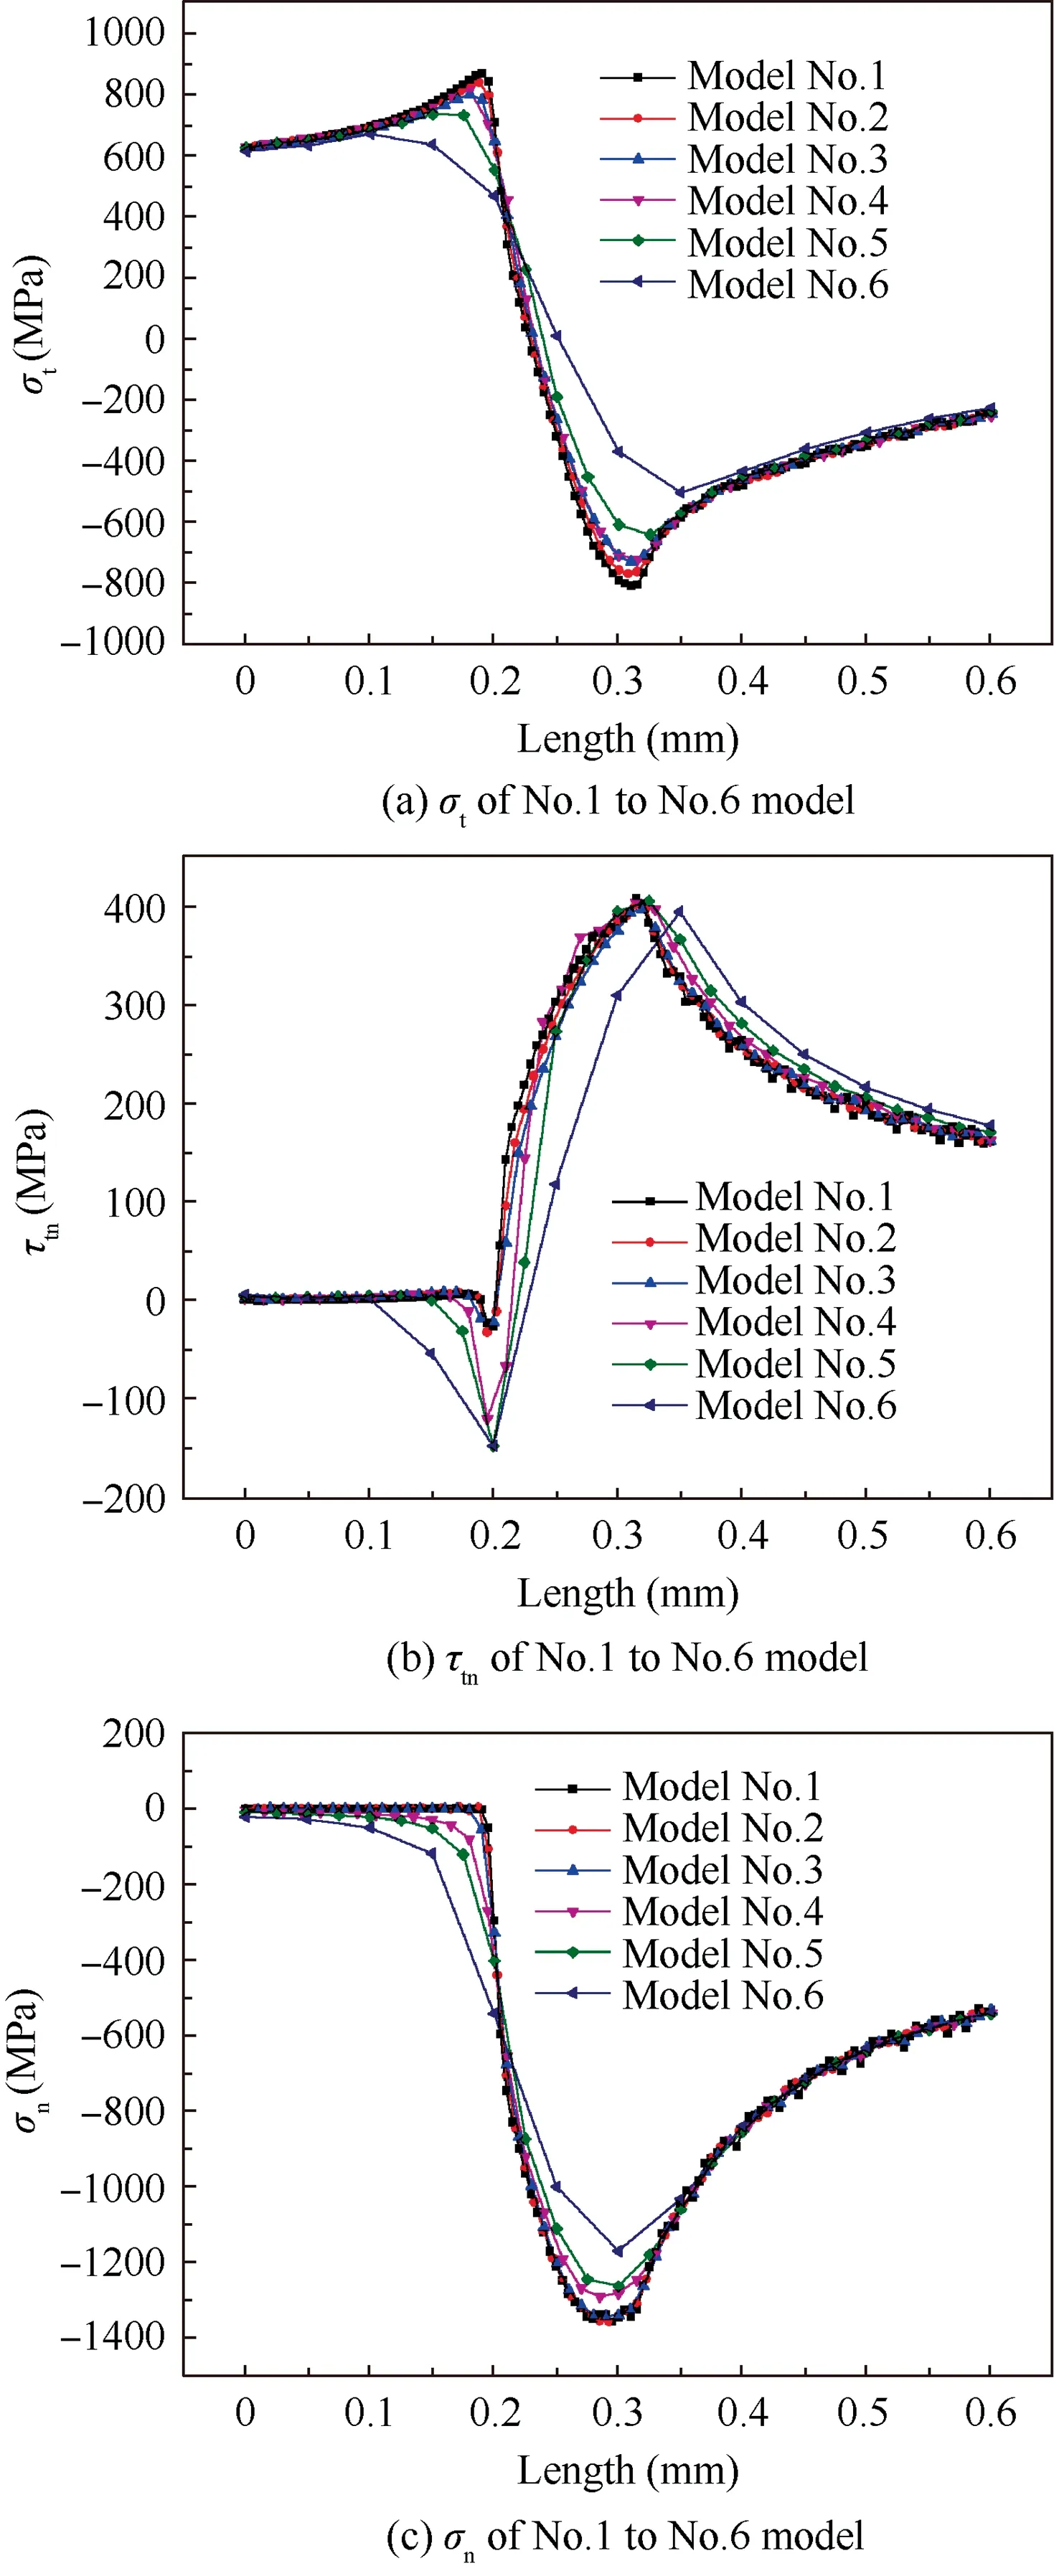
Fig. 4 Contact stress components near point B.
3. Simulation of crack initiation and crack growth
3.1. Determination of crack initiation
The critical plane parameter of the maximum shear stress range is adopted to predict the location and angle of crack initiation as suggested by Nowell21and Lykins22et al. In a loading cycle, the shear stress can be calculated by the following equation on different planes, which are determined by angle θ. The term σx, σy, and τxyare the normal stress in the x, y direction and shear stress, respectively. The angle convention is defined in Fig. 6.

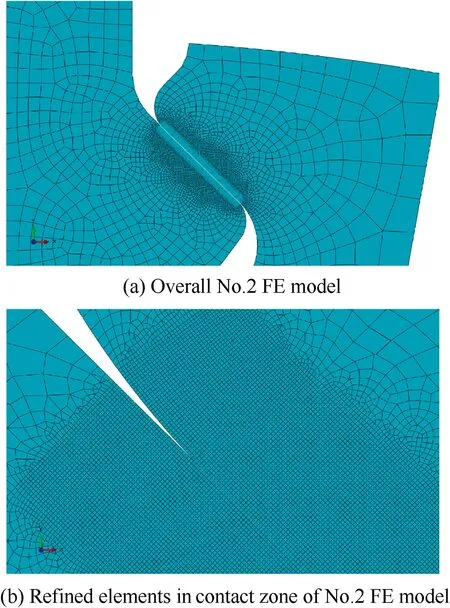
Fig. 5 No. 2 FE model and contact zone.
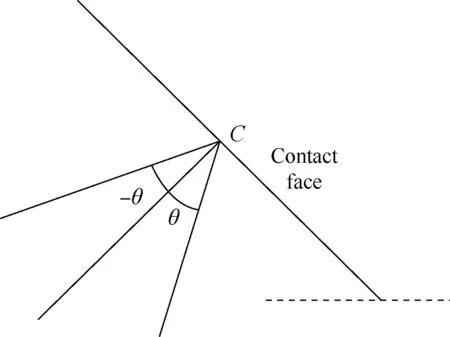
Fig. 6 Angle convention.
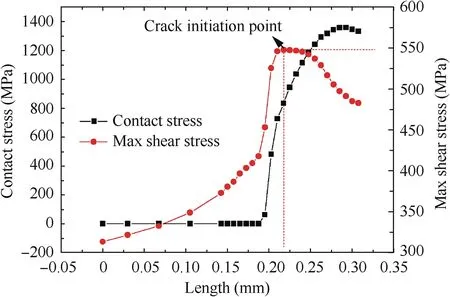
Fig. 7 Crack initiation prediction based on critical plane parameter of the maximum shear stress range.
Angle θ for the planes ranges from-90°≤θ ≤90°with an increment of 0.1°, and the calculation results of the maximum shear stress range are presented in Fig.7.Fig.7 also illustrates the contact stress distribution near point B,and it can be seen that a crack will initiate in the fourth node that comes into contact. According to the calculation results, the maximum shear stress range is 548 MPa, and the crack initiation angle α is 53.5°.
Instead of directly introducing the initial crack, the node release technique in FE software ABAQUS is utilized to simulate the formation of the initial crack, which can better simulate the real process of gradual crack initiation and growth,especially for elastic-plastic material models.Firstly,the initial seam crack denoted by the black line in Fig.8(a)is introduced,but the element edges along the crack line are bonded by element nodes,therefore the contact stress of this model is almost the same as that of model No. 2 used in Section 2.2, as illustrated in Fig. 8(b) and (c).
Then,the bonded nodes are released one by one to simulate the growth of the initial crack until the crack length reaches 50 μm as suggested by Hutson et al.23Besides, Lykins22and Giannakopoulos24et al. investigated the fretting fatigue behavior of the same material as that of the present paper,and reported an initial crack length of about 50 μm from their experimental observations. A schematic of the node release technique is shown in Fig. 9. The frictionless contact between the master surface and the slave surface is established, which are used to represent two crack faces respectively. When the cyclic centrifugal load reaches its maximum amplitude, the crack tip node will be released, and the crack will grow with an increment of the element size.
The formation of the initial crack and the corresponding contact status (Cstatus) are shown in Fig. 10. There are 8 cycles, and one node will be released per cycle, while the element size along the crack line is 6.25 μm. It should be noted that the disk part in the assembly is not shown here, and the deformation factor is set to be 10 times to show the growth of the initial crack more clearly.
3.2. Determination of crack growth
A linear elastic stress-strain relationship is utilized here to calculate stress intensity factors KIand KIIof different initial crack lengths, which will be used to determine the crack growth path. The MTS criterion is adopted, which can be expressed as follows25:

where β is the crack growth angle. The crack growth angle is calculated with different initial crack lengths, and results are shown in Fig. 11, which demonstrates that different initial crack lengths have little influence on the crack growth angle,therefore it is reasonable to set the initial crack length to 50 μm as discussed before, and the corresponding crack growth angle β is 52° according to Eq. (3).
The configuration of the crack growth path is presented in Fig. 12(a), point C is the crack initiation point, point D is the transition point where crack growth stage begins,point E is the end point of crack growth stage, line CD represents the initial crack and line DE represents the crack growth path, α and β are the angle of crack initiation and growth, respectively. It shows that the crack growth path is almost perpendicular to the contact face (the angle between the crack growth path and the normal of the contact surface is 1.5°), which is in agreement with the authors’ previous experimental observation shown in Fig. 12(b).
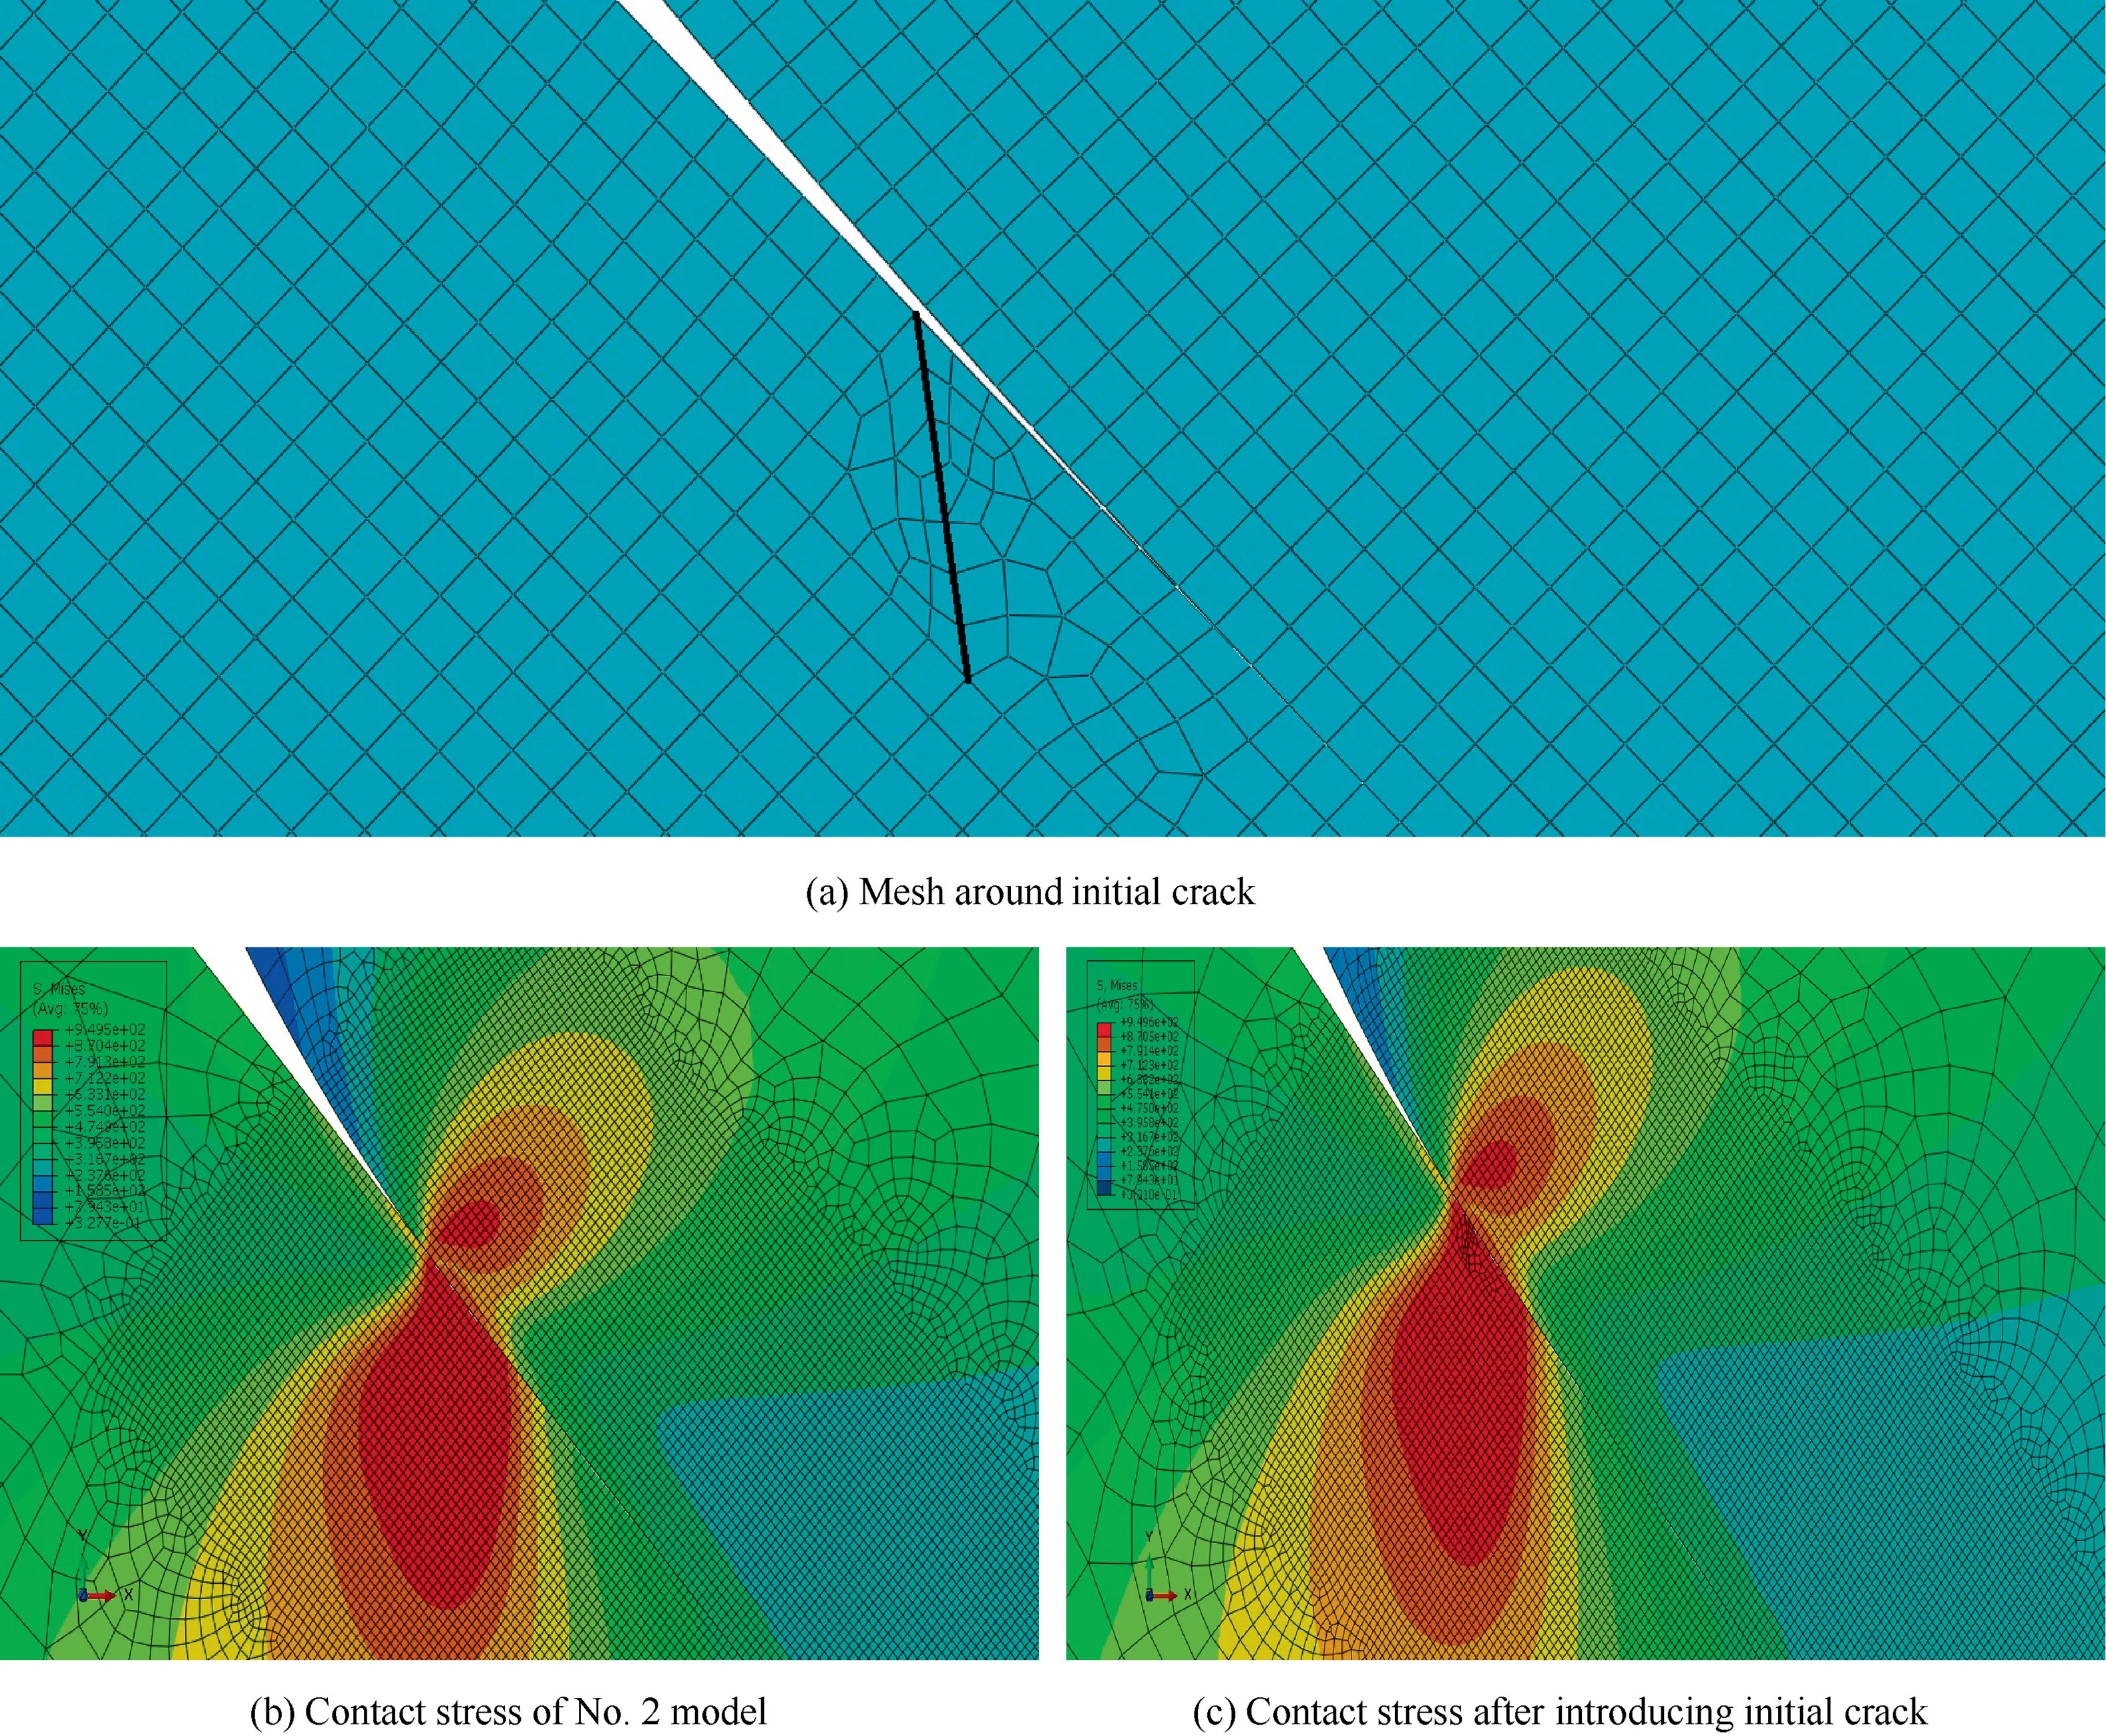
Fig. 8 Introduction of initial crack and contact stress.

Fig. 9 Node release technique.
It should be noted that after the crack grows out of the contact region, there is limited plasticity near the crack tip due to the moderate magnitude of loading. Therefore, the elasticity Stress Intensity Factor (SIF) is used as the crack growth driving force in both an elastic condition and the following elasticplastic case.
3.3. Introduction of crack closure and life prediction
3.3.1. Introduction of crack closure
The node release technique is used to simulate crack growth and determine the crack closure ratio as well. The simulation stops when the crack length reaches the critical value,380 μm, which is the typical length of an engineering visible crack.
The contact stress of the crack tip node during a cycle is analyzed to determine the crack opening and closure load: a positive contact stress indicates that the crack is open,the time when the contact stress changes from a negative value to a positive one is regarded as the crack opening time, and the corresponding load is the crack opening load Po;the same approach is used to determine the crack closure load Pc.
The variations of the elastic contact stresses of two representative crack lengths are shown in Fig. 13, and the crack lengths corresponding to node No. 1987 and node No. 2027 are 29 μm and 320 μm, respectively. In Fig. 13, a full cycle is 2 seconds, points A1, A2, F1, and F2represent the times of the minimum load amplitude, and points C1and C2represent the times of the maximum load amplitude.Observable changes of the slopes of contact stresses happen at time points B1, B2,D1,and D2.Crack closure occurs at time points E1and E2,and the crack opens again at time points F1and F2. As discussed before, the crack closure referred here is different from the commonly investigated PICC, which occurs only in plastic conditions of plain fatigue crack growth. However, in fretting fatigue,Fig.13 reveals that crack closure might occur even for elastic material models.
The variations of contact stresses shown in Fig. 13 can be explained by the changes of contact statuses between two contact pairs,i.e.,the blade/disk contact pairs and the crack faces contact pairs. The locations of nodes and regions are illustrated in Fig.14(a),of which the initial crack and crack growth path are highlighted in black lines.Node No.15 is the starting point of the initial crack,i.e.,point C in Fig.12,node No.1987 is the current crack tip node (a crack length of 29 μm), and region A refers to the left region of the crack while region B is the right region.

Fig. 10 Growth of initial crack.
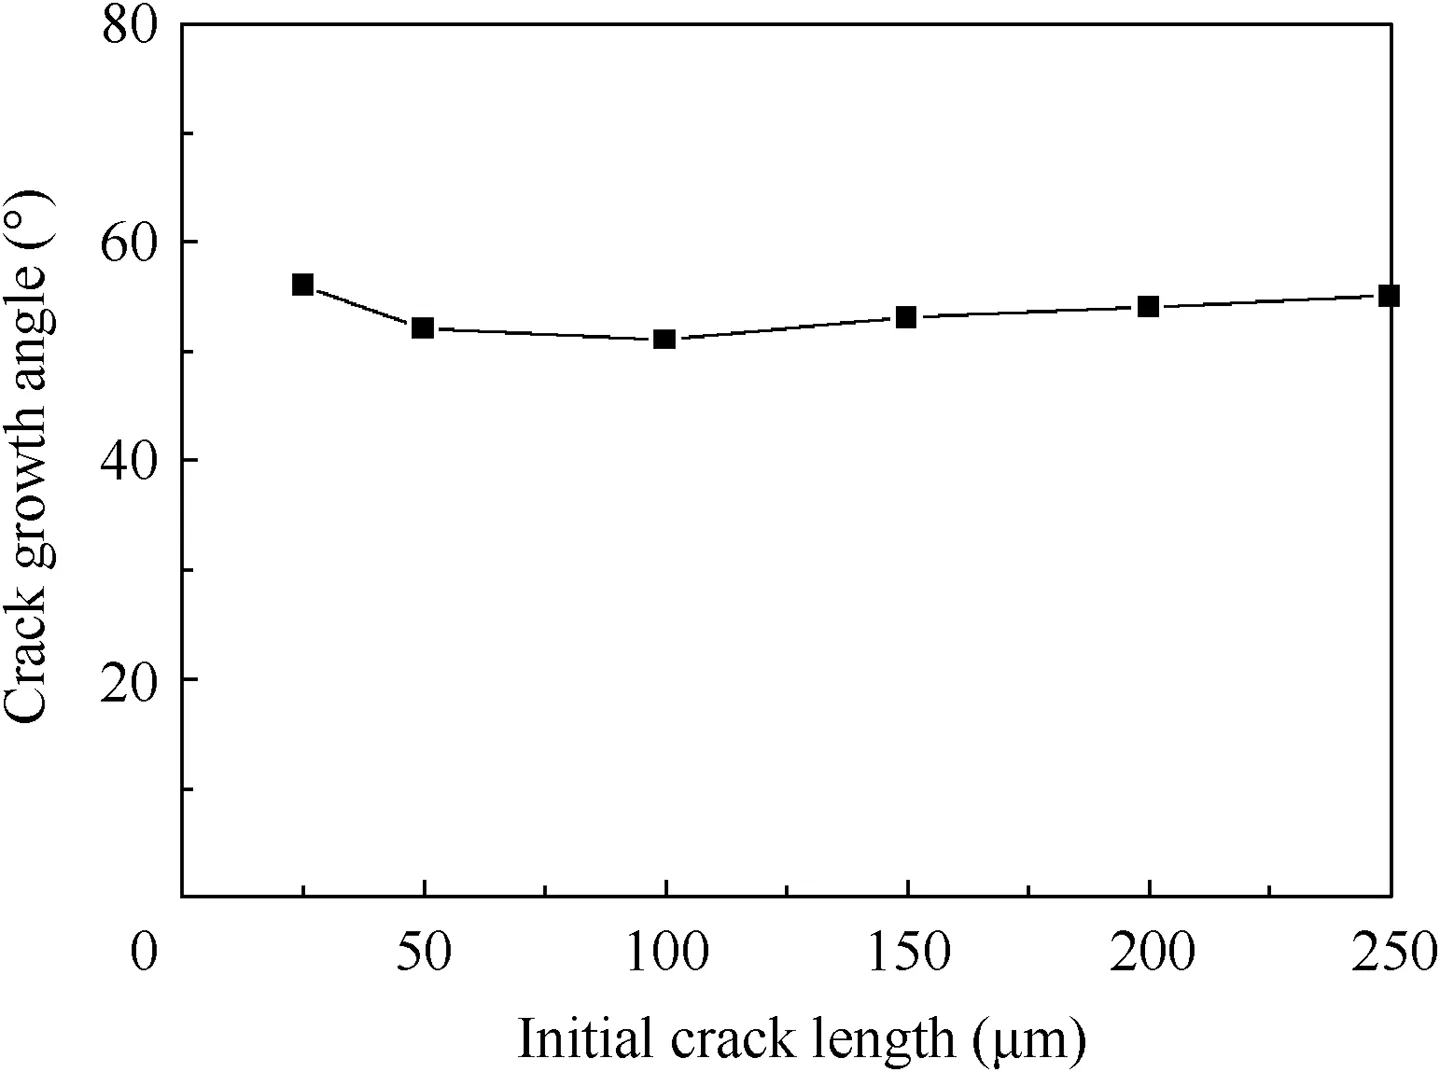
Fig. 11 Crack growth angles of different initial crack lengths.
The contact statuses of node No.1987 at different times are shown in Fig.14(b)-(e),where contact areas are highlighted in red lines. The deformation factors are set to 10 times.
(1) In Fig. 14(b), when the load is at its minimum amplitude, i.e., zero load, the crack is neither open or closed,in another word, the crack faces are in contact but with no contact stress, which corresponds to time points A1and F1in Fig. 13.
(2) When the load is getting higher, the contact area of the blade/disk contact pairs becomes larger, and node No.15 will begin contacting with the disk surface in Fig. 14(c), which results in the restraint of displacement of region A, and this restraint will lead to a decrease of the slope of the contact stress, as illustrated by time point B1in Fig. 13.
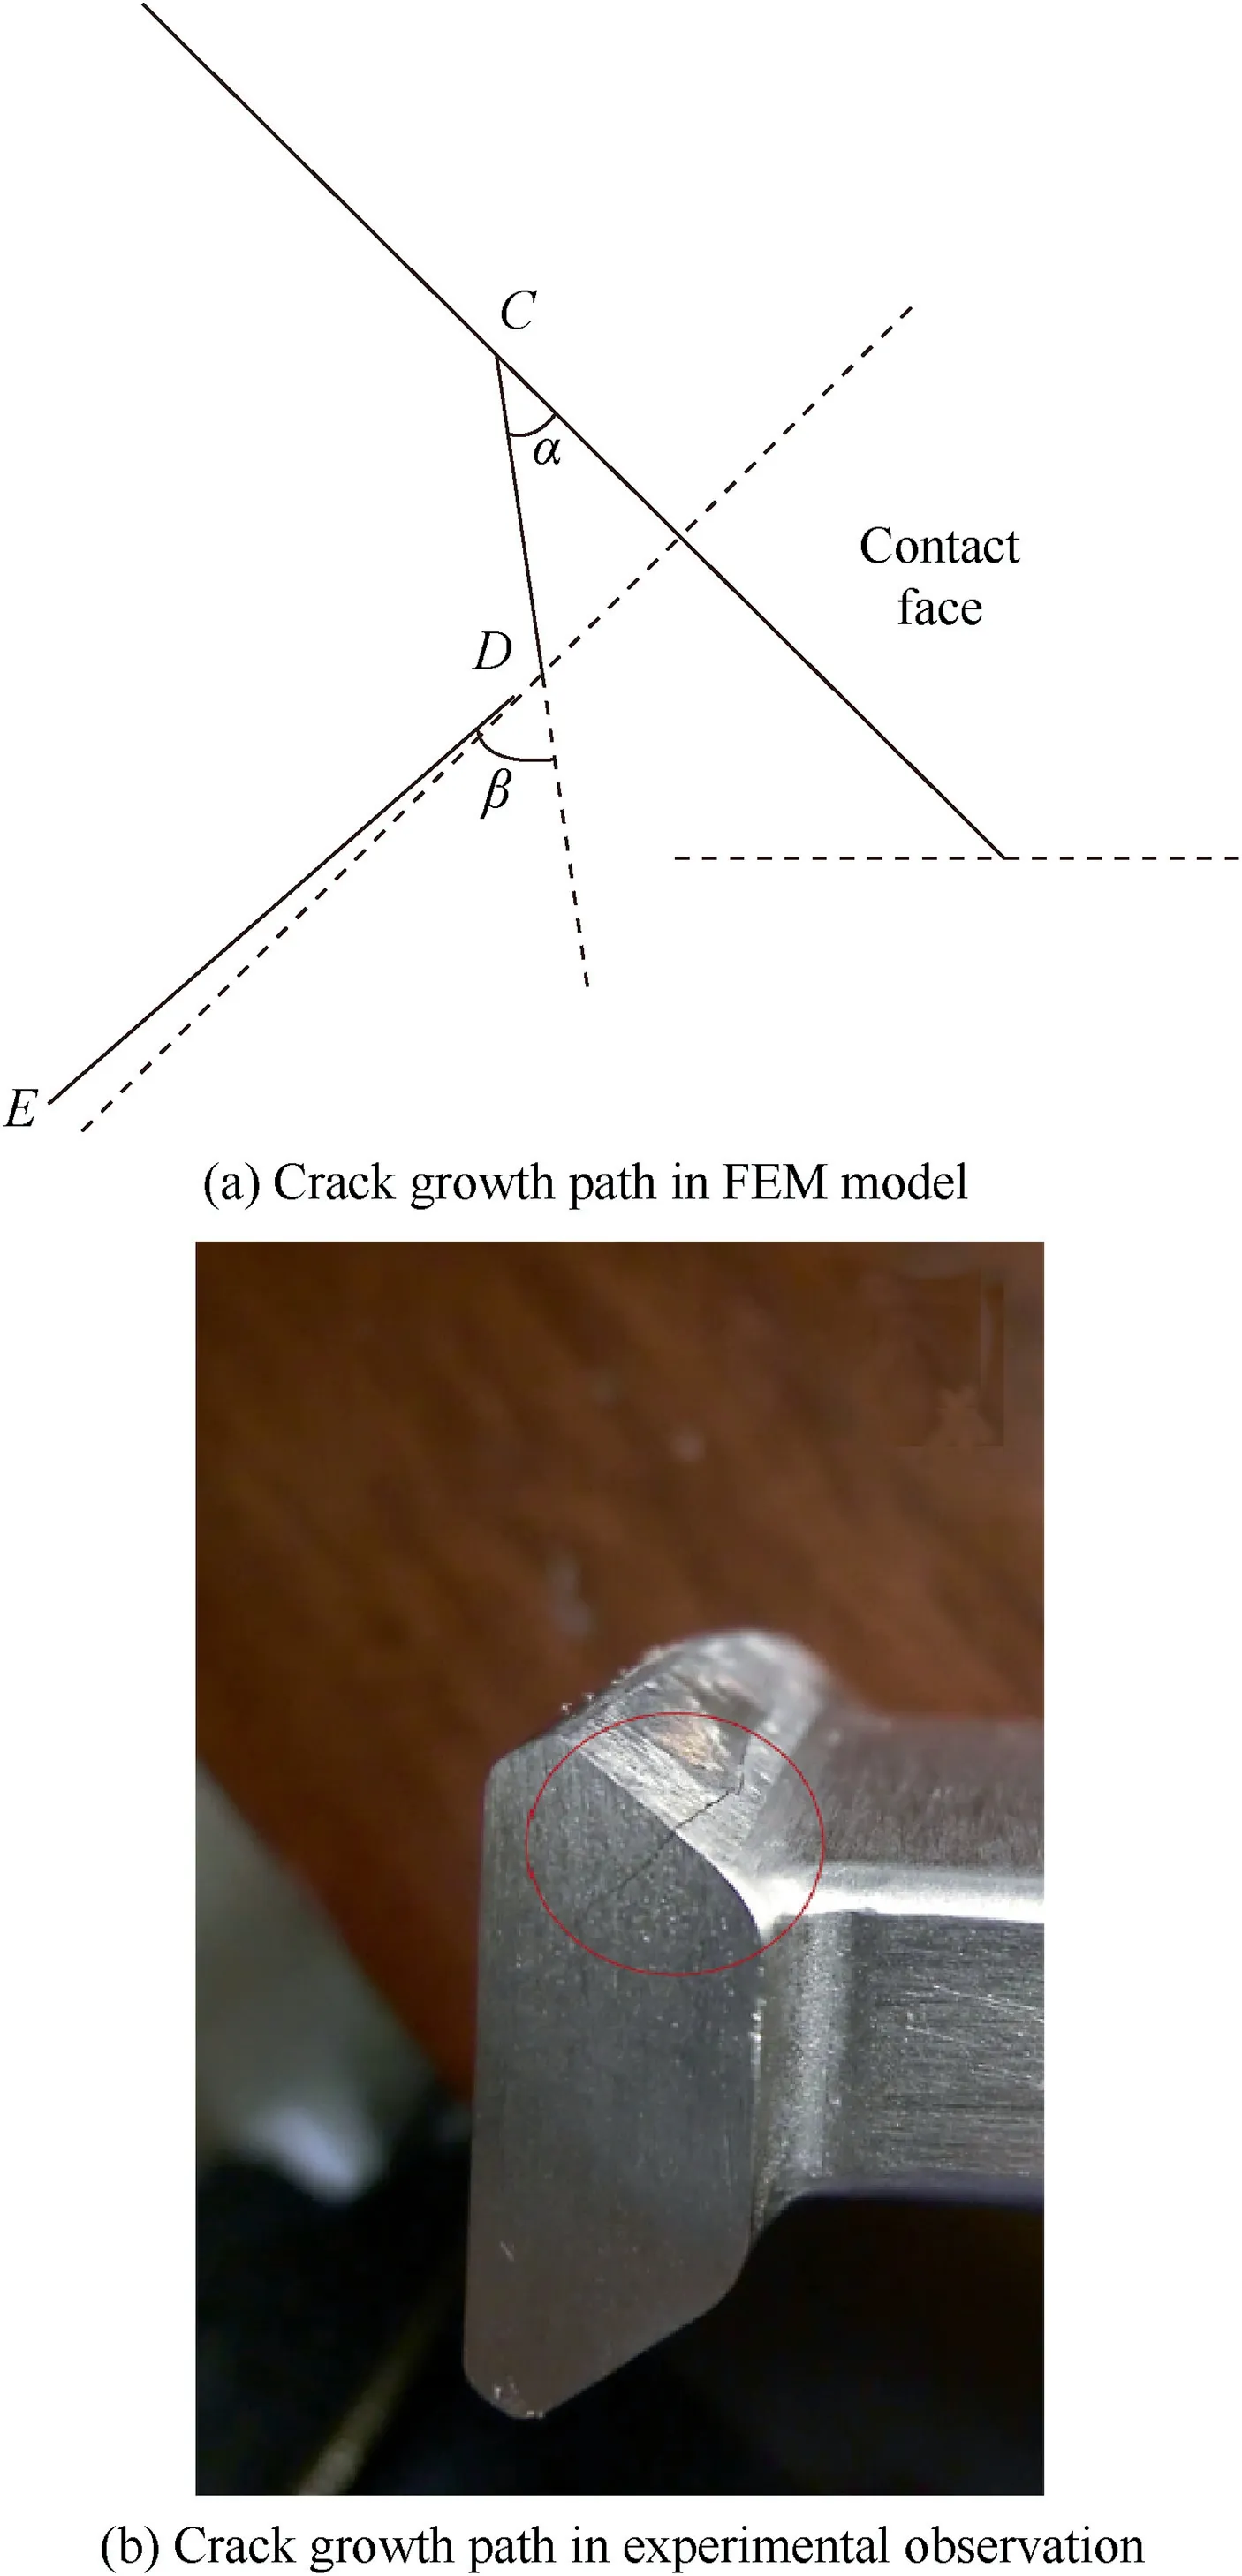
Fig. 12 Crack growth path in FE model and experiments.
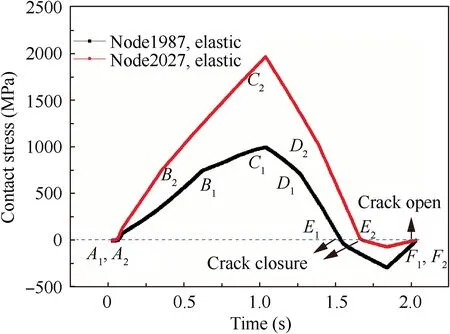
Fig. 13 Contact stresses calculated by elastic material model during a cyclic loading.
(3) In Fig.14(d),the load is at its maximum amplitude,and the crack is fully open.
(4) When the load becomes lower than that at time point D1in Fig.13,region A will be no longer in contact with the disk surface, and its displacement will be free from restraint,whereas region B will still be in contact,which will restrain its displacement during unloading. Therefore, crack closure occurs in Fig. 14(e), which corresponds to time point E1in Fig. 13.
It should be noted that the red square points along the contact surfaces and crack faces in Fig.14 indicate the variation of contact statuses from slipping to sticking. Besides, since the results of node No. 2027 show the same trend, they are not presented here.
For the elastic-plastic material model,crack closure can be observed as well and is more significant due to the additional plastic strain. The variations of the contact stresses of node No. 1987 and node No. 2027 calculated by the elastic-plastic material model are shown in Fig. 15.
The variations of contact stresses shown in Fig. 15 can be explained by the changes of contact statuses. The locations of nodes and regions are shown in Fig.14(a).The contact statuses of node No.1987 at different times are shown in Fig.16.The deformation factors are set to 10 times.
(1) In Fig. 16(a), when the load is at its minimum amplitude, i.e., zero load, the crack is closed, which corresponds to time points A1and G1in Fig. 15. Different from the elastic case illustrated in Figs. 13 and 14, the crack is closed at the minimum loading amplitude because of the plastic strain in the plastic wake zone,which is produced in former loading cycles.
(2) When the load is getting higher, the crack will open at time point E1as shown in Fig. 16(b).
(3) As the load continues increasing,the contact area of the blade/disk contact pairs will become larger,node No.15 will begin contacting at time point B1, and the slope of the contact stress will change as illustrated in Fig.16(c).
(4) In Fig.16(d),the load is at its maximum amplitude,and the crack is fully open.
(5) When the load magnitude becomes smaller than the value at time point D1in Fig.15,region A will no longer be in contact with the disk surface,whereas region B will still be in contact, which will restrain its displacement during unloading. Therefore, crack closure occurs in Fig.16(e),which corresponds to time point F1in Fig.15.
Similarly, the red square points along the contact surfaces and crack faces in Fig.16 indicate the variation of contact statuses from slipping to sticking, and the results of node No.2027 are not presented.
3.3.2. Life prediction
In the study of PICC, it is normally assumed that the crack opening load Pois close to the crack closure load Pc.However,in fretting-contact-induced crack closure, these two values are significantly different, as shown in Figs. 13 and 15. Therefore,the crack closure ratio U is taken to be the average of the normalized crack opening load and the crack closure load, which can be expressed as follows26:

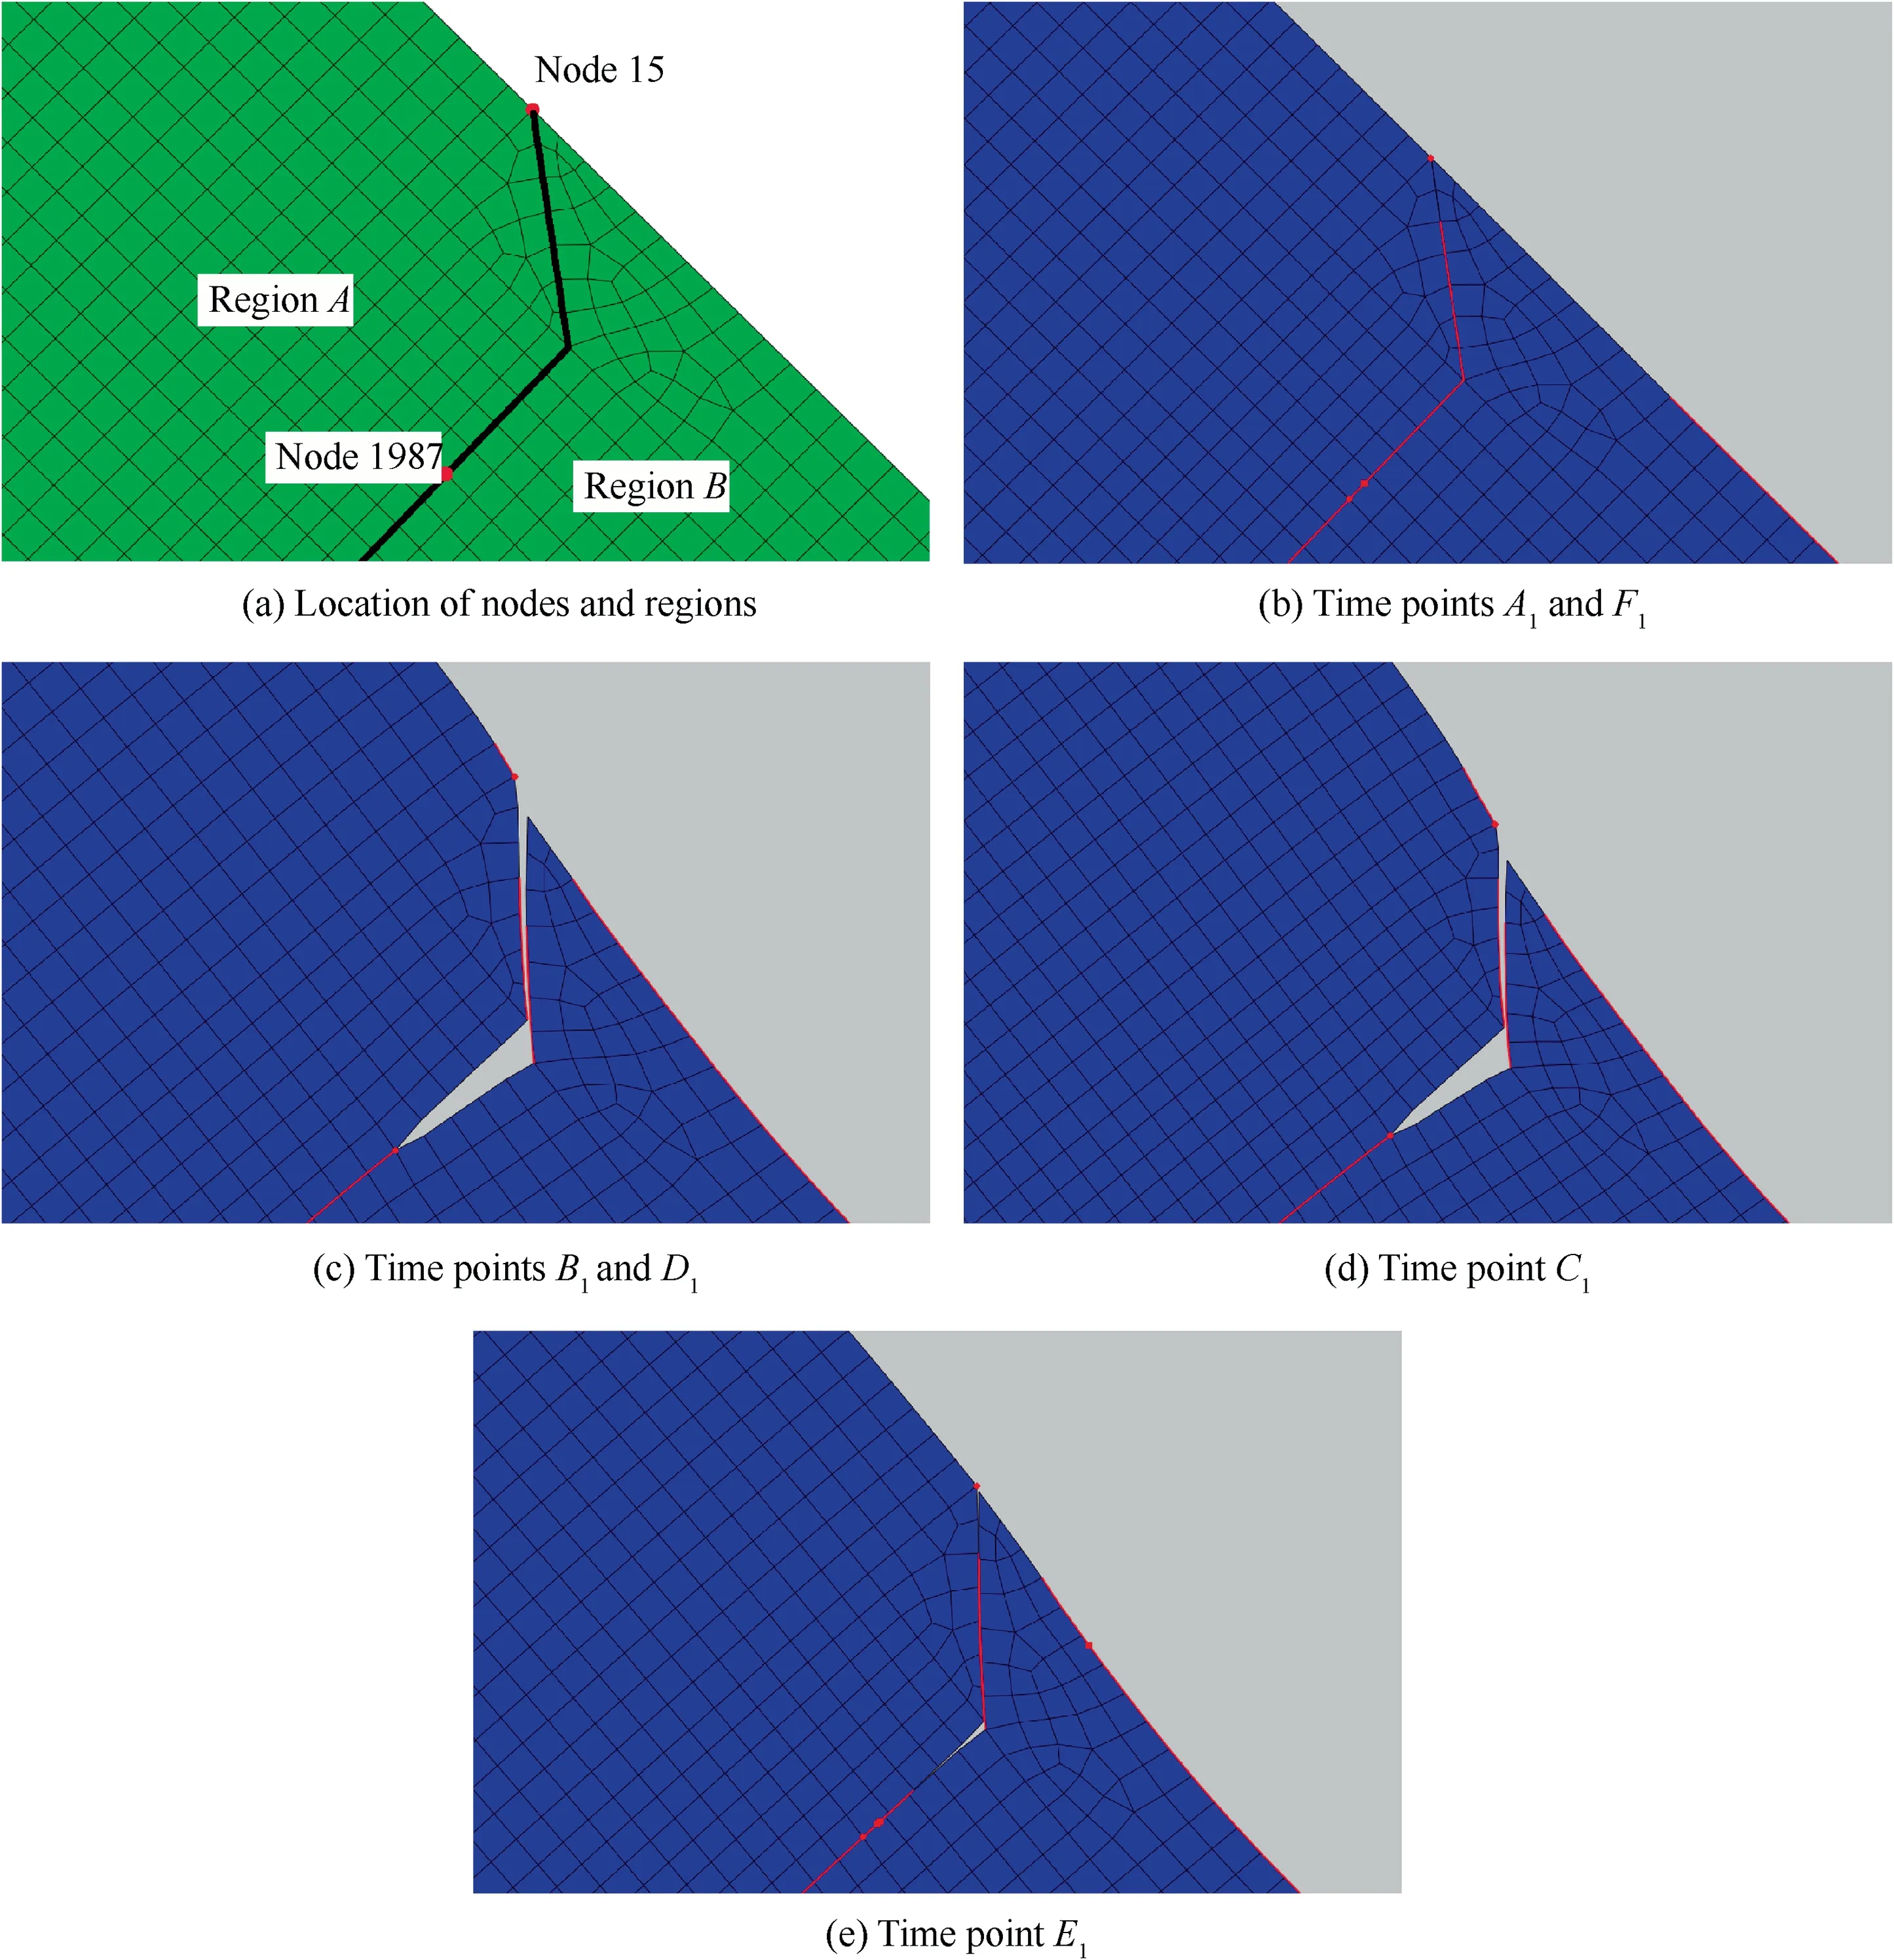
Fig. 14 Contact statuses calculated by elastic material model at different times.
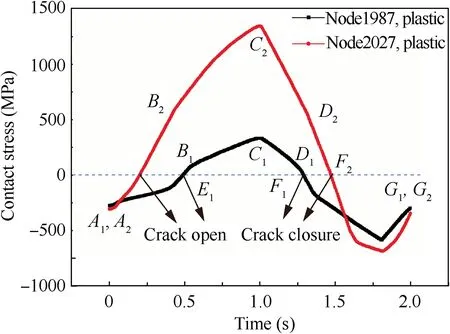
Fig. 15 Contact stresses calculated by elastic-plastic material model during a cyclic loading.
The variation of the crack closure ratio with the increase of the crack length is presented in Fig.17,which is used to represent the degree of crack closure.It shows that both elastic and plastic crack closure ratios decrease with an increase of the crack length,and this variation is reasonable because this kind of crack closure is mainly resulted from the displacement restraint induced by fretting contact. Therefore, when the crack grows out of the contact area,the displacement restraint will decrease or even disappear, the elastic crack closure ratio should become 0 as plain fatigue crack growth,and the plastic crack closure ratio can be regarded as the common PICC ratio.
The equations to calculate SIFs are expressed as

where ΔKmix,effis the effective range of mixed SIF, Kmix,maxis maximum mixed SIF and Kmix,opis the mixed SIF when the crack opens.

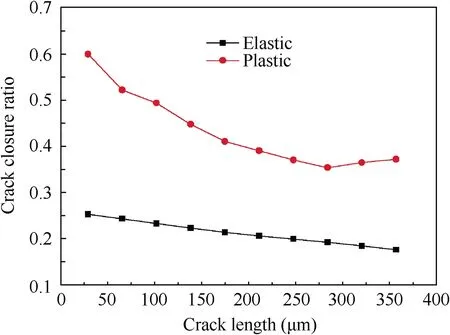
Fig. 17 Crack closure ratio.
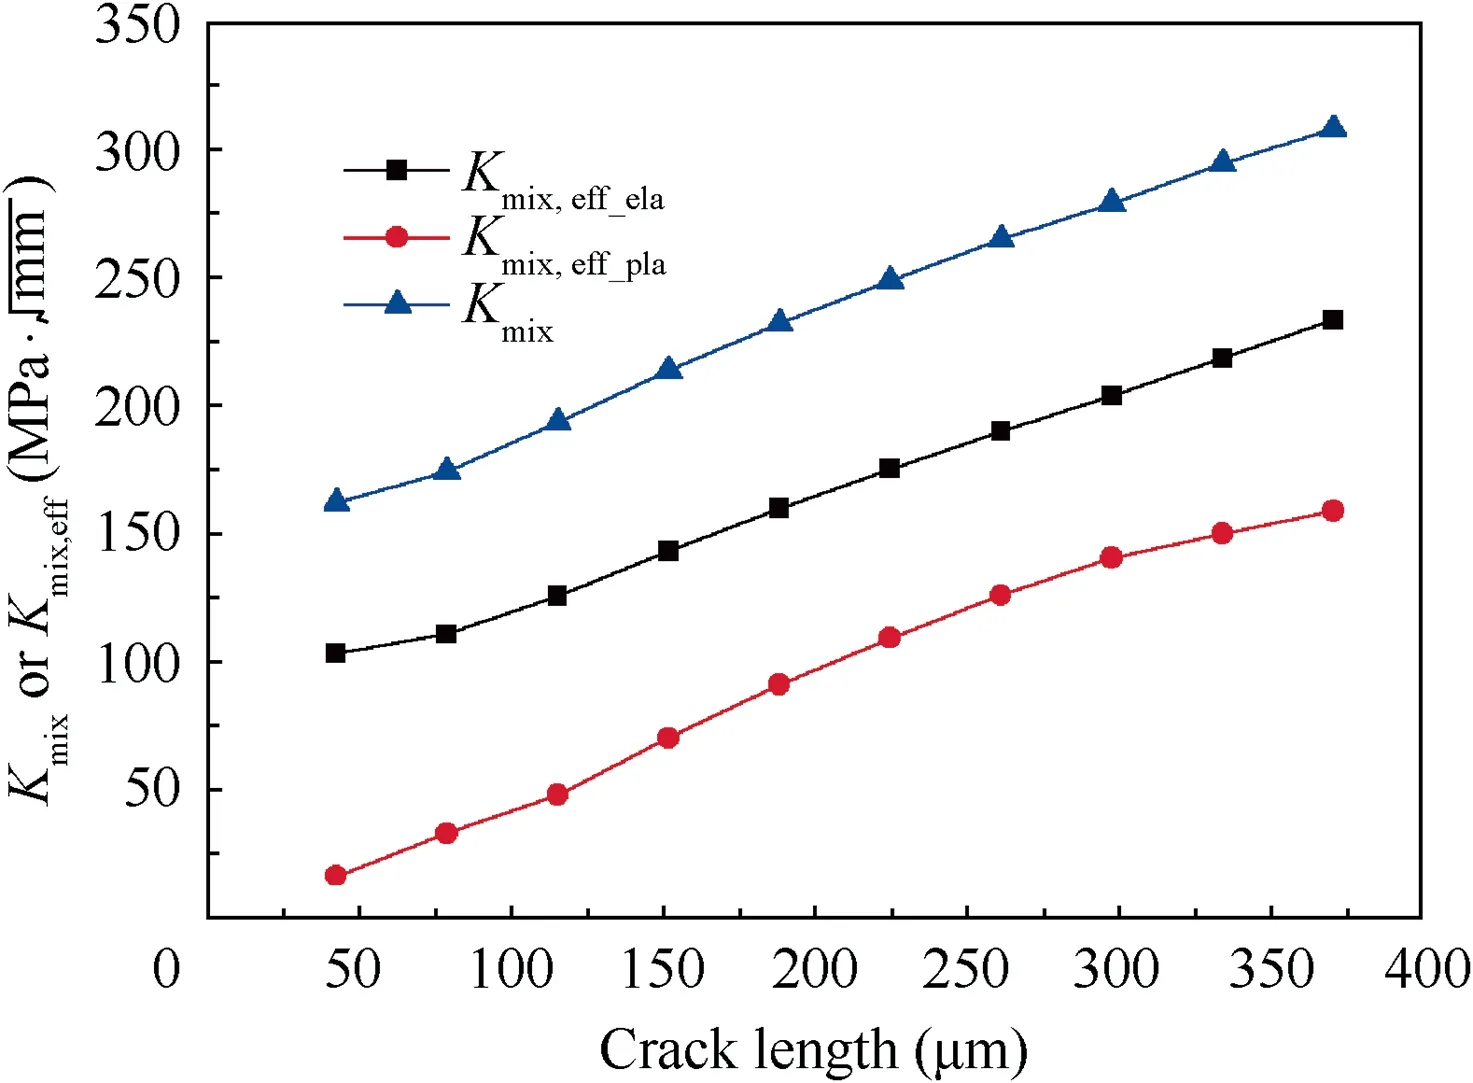
Fig. 18 SIFs vs. crack length.
Since the values of SIFs are beyond the Paris regime, the baseline data method is chosen to predict the crack growth life as recommended by Newman, which is more accurate in transitional regions.29It can be seen from Fig.18 that there shows considerable reduction in SIFs after the introduction of crack closure,and the predicted crack growth lives spent from crack lengths of 50 μm to 380 μm are:(A)14537 cycles without considering crack closure; (B) 52139 cycles considering elastic crack closure;(C)1043426 cycles considering plastic crack closure,therefore fretting-contact-induced crack closure will have a great influence on the crack growth rate and crack growth life, which has been proven in a previous publication.17
4. Conclusions
In this article, the FEM is used to investigate the fretting fatigue of a TC4 dovetail assembly. Some conclusions can be drawn:
(1) The elastic-plastic contact stress was calculated precisely, and the influence of the element size was studied.It showed that model No. 2 with an element size of 7.5 μm was sufficient to give converged contact stress.
(2) By using the critical plane parameter of the maximum shear stress range, the crack initiation location was determined at the fourth node in contact,and the corresponding angle was 53.5°. The crack growth angle was predicted by the MTS criterion, and the angle of the crack growth path with respect to the normal of the contact face was 1.5°, which agreed with experimental observation.
(3) The new kind of crack closure in the fretting attachment of both elastic and elastic-plastic material models was simulated, which demonstrated that crack closure occurred in both cases. Crack closure in fretting fatigue is mainly caused by the displacement restraint induced by contact, therefore crack closure will happen even for the elastic material model and alleviate as the crack grows away from the contact zone. Fretting-contactinduced crack closure has great influences on the crack growth rate and crack growth life.
Acknowledgement
The authors gratefully acknowledge the financial support from the National Natural Science Foundation of China (NSFC,No. 51475024).
 CHINESE JOURNAL OF AERONAUTICS2019年8期
- CHINESE JOURNAL OF AERONAUTICS的其它文章
- Special Column of BWB Civil Aircraft Technology
- Assessment on critical technologies for conceptual design of blended-wing-body civil aircraft
- Exploration and implementation of commonality valuation method in commercial aircraft family design
- Effects of stability margin and thrust specific fuel consumption constrains on multi-disciplinary optimization for blended-wing-body design
- Nacelle-airframe integration design method for blended-wing-body transport with podded engines
- On developing data-driven turbulence model for DG solution of RANS
