
Application of custom anatomy-based nerve conduits on rabbit sciatic nerve defects: in vitro and in vivo evaluations
2019-08-06 12:56:38YamuhanmodeAlikeMaimaiailiYushanAjimuKeremuAlimujiangAbulaitiZhenHuiLiuWeiFuLiWeiYanAihemaitijiangYusufuQingTangZhu
中国神经再生研究(英文版) 2019年12期
Yamuhanmode·Alike , Maimaiaili·Yushan , Ajimu·Keremu, Alimujiang·Abulaiti Zhen-Hui Liu Wei Fu Li-Wei Yan ,Aihemaitijiang·Yusufu , Qing-Tang Zhu ,
1 Department of Microrepair and Reconstruction, the First Affiliated Hospital of Xinjiang Medical University, Urumqi, Xinjiang Uygur Autonomous Region, China
2 Orthopedic Center, the First People's Hospital of Kashgar, Kashi, Xinjiang Uygur Autonomous Region, China
3 Department of Microsurgery and Orthopedic Trauma, the First Affiliated Hospital of Sun Yat-sen University, Guangzhou, Guangdong Province,China
4 Center for Peripheral Nerve Tissue Engineering and Technology Research, Guangzhou, Guangdong Province, China
5 Guangdong Province Engineering Laboratory for Soft Tissue Biofabrication, Guangzhou, Guangdong Province, China
AbstractThe intermingling of regenerated nerve fibers inside nerve grafts is the main reason for mismatched nerve fibers. This is one of the key factors affecting limb function recovery after nerve injury. Previous research has shown that the accuracy of axon regeneration can be improved by a bionic structural implant. To this aim, iodine and freeze-drying high-resolution micro-computed tomography was performed to visualize the 3D topography of the New Zealand rabbit sciatic nerve (25 mm). A series of 1-, 2-, 3-, and 4-custom anatomy-based nerve conduits (CANCs) were fabricated based on the anatomical structure of the nerve fascicle. The match index, luminal surface, and mechanical properties of CANCs were evaluated before implanting in a 10-mm gap of the sciatic nerve. Recovery was evaluated by histomorphometric analyses, electrophysiological study, gastrocnemius muscle weight recovery ratio, and behavioral assessments at 12 and 24 weeks postoperatively. The accuracy of nerve regeneration was determined by changes in fluorescence-labeled profile number during simultaneous retrograde tracing. Our results showed that the optimal preprocessing condition for high-resolution micro-computed tomography visualization was treatment of the sciatic nerve with 40% Lugol's solution for 3 days followed by lyophilization for 2 days. In vitro experiments demonstrated that the match index was highest in the 3-CANC group, followed by the 2-, 1-, and 4-CANC groups. The luminal surface was lowest in the 1-CANC group. Mechanical properties (transverse compressive and bending properties) were higher in the 3-and 4-CANC groups than in the 1-CANC group. In vivo experiments demonstrated that the recovery (morphology of regenerated fibers,compound muscle action potential, gastrocnemius muscle weight recovery ratio, pain-related autotomy behaviors, and range of motion) in Fabrication of custon anatomy-based nerve conduits (CANCs) and implantation into rabbits to repair injured sciatic nerve the 3-CANC group was superior to the other CANC groups, and achieved the same therapeutic effect as the autograft. The simultaneous retrograde tracing results showed that the percentages of double-labeled profiles of the 2-, 3-, and 4-CANC groups were comparatively lower than that of the 1-CANC group, which indicates that regenerated nerve fascicles were less intermingled in the 2-, 3-, and 4-CANC groups. These findings demonstrate that the visualization of the rabbit sciatic nerve can be achieved by iodine and freeze-drying high-resolution micro-computed tomography, and that this method can be used to design CANCs with different channels that are based on the anatomical structure of the nerve. Compared with the 1-CANC, 3-CANC had a higher match index and luminal surface, and improved the accuracy of nerve regeneration by limiting the intermingling of the regenerated fascicles. All procedures were approved by the Animal Care and Use Committee, Xinjiang Medical University, China on April 4, 2017 (ethics approval No. IACUC20170315-02).
Key Words: nerve regeneration; nerve conduits; mismatch; iodine and freeze-drying; high-resolution; micro-computed tomography; bio-mimic;custom; rabbit sciatic nerve; in vitro; in vivo; neural regeneration
Introduction
Peripheral nerve injury is a common clinical problem, and is often caused by severe injuries that result in a lesion in the nerve, such as open fracture with soft tissue defect (He et al., 2016; El Soury and Gambarotta, 2019). Autografts remain the clinical gold standard for the treatment of peripheral nerve injury, despite causing donor site morbidity and incomplete functional recovery (Safa and Buncke, 2016).Nerve conduits have been developed to bridge nerve gaps,and can be single-channel or matrix multi-channel. Unfortunately, none of the existing conduits are optimal for nerve regeneration due to the limited available surface for axonal growth and the inability to recreate natural anatomic structures (de Ruiter et al., 2008). Additionally, the pattern of fascicles is variable between individuals at different segments of its pathway (Natsis et al., 2018). Thus, custom-designed nerve conduits with a bionic anatomical structure are needed for individualized treatment. Although much research has focused on the bionic structures of nerve conduits, this remains a challenge due to inadequate information about nerve microstructure (Lee et al., 2016; Yeh et al., 2017; Wieringa et al., 2018).
High-resolution micro-computed tomography (HR micro-CT) has been used to obtain microstructural images of various tissues, especially in mineralized tissues such as bone and cartilage. However, the application of HR micro-CT is limited due to its lower contrast in soft tissue, particularly in nerve tissues (Li et al., 2015). To address this shortcoming, we developed a new pre-processing method-iodine and freeze-drying (IFD), which can enhance the contrast between nerve fascicles and connective tissue and reveal dynamic microstructures, including their distribution and aggregation topography (Yan et al., 2017a).
The objective of this study was to develop a series of customized anatomy-based nerve conduits (CANCs), to use these to bridge the gap in the rabbit sciatic nerve, and to evaluate the matched fascicle regeneration. To achieve this goal, we identified the optimal parameters for IFD HR micro-CT to accurately visualize the three-dimensional (3D)topography of the rabbit sciatic nerve. The suitability of the CANC was evaluated based on its mechanical properties.The conduits were then implanted in the rabbit sciatic nerve with a 10-mm gap and harvested at two time points to evaluate the accuracy of axon regeneration.
Materials and Methods
In vitro study Obtaining the 3D anatomical details of the rabbit sciatic nerve
Rabbit sciatic nerve specimens (n = 10) were provided by the Animal Experiment Center of Xinjiang Medical University, China [license No. SYXK (Xin) 2018-0003]. The nerve specimens (n = 5) were fixed in 4% paraformaldehyde at 4°C overnight. Then, 3-μm thick transverse paraffin-embedded sections were generated (n = 3; RM2125RTS; Leica, Wetzlar,Germany) and stained with hematoxylin and eosin. Each section was photographed under an optical microscope(DM3000B; Leica), and a series of TIFF image files were saved in a numerical sequence. For the micro-CT scanning,nerve specimens (n = 5, length = 5 cm) were divided into 5 groups (the nerve specimen in each group was cut evenly into 5 sections with a length of 1 cm), to determine the optimal concentration of Lugol's solution (Table 1). Briefly,nerves specimens were stained with Lugol's solution (0.5-1.0% potassium iodide and 0.25-0.5% iodine; 62650-100MLF; Sigma-Aldrich, St. Louis, MO, USA) for 3 days and lyophilized in a drying machine (LABCONCO, FreeZone 6 Plus, Labconco, MO, USA) before HR micro-CT (MicroCT 50 SCANCO Medical, Basserdorf, Switzerland) scanning, as described previously (Yan et al., 2017a). HR Micro-CT images were saved in DICOM format.

Table 1 Lugol's concentrations and micro-CT scanning parameters of the rabbit sciatic nerve specimens
In addition, to confirm the accuracy of the IFD HR micro-CT method, the macro changes of the nerve sample were analyzed based on changes in volume. The specimen was placed in a 1-mL measuring cylinder filled with 0.5 mL of water, and the final volume was recorded. The nerves specimens were stained with Lugol's solution for 3 days and measured once a day.
Design and preparation of CANC molds
Image files from ten sciatic nerves were obtained using the IFD HR micro-CT under the optimal preprocessing condition and imported into the Mimics software system (Mimics v17.0.0.435, Materialise, Belgium) to generate 3D images.The nerve fascicles were counted, and their distribution and aggregation were observed on sagittal, coronal, and vertical planes. In this study, the CANC was designed to repair a 10-mm defect in the rabbit sciatic nerve (the middle portion). The conduits were produced using anatomical details including the fascicular number, sizes, and position, in combination with IFD HR micro-CT image files obtained from ten nerve specimens and hematoxylin-eosin-stained sections from five nerve specimens. Several independent channel(s) of CANCs were designed to match fascicles using computer-aided design software. The multiple nerve fascicles were merged into one channel if the cross-sectional area of a single fascicle was < 0.03 μm2and/or the distance to adjacent fascicles was < 0.02 μm. The match index (MI)was calculated according to the following formula: MI =(A1+…+An)/SA, where n represents the number of the channel, SArepresents the total cross-sectional area of the sciatic nerve, and Anrepresents the cross-sectional area of the nerve fascicles in the Nth channel. The CANC molds, which consisted of a cylindrical sheath and cylindrical molds, were generated by a 3D printer (SP-DP20; SprintRay Inc., Los Angeles, CA, USA).
CANC fabricationThe fabrication of the CA
NCs involved a casting step and a coating step (Figure 1). In the casting step, a 15% (w/v)gelatin solution (Sigma-Aldrich) was prepared with distilled water at room temperature. The gelatin nerve conduit with pre-designed channels was fabricated by pouring the gelatin solution into the CANC mold and then inserting wires.After being frozen at -80°C for 10 minutes, the cylindrical molds were removed and the gelatin nerve conduit was crosslinked with 12 mM 1-ethyl-3-(3-dimethylaminopropyl)carbodiimide in 6 mM N-hydroxysuccinimide. The gelatin nerve conduit was rinsed three times with distilled water and subjected to continuous lyophilization at -30°C at 0.05 MPa for 12 hours.
In the coating step, poly(lactic-co-glycolic acid) (PLGA,75/25, Mn= 1.22 × 10⁵; Sigma-Aldrich) was dissolved in dichloromethane and magnetically stirred at room temperature overnight. The final CANC was produced by coating PLGA onto the whole longitudinal surface of the gelatin nerve conduit with 2 mm lips at each end, using an electrospinning machine followed by drying under vacuum at 40°C for 3 days.
Characterization of the conduits
Morphological observations: The length, cross-sectional length, short axis, and inner diameters of all channels of the CANC were observed under a stereoscopic microscope(LMS-Z200; Thermo Fisher Scientific, San Jose, CA, USA).A scanning electron microscope (LEO1430VP, Carl Zeiss,Oberkochen, Germany) was used to measure the pore size of the gelatin nerve conduit, the thickness of the PLGA membrane, and the fiber diameter.
Mechanical properties: The gelatin nerve conduit (~10 mm long, n = 5) was placed in phosphate buffered solution at 37°C overnight prior to testing. The resistance of the conduits was assessed using a uniaxial test machine (ELF 3200; Bose ElectroForce; Bose Corp., Eden Prairie, MN, USA). The pressure was loaded on the long axis of the conduit in a perpendicular direction at a rate of 1 mm/minute. Force-displacement curves were plotted by measuring the compressional displacement (d) and force resistance (F) of the conduits.
A dynamic analyzer (DMA Q800, TA instrument) was used for the three-point bending test. Young's modulus was determined by placing a 15 mm-long gelatin nerve conduit on two points 10 mm apart. An increasing load was applied on the midpoint of the gelatin nerve conduit (n = 5). The bending stiffness (EI) was calculated using the following equation: EI = (F/d)(L3/48), where (F/d) was determined by a linear regression from the initial portion of the F-d curve.
During the tensile test, a 10 mm-wide PLGA membrane (n = 3) was placed between thumb screw clamps (50 mm apart). The pulling rate was 20 mm/min. The tensile strength was calculated based on the initial linear portion of the force-displacement curve plotted as a linear regression,and the maximum tensile strengths and displacements were recorded.
In vivo study Animal procedures and experimental group
Fifty-five male and female New Zealand white rabbits aged 1 year and weighing 3.0-3.5 kg were obtained from the Animal Experiment Center of Xinjiang Medical University, China (license No. SYXK (Xin) 2018-0003). Rabbits were randomly divided into five groups in the first (n = 6) and second(n = 5) sets of experiments, as follows: autograft, 1-channel,2-channel, 3-channel and 4-channel CANC groups. All animal procedures were approved by the Animal Care and Use Committee, Xinjiang Medical University, China (ethics approval No. IACUC20170315-02) on April 4, 2017, in accordance with the NIH Guide for the Care and Use of Laboratory Animals (NIH Publication No. 80-23, revised 1996). The animal housing facility was accredited by the Association for Assessment and Accreditation of Laboratory Animal Care.
The rabbits were anesthetized via subcutaneous injection of Zoletil 50 (0.2 mL/kg; Virbac Laboratories, Carros,France) into the back of the neck. The right sciatic nerve was exposed and isolated at the mid-thigh level using a dorsal-lateral approach. A 10-mm length of sciatic nerve was resected 0.5 cm proximal to the bifurcation of the nerve into the tibial and peroneal nerve branches, and the CANC or an autograft (the nerve was cut and inversely implanted) was implanted with 7/0 monofilament nylon epineurial sutures.The wound was closed in layers.
The first set of experiments included an electrophysiological study, gastrocnemius muscle weight recovery ratio calculation, histomorphometric analysis, and behavioral assessment. The second set of experiments included simultaneous retrograde tracing, autotomy behavioral assessment,and dynamic motion behavior.
Electrophysiological study
The electrophysiological study was performed at 12 and 24 weeks after implantation. A bipolar stimulating electrode was placed under the sciatic nerve at 20 mm proximal to the graft site, and a recording electrode was placed in the gastrocnemius muscle. The compound muscle action potential(CMAP) was recorded with an electromyography machine(Medtronic Keypoint 4, Dantec, Denmark). The peak amplitudes of the CMAPs were recorded. The recovery index of CMAP amplitude was calculated as the CMAP of the experimental leg/the CMAP of the contralateral leg.
Gastrocnemius muscle weight recovery ratio
After the electrophysiological study, the gastrocnemius muscles on each side of the legs were harvested and weighed. The gastrocnemius muscle weight recovery ratio was calculated as the weight of the experimental leg/the weight of the contralateral leg.
Histomorphometric analysis
The sciatic nerve including the implanted conduit was resected. Samples were cut into 1-μm and 50-nm sections for toluidine blue staining and transmission electron microscopy (H-600 Electron Microscope, Hitachi, Japan) observation,respectively. Regeneration was defined as the presence of myelinated axons in the middle portion of the nerve conduit.Five fields of each slice, including the top, bottom, right, left,and the center, were captured. The number, density, mean diameter of myelinated fibers, and the mean thickness of the myelin sheath were analyzed using Image-Pro Plus 4.5 soft-ware (Media Cybernetics, Silver Spring, MD, USA).
Behavioral assessment
To evaluate pain-related behavioral changes, the occurrence and severity of autotomy behaviors were observed every week until 10 weeks after implantation. Autotomy behaviors were classified according to an autotomy grading scale (Park et al., 2015) (Table 2).
To assess the motor recovery of the limbs at 24 weeks after implantation, videos were continuously captured to record the dynamic motion behavior (jumping) after surgery, and the video recordings were analyzed using the MATLAB software 2015a (MathWorks, Inc., Natick, MA, USA), as previously reported (Hsu et al., 2011). The vector OA (point O to point A) was defined as that horizontal to the ground in the first frame. Another vector, OB (point O to point B), was defined as the central axis of the lower limb. The angle, AOB,between the two vectors (OA and OB) was continuously measured during a complete cycle of jumping movement.The Q-value represents the absolute angular difference in the maximum and minimum ranges of motion during one cycle,and a higher Q-value indicates a better motor recovery.
Simultaneous retrograde tracing
To determine the accuracy of motor axon regeneration across the implant, all animals in the second experimental set were anesthetized for simultaneous retrograde tracing 24 weeks postoperatively. First, the tibial nerve and peroneal nerve were transected and the proximal stumps were placed in a cup with 5% fast blue (Polysciences, Warrington,PA, USA) solution and 5% nuclear yellow (AAT Bioquest,Sunnyvale, CA, USA) solution for 20 minutes, respectively.To prevent tracer cross-contamination, the stumps were individually sutured into subcutaneous tissue. The spinal cord was resected 6 days after tracer application. Spinal cord segments from L1 to L6 were cut into 30 μm-thick sagittal longitudinal frozen sections and immediately observed under a fluorescent microscope (DM3000B; Leica, Nussloch, Germany). Fast blue labeled the cytoplasm and nuclear yellow labeled the neuron nucleus, which resulted in three profiles(fast-blue labeled neurons, nuclear yellow-labeled neurons,and neurons labeled with both fast blue and nuclear yellow)The neuron profiles in all sections were counted.
Statistical analysis
The data are expressed as the mean ± SD and were analyzed using a one-way analysis of variance followed by Bonferroni post hoc tests. All statistical analyses were conducted using SPSS version 21.0 (IBM, Armonk, NY, USA). P-values < 0.05 were considered statistically significant.
Results
The optimal preprocessing condition for HR micro-CT visualization (in vitro)
HR micro-CT was applied to obtain a total of 850 (30 μm/pixel) images from the middle segment of each rabbit sciatic nerve (length = 25 mm) and the optimal preprocessing condition was identified for the HR micro-CT visualization region of interest (fascicles compared with connective tissue). Sample pre-processing using 40% Lugol's solution with the freeze-drying method had little impact on the macro changes, and the micro-CT scanning parameters (45 kVp energy, 72 μA intensity, 1600 projections) and a 4,000,000 μs sample time yielded optimal images of the fascicle (Figure 2).
Customized designing of the CANC (in vitro)
The aggregation and distribution of nerve fascicles were further analyzed by a 3 μm × 3 μm × 3 μm voxel size scan method. No obvious aggregation or distribution between fascicles was observed (length = 15 mm). Based on these findings, a series of CANCs (length = 10 mm) were designed and fabricated (Figure 3). The number, diameter, and position of channel(s) were different in 1-, 2-, 3-, and 4-CANC groups.For example, 4-CANC group contained 4 anatomy-base channels. The position and size are shown in Figure 3. The total cross-sectional areas of the 1-, 2-, 3-, and 4-CANC were 2.27, 2.18, 2.21, and 2.18 (mm3), respectively. The highest MI was 84.4% in the 3-CANC group, while the lowest MI was 51.4% in the 4-CANC group (Table 3).
Morphological observations of the CANCs (in vitro)
The CANCs were observed under a stereoscopic microscope(Figure 4A). The length of the gelatin nerve conduit was 10 mm, with 2 mm PLGA membrane lips at both ends. The thickness of the PLGA membrane was 440 to 510 μm with evenly distributed nanofibers. The diameter of the nanofibers ranged from 150 to 400 nm (average, 290 nm). The scanning electron microscope showed that the gelatin nerve conduit had an interconnected porous structure. The sizes of the pores on the gelatin nerve conduit ranged from 30 to 50 μm(Figure 4B).
Mec hanical properties of the CANCs (in vitro)
The compression and three-point bending tests were performed (Figure 5A and D). In the compression test, compressive load-displacement data for all types of conduits showed a typical “J”-type stress-strain curve. The transverse compressive force of the 4-CANC was significantly higher than that of the 2-CANC (P < 0.05, F = 40.70; Figure 5B and C). In the bending test, all conduits returned to their original shape when the bending deformation was < 1 mm. The bending stiffness of the 4-CANC was significantly higher than that of the 3-CANC and 2-CANC (P < 0.05, F = 64.02;Figure 5E and F). In the tensile test, the maximum length of the PLGA membranes was 16.24 ± 4.191 mm, and the tensile strength was 6.0916 ± 0.4723 MPa.
Changes of the electrophysiological index and gastrocnemius muscle weight recovery ratio in each group(in vivo)
Electrophysiological studies were conducted at 12 and 24 weeks postoperatively. At 12 weeks, the mean CMAP of the autograft group was significantly higher than in the CANC groups (P < 0.05, F = 24.84). At 24 weeks, the mean CMAPs of the 2- and 3-CANC groups were significantly higher than those seen in the 1- and 4-CANC groups (P < 0.05, F= 31.23), but lower than that of the autograft group (Figure 6A). Obvious atrophy of the gastrocnemius muscle was seen in all groups, and there were no significant between-group differences in the gastrocnemius muscle weight recovery ratio at 12 weeks. Among the CANC groups, the 3-CANC group achieved a significantly higher weight recovery ratio compared with the 1-CANC group at 24 weeks (Figure 6B).
Morphology of myelinated nerve fiber at 24 weeks in each group (in vivo)
Regeneration was seen in all CANC groups at 12 and 24 weeks. At 24 weeks, the mean number of myelinated fibers in the autograft group was noticeably higher than that seen in the CANC groups. However, the number and mean density of myelinated fibers were not significantly different among the CANC groups. The myelinated fiber diameters in the 2-and 3-CANC groups were significantly higher than those seen in the 1- and 4-CANC groups (P < 0.05, F = 18.26), but lower than that of the autograft group (P < 0.01, F = 88.81).The analysis of myelination thickness revealed a similar result (Figure 7).
Pain-related autotomy behavior assessment and dynamic behavior analysis (in vivo)
Grade 3 autotomy was common in the 1- and 4-CANC groups, and the earliest grade 3 autotomy was observed in the 4-CANC group at 3 weeks. In contrast, grade 1 or 2 autotomy was commonly seen in the 2- and 3-CANC groups.Autotomy was less common in the autograft group, and only two animals presented with grade 3 autotomy until the end of the observation period (Figure 8).
A map of the motion angle versus time was obtained from video image frames (Figure 9A). The variation of AOB was constantly recorded during a complete swing cycle (Figure 9B). The range of motion (Q) of the contralateral limb was 70.82 ± 3.47° (Figure 9C). At 12 weeks, none of the ex-perimental rabbits could complete a swing cycle. The first complete cycle was observed in the autograft group at 14 weeks. At 24 weeks, all experimental animals were able to complete a whole cycle. The range of motion in the 3-CANC group (Figure 9D) was significantly higher than that of the 1-CANC group, but lower than that of the autograft group (P< 0.05, F = 13.02; Figure 9E).

Figure 1 Fabrication of the CANC, including casting and coating step.The casting step of the GNC involved removal of the cylindrical molds lyophilization and crosslinking. The coating step involved coating PLGA onto the whole longitudinal surface of the GNC with 2 mm lips at each end using an electrospinning machine. CANC: Custom anatomy-based nerve conduit; GNC: gelatin nerve conduit; PLGA: poly(lactic-co-glycolic acid).

Figure 2 Macro changes of pre-processed micro-CT scanning samples treated with 40% Lugol's solution.Lugol's solution staining for 1 day; (B) Lugol's solution staining for 2 days; (C) Lugol's solution staining for 3 days; (D) freeze-dried nerve sample. (E-G) Micro-CT coronal images and the endoneurium structure of samples. Scale bars: 150 μm. (H)The nerve volume changes for each step over time. Micro-CT: Micro-computed tomography; IFD: iodine and freeze-drying.
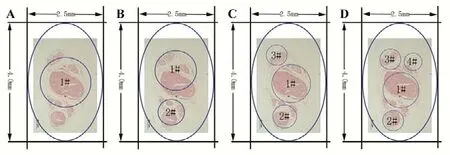
Figure 3 Designing of the CANC using computer-aided design software (Adobe Photoshop CS6, San Jose, CA, USA).(A-D) Designing of 1-, 2-, 3-, and 4-CANC, respectively. The position and diameter of the 1#, 2#, 3#, and 4# channels in the CANCs were determined according to the distribution of the main nerve fascicle. The long and short axes of the outer diameter of the nerve conduit were 4 mm and 2.5 mm, respectively. CANC: Custom anatomy-based nerve conduit.
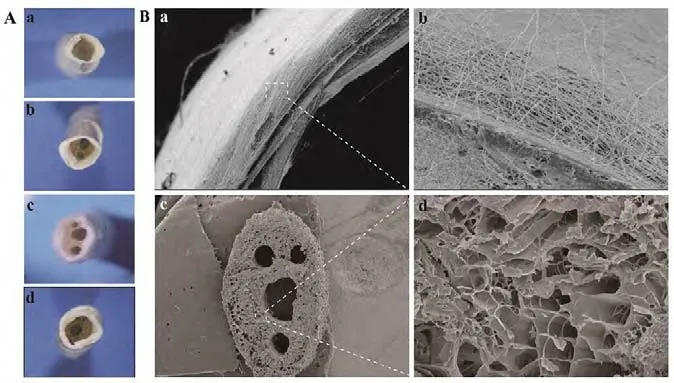
Figure 4 Morphological observations of the CANCs in each group.(A) Morphology of the 1-, 2-, 3- and 4-CANC observed under a stereoscopic microscope (original magnification, 5×). (B) Scanning electron microscope observations of the PLGA membrane: (a) the thickness of the membrane was about 300 μm (original magnification, 140×); (b)the PLGA nanofibers, with a diameter that ranged from 150-400 μm,were uniformly distributed (original magnification, 500×); (c) The 4-CANC observed under a scanning electron microscope (original magnification, 20×); (d) the diameter of the pores ranged from 30-50 μm (original magnification, 200×). CANC: Custom anatomy-based nerve conduit; PLGA: poly(lactic-co-glycolic acid).
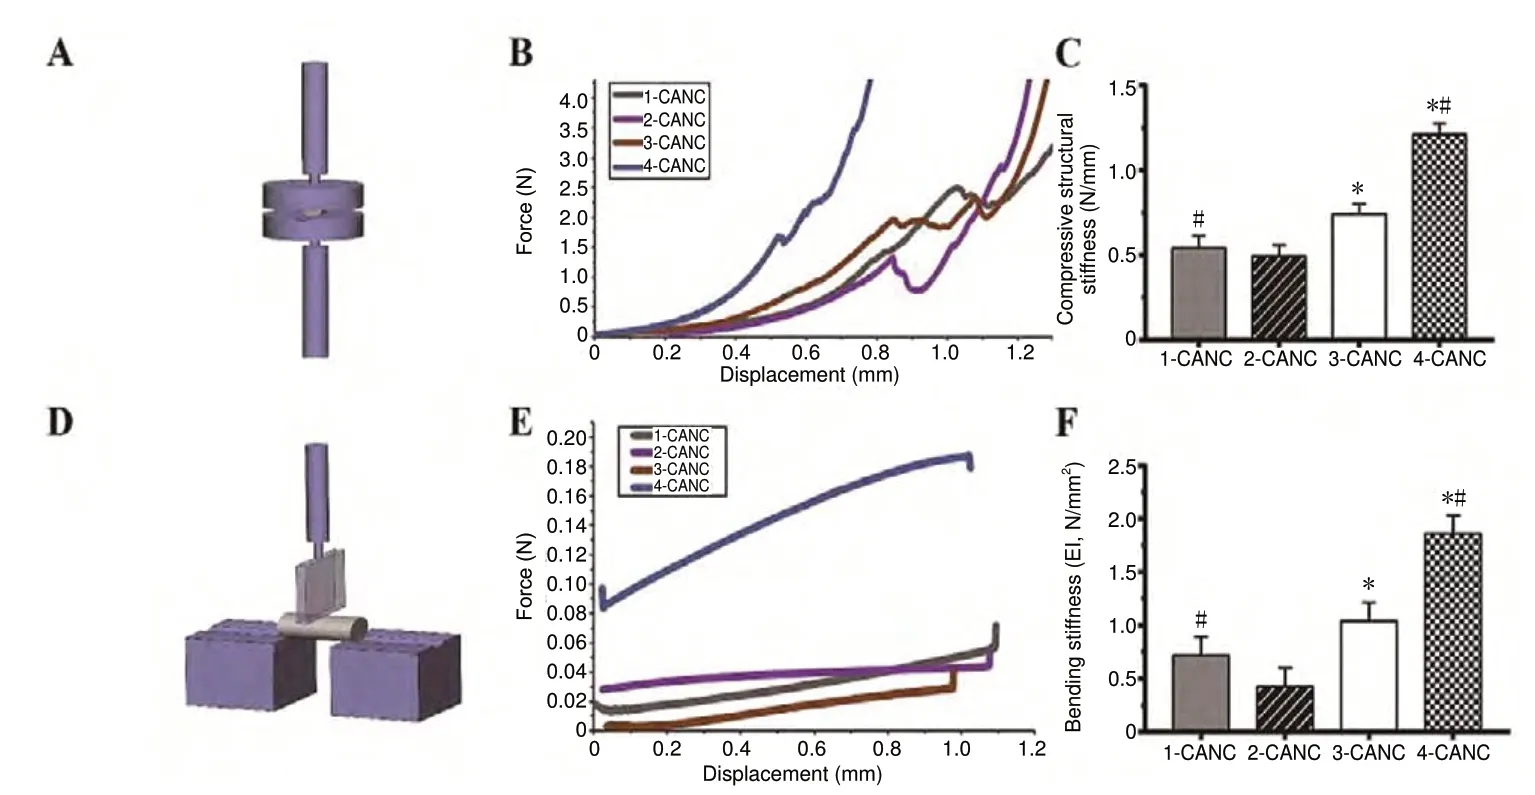
Figure 5 Mechanical properties ofthe CANCs.(A, D) Schematic diagram of the compressive mechanical property test and three-point bending test.(B, E) Force-displacement curve of the transverse compression test and bending test for the four CANCs. (C,F) Compressive structural stiffness and the bending stiffness of the four CANCs. Data are expressed as the mean ± SEM (n = 5; one-way analysis of variance followed by Bonferroni post hoc tests). *P < 0.05, vs. 2-CANC;#P < 0.05, vs. 3-CANC. CANC: Custom anatomy-based nerve conduit.
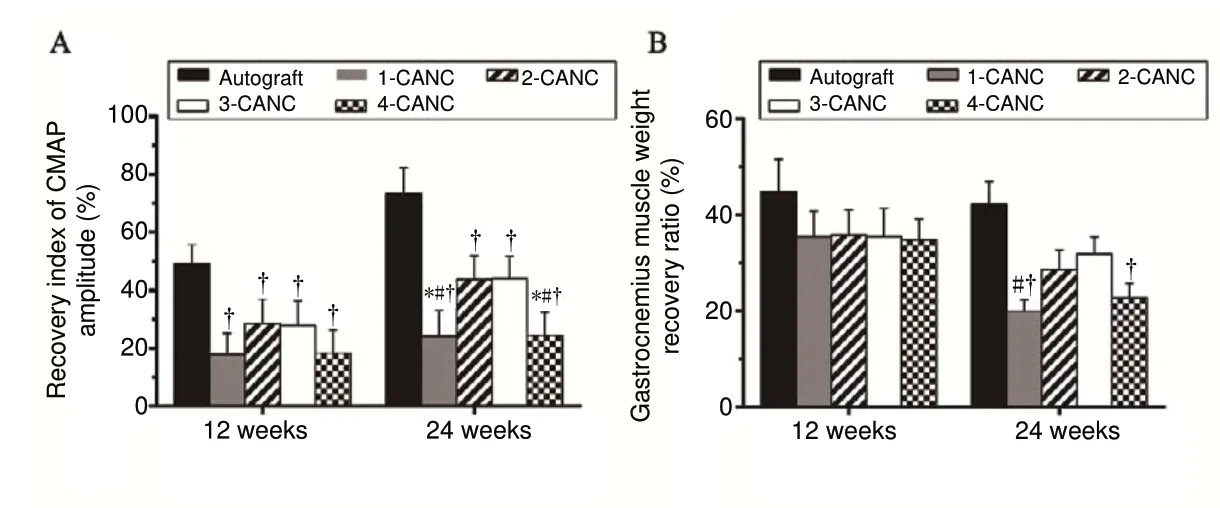
Figure 6 Recovery index of the CMAP amplitude and gastrocnemius muscle weight recovery ratio at 12 and 24 weeks after surgery.(A) Recovery index of the CMAP amplitude; (B) gastrocnemius muscle weight recovery ratio. Data are expressed as the mean ± SEM (n = 3; one-way analysis of variance followed by Bonferroni post hoc tests). †P < 0.05, vs. autograft;*P < 0.05, vs. 2-CANC; #P < 0.05, vs. 3-CANC. CANC:Custom anatomy-based nerve conduit; CMAP: compound muscle action potential.

Figure 7 Morphology of nerve tissue and quantitative analysis of nerve fibers at 24 weeks after surgery.(A) Morphology of myelinated nerve fiber (green arrow) at 24 weeks in the autograft, 1-, 2-, 3-, and 4-CANC groups. 1-μm sections stained with toluidine blue were observed under an optical microscope (original magnification, 20×). 50-nm sections stained with both uranyl acetate and lead citrate were observed using transmission electron microscopy (original magnification, 3000-15000×). (B) Comparisons of the number, density (at 24 weeks after surgery), and diameter of myelinated fibers and thickness of the myelin sheath (at 12 and 24 weeks after surgery) between the five groups. Data are expressed as the mean ± SEM (n = 3; one-way analysis of variance followed by Bonferroni post hoc tests). †P < 0.05, vs. autograft;*P < 0.05, vs. 2-CANC; #P < 0.05, vs. 3-CANC. CANC: Custom anatomy-based nerve conduit.
Simultaneous retrograde tracing for evaluating the accuracy of nerve regeneration at 24 weeks after surgery (in vivo)
Anatomically, the fast blue- and nuclear yellow-labeled profiles in the anterior horn of the spinal cord are usually separated (Figure 10A). However, mismatched regeneration (intermingling of fast blue- and nuclear yellow-labeled profiles)was found in all groups (Figure 10B). The total number of labeled profiles (i.e., fast blue-labeled, nuclear yellow-labeled, and the mixed fast blue-nuclear yellow-labeled profiles) in all CANC groups was equal but significantly lower than in the autograft group (Figure 10C). The percentages of fast blue- and nuclear yellow-labeled profiles in the 2-, 3-,and 4-CANC groups were markedly lower than that seen in the 1-CANC group (Figure 10D).
Discussion
Optimal nerve repair can be achieved by accurate fascicle match through autografts, allografts, and nerve substitutes(Yan et al., 2017b). While fascicular nerve repair can provide an accurate fascicle match, it has not been clinically applied because surgeons do not have detailed information of the 3D topography of the target nerve (Thota et al., 2015; Riccio et al., 2018). Studies on single- or multi-channel nerve conduits for nerve defect repair have so far been revealed unsatisfactory results, mainly due to considerable misrouted axon regeneration when regeneration is guided by nerve substitutes that have an inappropriate size and structure (due to inadequate microstructure information) (Yao et al., 2010; Liu et al., 2018).
In this study, more than 5000 layers of HR micro-CT images with a 3 × 3 × 3 voxel size were used to reconstruct a 15-mm rabbit sciatic nerve. Obtaining such detailed information requires a lot of manual labor when using traditional histological methods, which means that errors are inevitable.Some studies have shown that HR micro-CT provides high resolution tomographic data about nerve samples (Pixley et al., 2016; Glueckert et al., 2018), which could overcome this problem. However, numerous disadvantages of HR micro-CT have been reported, including poor resolution of fascicles and obvious morphological changes related to contrast agents (Vickerton et al., 2013; Hopkins et al., 2015). In this study, a reliable method was developed to obtain continuous HR images of rabbit sciatic nerve. The fascicle and connective tissue was clearly identified in all sequenced images.These results helped us to trace the fascicle topography and determine its aggregation and distribution pattern. We also observed the macro changes of the sample treated with 40%Lugol's solution and lyophilization for 2 days that provided an optimal condition for visualization of rabbit sciatic nerve on HR micro-CT.
The goal of this study was to develop an implant that could mimic the microstructure of the targeted nerve and provide an accurate fascicle match between the proximal and distal stumps. The IFD HR micro-CT and histological results showed that there are independent (cable-like) fascicle arrangements in the middle portion (15 mm) of the rabbit sciatic nerve. Hence, we designed four types of CANC with independent channel(s) and different match index to bridge 10 mm gap, and evaluated the accuracy of axon regeneration.
It is important to maintain integrity and stability of nerve conduits at the graft site because it must resist muscular contraction, stretching, and distortion. After implantation, nerve conduits must provide sufficient biomechanical support throughout the entire regeneration process. Based on the compressive and bending test results, all four types of CANC exhibited suitable mechanical properties; the 4-CANC demonstrated the highest resistance of all CANCs because its internal structure was closest to a “honeycomb” pattern, and compressive forces from different directions were therefore well-distributed. Elasticity is another important factor that should be considered when designing CANCs. In our study,the PLGA membrane was purposely designed with 2-mm lips at each end, which is a safe distance from the defect end and maintains the tension end without tension on the anastomosis site.
CANCs are designed to guide regenerated fascicles to reach the target area through anatomical-based channels and by limiting the intermingling of fascicles during regeneration. Thus, another important factor required for successful regeneration of new fascicles is that they are precisely matched at the coaptation site, which could remarkably affect intermingling fascicles in regeneration. In this study,four types of CANC were designed with different MIs but a similar regeneration space. We found that the percentage of motor neurons with double projections in the 1-CANC group was 2-3 times higher than that seen in the 2-, 3-, and 4-CANC groups. The total number of labeled motor neurons was equal between groups; this indicates that there were still some intermingling fascicles inside channels. Another possible explanation for this finding is that some axons had been misrouted at coaptation sites, which resulted in different extents of intermingling of fascicles. Taken together,these results clearly demonstrate that the 2-, 3-, and 4-CANC limited the intermingling of regenerated fascicles without affecting the total number of regenerated axons.
The improvement of CMAP is one of most important indications of nerve regeneration (Gu et al., 2011). In this study,the highest CMAP was found in the autograft group, and the CMAPs of the 2- and 3-CANC groups were obviously higher than that of the 1-CANC group. The morphometric analysis revealed that the total number and density of myelinated fibers were not dramatically different between the CANC groups. Interestingly, more mature fibers with a larger diameter and thicker sheath were observed in the 2- and 3-CANC groups compared with the 1- and 4-CANC groups. These results can be explained as follows: the luminal surface areas of the 2-, 3-, and 4-CANC groups were larger than that of the 1-CANC group, which is more suitable for neuronal adhesion, proliferation, and migration; the MI of the 4-CANC group was lower than the Mis of the 2- and 3-CANC groups,which may decrease the distribution of nerve-supporting cells and their local release of growth factors in each channel. These results indicate that the CANCs with high MI and luminal surface better facilitated the maturation of myelinated nerve fibers.
Most previous studies on nerve function recovery have used histological observations and electrophysiological studies to evaluate regeneration of nerve fibers in the conduits(Jeffries and Yadong, 2012; Jingwei et al., 2014). In our study,fascicle regeneration was also evaluated by histological and electrophysiological methods, but also using behavioral assessments. The histological and electrophysiological assessments showed the 2- and 3-CANC groups were better than the 1- and 4-CANC groups. Gastrocnemius muscle weight ratio was better in the 2- and 3-CANC groups than in the 1-CANC group. The behavioral test revealed that only the 3-CANC group achieved a limb functional recovery and a lower percentage of grade 3 autotomy behaviors than other CANC groups, but was comparable to the autograft group.These results suggest that the 3-CANC has the most potential for motor and sensory recovery.
Although all CANC groups exhibited poorer recovery outcomes than the autograft group, the CANC still has great potential for clinical application if further optimization can be achieved. Future work should focus on the CANC fabrication process such that it better mimics the anatomical structure of the natural nerve and improves the MI on coaptation sites.
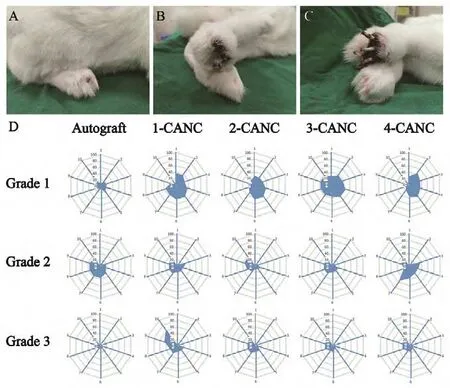
Figure 8 Assessment of pain-related autotomy behavior.(A-C) Severity of autotomy at 10 weeks postoperatively. (D) Level of autotomy behavior over time in the autograft, 1-, 2-, 3-, and 4-CANC groups. Grade 3 autotomy was common in the 1- and 4-CANC groups,and the earliest grade 3 autotomy was observed in the 4-CANC group at 3 weeks. In contrast, grade 1 or 2 autotomy was commonly seen in the 2- and 3-CANC groups. Autotomy was less common in the autograft group, and only two animals presented with grade 3 autotomy until the end of the observation. Grade 1: Autotomy at the claw of the paw; grade 2: autotomy from the claw to the toe; grade 3: autotomy from the claw to the sole. CANC: Custom anatomy-based nerve conduit.

Figure 9 Dynamic behavior analysis of motor recovery in a complete swing cycle.(A) Definition of motion angle in the rabbit. (B) Four stages of the complete swing cycle. (C, D) Changes of AOB angle over time in the contralateral limb and operative limb in the 3-CANC group at 24 weeks after surgery. (E) The calculated Q-values in the five groups. Data are expressed as the mean ± SEM (n = 8; one-way analysis of variance followed by Bonferroni post hoc tests). †P < 0.05, vs. autograft; #P < 0.05,vs. 3-CANC. CANC: Custom anatomy-based nerve conduit.
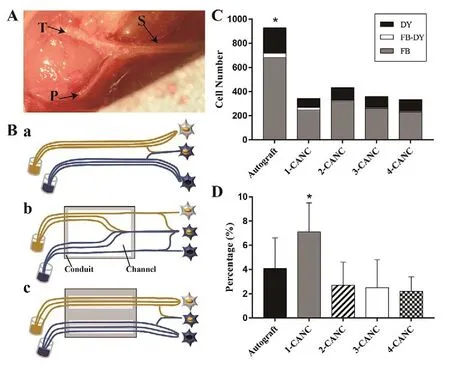
Figure 10 Simultaneous retrograde tracing for evaluating the accuracy of nerve regeneration at 24 weeks after surgery.(A) The rabbit sciatic nerve (S) with the branch tibia nerve (T) and peroneal nerve (P). (B) The technique of simultaneous tracing and schematic diagram of the dispersion of regenerating motor axons after autograft (a), 1-CANC (b), and 2-/3- or 4-CANC (c) repair.(C) Mean number of FB-labeled, NY-labeled, FB- and NY-double-labeled profiles from the anterior motor neurons in the five groups. (D) Results of simultaneous retrograde tracing for the percentages of double-labeled profiles in five groups. Data are expressed as the mean ± SEM (n = 15; one-way analysis of variance followed by Bonferroni post hoc tests). †P < 0.05, vs. autograft.CANC: Custom anatomy-based nerve conduit; FB: fast blue; NY:nuclear yellow.
Acknowledgments:We thank the staffs from the Animal Experiment Center of Xinjiang Medical University, the Center for Peripheral Nerve Tissue Engineering and Technology Research, Guangzhou and Guangdong Province Engineering Laboratory for Soft Tissue Biofabrication.
Author contributions:Study conception and design: AY, QTZ; data analysis and explanation: MY, AK, ZHL, WF, LWY, AA; study implementation and manuscript writing: YA and MY. All authors approved the final version of the paper.
Conflicts of interest:The authors declare that there are no conflicts of interest associated with this manuscript.
Financial support:This study was supported by the National Natural Science Foundation of China, No. 81360270, 81560357 (both to Aihemaitijiang·Yusufu), and 31670986 (to QTZ); the Key Laboratory of Hand Reconstruction, Ministry of Health, China; the Shanghai Key Laboratory of Peripheral Nerve and Microsurgery of China, No. 17DZ2270500 (to AY);the Science and Technology Project of Guangdong Province of China, No.2014B020227001, 2017A050501017 (both to QTZ). The funding sources had no role in study design, conception, analysis or interpretation of data,writing and deciding to submit this paper for publication.
Institutional review board statement:All animal procedures were approved by the Animal Care and Use Committee, Xinjiang Medical University, China (ethics approval No. IACUC20170315-02) on April 4, 2017 in accordance with the NIH Guide for the Care and Use of Laboratory Animals (NIH Publication No. 80-23, revised 1996).
Copyright license agreement:The Copyright License Agreement has been signed by all authors before publication.
Data sharing statement:Datasets analyzed during the current study are available from the corresponding author on reasonable request.
Plagiarism check:Checked twice by iThenticate.
Peer review:Externally peer reviewed.
Open access statement:This is an open access journal, and articles are distributed under the terms of the Creative Commons Attribution-Non-Commercial-ShareAlike 4.0 License, which allows others to remix, tweak, and build upon the work non-commercially, as long as appropriate credit is given and the new creations are licensed under the identical terms.

- 中国神经再生研究(英文版)的其它文章
- Fresh human amniotic membrane effectively promotes the repair of injured common peroneal nerve
- CNB-001 reduces paraplegia in rabbits following spinal cord ischemia
- Differential gene and protein expression between rat tibial nerve and common peroneal nerve during Wallerian degeneration
- Axonotmesis-evoked plantar vasodilatation as a novel assessment of C-fiber afferent function after sciatic nerve injury in rats
- Relationship between high dietary fat intake and Parkinson's disease risk: a meta-analysis
- Optogenetics-induced activation of glutamate receptors improves memory function in mice with Alzheimer's disease