样本量估计及其在nQuery和SAS软件上的实现*——均数比较(十一)
2019-07-10 07:01:46南方医科大学生物统计学系510515
中国卫生统计 2019年3期
南方医科大学生物统计学系(510515)
徐 莹 高培纯 徐笑寒 陈平雁△
1.2.2.11 基于比值高阶交叉设计的非劣效性检验
Chen(1997)[1]和Chow and Liu(2009)[2]给出的高阶交叉设计的样本量估计方法是建立在近似服从自由度为vk的t分布上,当指标为高优指标时,其检验效能计算公式为:
(1-59)
当指标为低优指标时,对应的检验效能计算公式为:
(1-60)

在计算样本量时,一般先设定样本量初始值,然后迭代样本量直到所得的检验效能满足条件为止。此时的样本量,即研究所需的样本量。
【例1-32】某公司欲验证一种治疗风湿病的仿制药非劣于标准药。拟采用2×4设计。研究者决定将非劣界值设置为0.2。根据以往研究,已知标准药CV为0.4。假设仿制药与标准药真实比值为1。检验水准为0.05,试估计检验效能为90%所需的样本量。
nQuery Advanced 8.2实现:设定检验水准为α=0.05,检验效能取90%。由题意知,μ2/μ1=1,NIM=0.2,CV=0.4。在nQuery Advanced 8.2主菜单选择:
方法框中选择:Higher-order Cross-Over Design for Two Means- Non-Inferiority-using Ratios
在弹出的样本量计算窗口将各参数键入,如图1-75所示,结果为N=29。
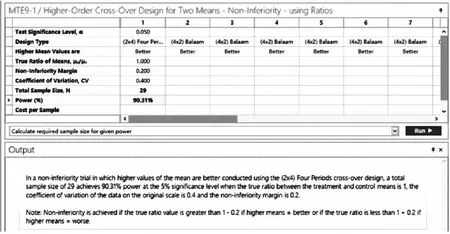
图1-75 nQuery Advanced 8.2 关于例1-32样本量估计的参数设置与计算结果
SAS9.4软件实现:
proc IML;
start MTE91(Designtype,Better,a,Ratio,NIM,CV,power);
error=0;
if(Designtype=1|Designtype=2|Designtype=3|Designtype=4)then do;
error=0;end;
else do;error=1;print"error" "Designtype must be 1 or 2 or 3 or 4";end;
if(Better=1 | Better=0)then do;
error=0;end;
else do;
error=1;print"error" "Higher means better(1)/worse(0)";end;
if(a>0.2 | a<0) then do;
error=1;print"error" "Test significance level must be in 0-0.2";end;
if(Ratio<0) then do;
error=1;print"error" "True Ratio of means must be>0";end;
if(NIM<0) then do;
error=1;print"error" "Non-Inferiority margin must be>0";end;
if(Better=1) then do;
if(Ratio<= 1-NIM)then do;
error=1;print"error" "True Ratio should be>1 - Non-Inferiority margin if higher means better";end;
end;
if(Better=0) then do;
if(Ratio>= 1+NIM)then do;
error=1;print"error" "True Ratio should be<1+Non-Inferiority margin if higher means worse";end;
end;
if(CV<0) then do;
error=1;print"error" "Coefficient of variance must be>= 0";end;
if(power>100 | power<1) then do;
error=1;print"error" "Power(%) must be in 1-100";end;
if(error=1) then stop;
if(error=0) then do;
if(Designtype=1) then do;n=1;b=2;end;
if(Designtype=2) then do;n=2;b=3/4;end;
if(Designtype=3) then do;n=1;b=11/20;end;
if(Designtype=4) then do;n=1;b=1/4;end;
Sw=sqrt(log(CV**2+1));
if(Better=1) then do;
do until(pw>=power/100);
if(Designtype=1) then do;df=4*n-3;end;
if(Designtype=2) then do;df=4*n-4;end;
if(Designtype=3) then do;df=6*n-5;end;
if(Designtype=4) then do;df=12*n-5;end;
t=(-log(Ratio)-log(1-NIM))/(Sw*sqrt(b/n))-tinv(1-a,df);
pw=probt(t,df);n=n+0.01;
end;
end;
if(Better=0) then do;
do until(pw>=power/100);
if(Designtype=1) then do;df=4*n-3;end;
if(Designtype=2) then do;df=4*n-4;end;
if(Designtype=3) then do;df=6*n-5;end;
if(Designtype=4) then do;df=12*n-5;end;
t=tinv(1-a,df)-(log(Ratio)+log(1+NIM))/(Sw*sqrt(b/n));
pw=probt(t,df);n=n+0.01;
end;
end;
if(Designtype=1) then do;N=ceil((n-0.01)*4);end;
if(Designtype=2) then do;N=ceil((n-0.01)*2);end;
if(Designtype=3) then do;N=ceil((n-0.01)*2);end;
if(Designtype=4) then do;N=ceil((n-0.01)*4);end;
if(Designtype=1) then do;Design_type="1. 4*2";end;
if(Designtype=2) then do;Design_type="2. 2*3";end;
if(Designtype=3) then do;Design_type="3. 2*4";end;
if(Designtype=4) then do;Design_type="4. 4*4";end;
if better=1 then Better_="better";else Better_="worse";
Design_type
Better_[label="Higher Mean Values are"]
a[label="Test Significance Level"]
Ratio[label="True Ratio of Means,u2/u1"]
NIM[label="Non-Inferiority Margin"]
CV[label="Coefficient of Variance,CV"]
power[label="Power(%)"]
N[label="N"];
end;
finish MTE91;
run MTE91(3,1,0.05,1,0.2,0.4,90);
quit;
SAS运行结果:

图1-76 SAS 9.4 关于例1-32样本量估计的参数设置与计算结果
1.2.2.12 基于均差高阶交叉设计的优效性检验
Chen(1997)[1]和Chow and Liu(2009)[2]给出的高阶交叉设计的样本量估计方法是建立在近似服从自由度为vk的t分布上,当指标为高优指标时,其检验效能计算公式为:
(1-61)
当指标为低优指标时,对应的检验效能计算公式为:
(1-62)

在计算样本量时,一般先设定样本量初始值,然后迭代样本量直到所得的检验效能满足条件为止。此时的样本量,即研究所需的样本量。
【例1-33】某公司欲验证一种治疗风湿病的仿制药非劣于标准药,拟采用2×3设计。研究者决定将优效界值设置为5。根据以往类似研究,已知均方误为100。假设仿制药于标准药真实差值为15。检验水准设置为0.05,试估计检验效能为90%所需的样本量。
nQuery Advanced 8.2 实现:设定检验水准为α=0.05,检验效能取90%。由题意知,μ2-μ1=15,SM=5,=10。在nQuery Advanced 8.2主菜单选择:
方法框中选择:Higher-order Cross-Over Design for Two Means- Superiority by Margin-using Differences
在弹出的样本量计算窗口将各参数键入,如图1-77所示,结果为N=14。

图1-77 nQuery Advisor 8.2 关于例1-33样本量估计的参数设置与计算结果
SAS 9.4软件实现:
proc IML;
start MTE71(Designtype,Better,a,Delta,SM,Sw,power);
error=0;
if(Designtype=1|Designtype=2|Designtype=3|Designtype=4)then do;
error=0;end;
elsedo;error=1;print"error" "Designtype must be 1 or 2 or 3 or 4";end;
if(Better=1 | Better=0)then do;
error=0;end;
else do;
error=1;print"error" "Higher means better(1)/worse(0)";end;
if(a>0.2 | a<0) then do;
error=1;print"error" "Test significance level must be in 0-0.2";end;
if(Better=1) then do;
if(Delta<= abs(SM))then do;
error=1;print"error" "True difference in means must>superiority margin if higher means better";end;
end;
if(Better=0) then do;
if(Delta>= -abs(SM))then do;
error=1;print"error" "True difference in means must end; if(Sw<0) then do; error=1;print"error" "Within standard error must be>=0";end; if(power>100 | power<1) then do; error=1;print"error" "Power(%) must be in 1-100";end; if(error=1) then stop; if(error=0) then do; if(Designtype=1) then do;n=1;b=2;end; if(Designtype=2) then do;n=2;b=3/4;end; if(Designtype=3) then do;n=1;b=11/20;end; if(Designtype=4) then do;n=1;b=1/4;end; if(Better=1) then do; do until(pw>=power/100); if(Designtype=1) then do;df=4*n-3;end; if(Designtype=2) then do;df=4*n-4;end; if(Designtype=3) then do;df=6*n-5;end; if(Designtype=4) then do;df=12*n-5;end; t=(Delta-abs(SM))/(Sw*sqrt(b/n))-tinv(1-a,df); pw=probt(t,df);n=n+0.01; end; end; if(Better=0) then do; do until(pw>=power/100); if(Designtype=1) then do;df=4*n-3;end; if(Designtype=2) then do;df=4*n-4;end; if(Designtype=3) then do;df=6*n-5;end; if(Designtype=4) then do;df=12*n-5;end; t=tinv(1-a,df)-(-Delta-abs(SM))/(Sw*sqrt(b/n)); pw=probt(t,df);n=n+0.01; end; end; if(Designtype=1) then do;N=ceil((n-0.01)*4);end; if(Designtype=2) then do;N=ceil((n-0.01)*2);end; if(Designtype=3) then do;N=ceil((n-0.01)*2);end; if(Designtype=4) then do;N=ceil((n-0.01)*4);end; if(Designtype=1) then do;Design_type="1. 4*2";end; if(Designtype=2) then do;Design_type="2. 2*3";end; if(Designtype=3) then do;Design_type="3. 2*4";end; if(Designtype=4) then do;Design_type="4. 4*4";end; if better=1 then Better_="better";else Better_="worse"; print Design_type Better_[label="Higher Mean Values are"] a[label="Test Significance Level"] Delta[label="True Difference in Means.u2-u1"] SM[label="Superiority Margin"] Sw[label="Within Standard Error"] power[label="Power(%)"] N[label="N"]; end; finish MTE71; run MTE71(2,1,0.05,15,5,10,90); quit; SAS运行结果: 图1-78 SAS 9.4 关于例1-33样本量估计的参数设置与计算结果 1.2.2.13 基于比值高阶交叉设计的优效性检验 Chen(1997)[1]和Chow(2009)[2]给出的高阶交叉设计的样本量估计方法是建立在近似服从自由度为vk的t分布上,当指标为高优指标时,其检验效能计算公式为: (1-63) 当指标为低优指标时对应的检验效能计算公式为: (1-64) 在计算样本量时,一般先设定样本量初始值,然后迭代样本量直到所得的检验效能满足条件为止。此时的样本量,即研究所需的样本量。 【例1-34】某公司欲验证一种治疗风湿病的仿制药非劣于标准药,拟采用2×4设计。研究者决定将优效界值设置为0.2。根据以往研究,已知标准药CV为0.4。假设仿制药与标准药真实比值为1.4。检验水准设置为0.05,试估计检验效能为90%所需的样本量。 nQuery Advanced 8.2 实现:设定检验水准为α=0.05,检验效能取90%。由题意知,μ2/μ1=1.4,SM=0.2,CV=0.4。在nQuery Advanced 8.2主菜单选择: 方法框中选择:Higher-order Cross-Over Design for Two Means- Superiority by Margin- using Ratios 在弹出的样本量计算窗口将各参数键入,如图1-79所示,结果为N=60。 图1-79 nQuery Advanced 8.2 关于例1-34样本量估计的参数设置与计算结果 SAS 9.4软件实现: proc IML; start MTE101(Designtype,Better,a,Ratio,SM,CV,power); error=0; if(Designtype=1|Designtype=2|Designtype=3|Designtype=4)then do; error=0;end; elsedo;error=1;print"error" "Designtype must be 1 or 2 or 3 or 4";end; if(Better=1 | Better=0)then do; error=0;end; else do; error=1;print"error" "Higher means better(1)/worse(0)";end; if(a>0.2 | a<0) then do; error=1;print"error" "Test significance level must be in 0-0.2";end; if(Ratio<= 0) then do; error=1;print"error" "True Ratio of means must be>0";end; if(SM<0) then do; error=1;print"error" "Superiority margin must be>0";end; if(Better=1) then do; if(Ratio<= 1+SM)then do; error=1;print"error" "True difference in means must>1+superiority margin if higher means better";end; end; if(Better=0) then do; if(Ratio>= 1-SM)then do; error=1;print"error" "True difference in means must<1 - superiority margin if higher means worse";end; end; if(CV<0) then do; error=1;print"error" "Coefficient of variance must be>= 0";end; if(power>100 | power<1) then do; error=1;print"error" "Power(%) must be in 1-100";end; if(error=1) then stop; if(error=0) then do; if(Designtype=1) then do;n=1;b=2;end; if(Designtype=2) then do;n=2;b=3/4;end; if(Designtype=3) then do;n=1;b=11/20;end; if(Designtype=4) then do;n=1;b=1/4;end; Sw=sqrt(log(CV**2+1)); if(Better=1) then do; do until(pw>=power/100); if(Designtype=1) then do;df=4*n-3;end; if(Designtype=2) then do;df=4*n-4;end; if(Designtype=3) then do;df=6*n-5;end; if(Designtype=4) then do;df=12*n-5;end; t=(abs(log(Ratio))-log(1+SM))/(Sw*sqrt(b/n))-tinv(1-a,df); pw=probt(t,df);n=n+0.01; end; end; if(Better=0) then do; do until(pw>=power/100); if(Designtype=1) then do;df=4*n-3;end; if(Designtype=2) then do;df=4*n-4;end; if(Designtype=3) then do;df=6*n-5;end; if(Designtype=4) then do;df=12*n-5;end; t=-(abs(log(Ratio))+log(1-SM))/(Sw*sqrt(b/n))+tinv(1-a,df); pw=probt(t,df);n=n+0.01; end; end; if(Designtype=1) then do;N=ceil((n-0.01)*4);end; if(Designtype=2) then do;N=ceil((n-0.01)*2);end; if(Designtype=3) then do;N=ceil((n-0.01)*2);end; if(Designtype=4) then do;N=ceil((n-0.01)*4);end; if(Designtype=1) then do;Design_Type="1. 4*2";end; if(Designtype=2) then do;Design_Type="2. 2*3";end; if(Designtype=3) then do;Design_Type="3. 2*4";end; if(Designtype=4) then do;Design_Type="4. 4*4";end; print Design_Type a[label="Test Significance Level"] Ratio[label="True Ratio of Means,u2/u1"] SM[label="Superiority margin"] CV[label="Coefficient of Variance(non-logarithmic),CV"] power[label="Power(%)"] N[label="N"]; end; finish MTE101; run MTE101(3,1,0.05,1.4,0.2,0.4,90); quit; SAS运行结果: 图1-80 SAS 9.4 关于例1-34样本量估计的参数设置与计算结果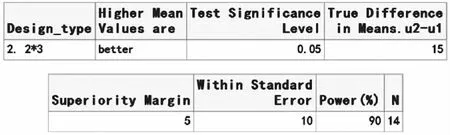


猜你喜欢
防爆电机(2022年4期)2022-08-17 05:59:50
内蒙古统计(2021年4期)2021-12-06 02:49:20
中国眼镜科技杂志(2019年9期)2019-11-11 12:15:26
测控技术(2018年4期)2018-11-25 09:46:52
上海精神医学(2017年5期)2017-11-29 06:03:10
电脑知识与技术(2016年22期)2016-10-31 20:38:41
江西通信科技(2015年3期)2015-12-05 05:52:05
城市道桥与防洪(2014年5期)2014-02-27 07:26:16
中国工程咨询(2014年3期)2014-02-16 06:24:18
山西大同大学学报(自然科学版)(2014年6期)2014-01-23 02:00:17