Trace element partitioning between amphibole and hydrous silicate glasses at 0.6-2.6 GPa
Bo Zhang·Xianxu Hu·Peng Li·Qizhe Tang·Wenge Zhou
Abstract Partitioning behavior between amphibole and silicate glass of thirty-three minor and trace elements(Sc,Ti,V,Cr,Co,Rb,Sr,P,Y,Zr,Nb,Cs,Ba,K,La,Ce,Pr,Nd,Sm,Eu,Gd,Tb,Dy,Ho,Er,Tm,Yb,Lu,Hf,Ta,Pb,Th,and U)have been determined experimentally.Products of crystallization of hydrous basalt melts from 0.6 GPa/860°C up to 2.6 GPa/970°C were obtained in a multianvil apparatus.Major and trace element compositions of amphibole and glass were determined with a combination of electron microprobe and laser ablation inductively coupled plasma mass spectrometry.The main mineral phase is calcic amphibole,and the coexisting glass compositions are tonalite,granodiorite,and granite.The compatibility of rareearth elementsincreaseat 915°Cand then decrease at 970°C,but the compatibility of most of these elements shows a continued,signif icant increase with increasing pressure.For high-f ield strength elements,large ion lithophile elements,actinide compatibility decrease with increasing temperature or pressure,but transition metals show a continued increase in compatibility within the temperature—pressure conditions.From mathematical and graphical f itting,we determined best-f it values for the ideal ionic radius(r0,1.01—1.04 A˚),thestrain-freepartition coeff icient(D0,1.18—1.58),and apparent Young’s modulus(E,142—370 GPa)for the M4 site in amphibole according to the lattice strain model.Theor rare earth elements rises at 915°C and then drops at 970°C at 0.6 GPa.However,thevalues are positively proportional to the pressure for rare earth elements in the amphibole-glass pairs at 0.6—2.6 GPa and 970°C.Furthermore,the derived best-f it values forand EM4 are almost constant and trend to increase with rising temperature and pressure,respectively.The partition coeff icient is distinctly different for different melt compositions.The rare earth elements become more enriched in amphibole if the quenched glass is granodiorite or granite compared to the tonalitic glasses.
Keywords Amphibole·Silicate glass·Trace elements·Partition coeff icients·Lattice strain model
1 Introduction
The partition coeff icient describes the distribution of an element between a mineral and melt.The Nernst partition coeff icient is def ined as Di=(concentration of element i in mineral)/(concentration of element i in melt).One could obtain quantitative understandingson igneous evolution by estimating the parental melt compositions with relevant D values between minerals and melts(Lundstrom et al.2000;Landwehr et al.2001;Frei et al.2009;Severs et al.2009;Parker et al.2010;Chang et al.2016;Cui et al.2017).However,due to the effectsof temperature,pressure and composition,mineral/melt D values show enormous variations(Blundy and Wood 2003;Adam and Green 2006;Severs et al.2009;Sun 2018).
Most of the partition coeff icient studies focus on minerals and silicate melts.These minerals include amphibole(Adam and Green 2006;Tiepolo et al.2007;Nandedkar et al.2016;Shimizu et al.2017),clinopyroxene(Adam and Green 2006;Hill et al.2011;Sun and Liang 2012;Mollo et al.2017),orthopyroxene(Adam and Green 2006;Frei et al.2009;Parker et al.2010;Sun and Liang 2013a),garnet(Adam and Green 2006;Draper and Westrenen 2007;Sun and Liang 2013b),plagioclase(Severs et al.2009;Sun et al.2017),olivine(Adam and Green 2006;Sun and Liang 2013b;Stead et al.2017),and some infrequent crystals such as rutile(Klemme et al.2005;Xiong et al.2005),and apatite(Prowatke and Klemme 2006).Additionally,few published literatures showed the distribution of trace elements between amphibole,clinopyroxene,garnet,apatite and carbonatite melts(Sweeney et al.1992,1995;Blundy and Dalton 2000;Klemme and Dalpe´2003;Dasgupta et al.2009).
Different techniques have been used to determine partition coeff icient of trace elements between minerals and melts.Several studies have measured trace elements in minerals and surrounding glassy matrix.The f irst kind of studiesmeasured thecontentsof traceelementsin minerals and the surrounding glassy matrix(Arzamastsev et al.2009;Severset al.2009;Olin and Wolff 2010;Mollo et al.2017).Moreover,the melt inclusion-mineral(MIM)technique was introduced to determine partitioning behavior of elements(Thomas et al.2002;Zajacz and Halter 2007;Severs et al.2009;Nardi et al.2013).Finally,minerals and melts from experimental products were used to determine the partitioning of trace elements(Blundy and Dalton 2000;Dalpe´and Baker 2000;Adam and Green 2006;Frei et al.2009;Parker et al.2010;Hill et al.2011).These methods have been used to determine partition coeff icients for the trace elements in various compositions of minerals and co-existing melts.Generally,mineral phases-melt systemswith many mineralswereinvestigated rather than a single mineral-melt system in most of the previous studies(Adam and Green 2006;Arzamastsev et al.2009;Severs et al.2009;Wan et al.2009).For example,Adam and Green(2006)discussed the partition coeff icients of trace elements between amphibole,clinopyroxene,orthopyroxene,garnet,olivine and coexisting melt in thesamesystem.Furthermore,it is well known that partition coeff icient dependson the chemical compositionsof mineral and melt,on pressure and temperature and on H2O-content of the melt(Blundy and Wood 2003;Adam and Green 2006;Severs et al.2009;Parker et al.2010;Hill et al.2011;Sun et al.2017).
In addition,a theoretical framework based on the lattice strain model(Brice 1975)was provided for trace element partitioning(Blundy and Wood 1994).So far,the theory has been applied successfully to trace element partitioning between clinopyroxene(Wood and Blundy 1997;Adam and Green 2006;Sun and Liang 2012),garnet(Draper and Westrenen 2007;Westrenen and Draper 2007;Sun and Liang 2013b),and amphibole(Adam and Green 2006;Tiepolo et al.2007;Wan et al.2009)and the coexisting melt with each other.These studies have shown that partition coeff icients vary as a function of crystal and melt composition,pressure and temperature.The inf luence of melt composition and temperature on the distribution of trace elements has been studied abundantly(Klein et al.1997;Tiepolo et al.2000;Nandedkar et al.2016;Shimizu et al.2017;Sun 2018).However,the systematic study of the effect of pressure on the distribution of trace elements is relatively lacking.
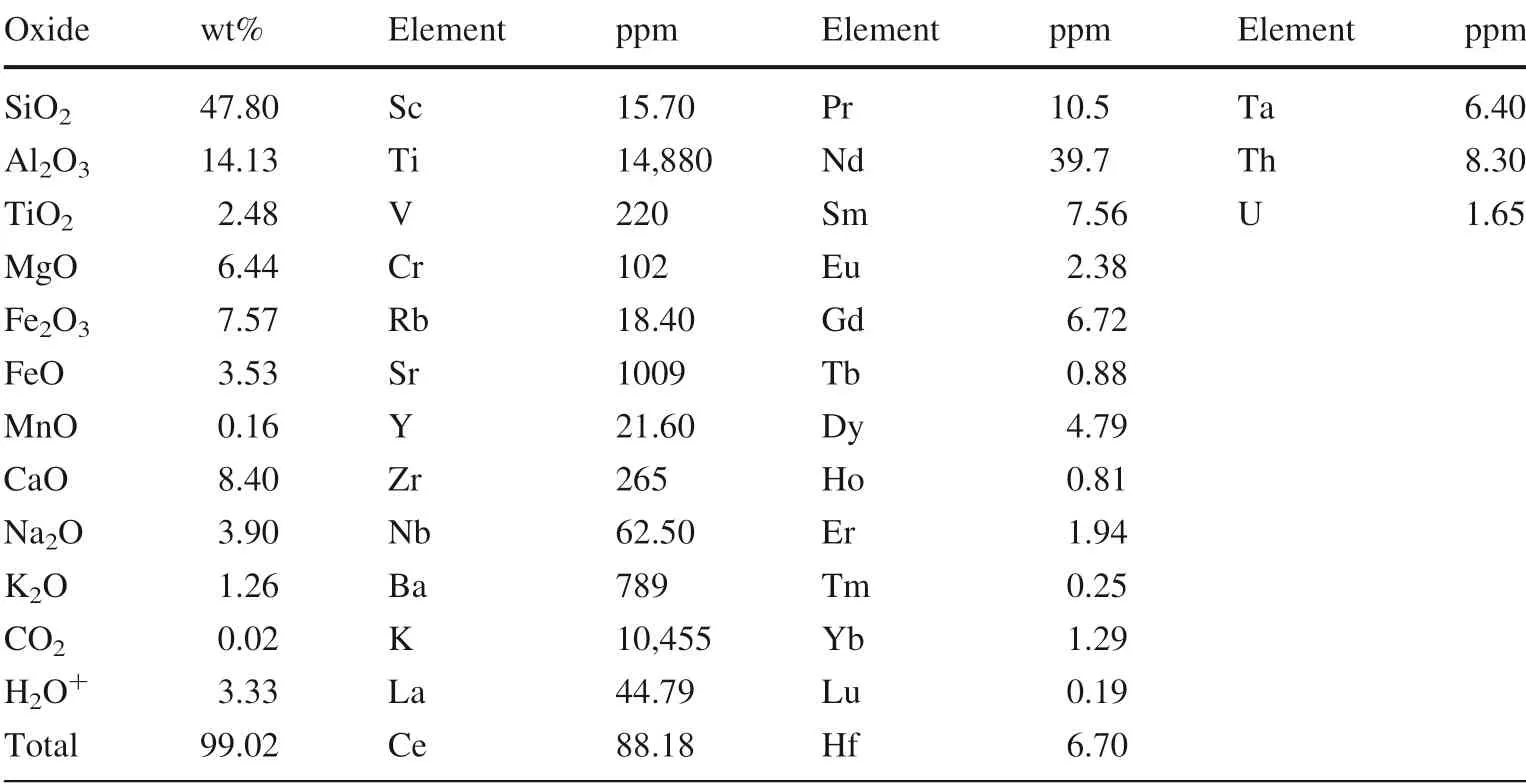
Table 1 Bulk composition of sample 10084
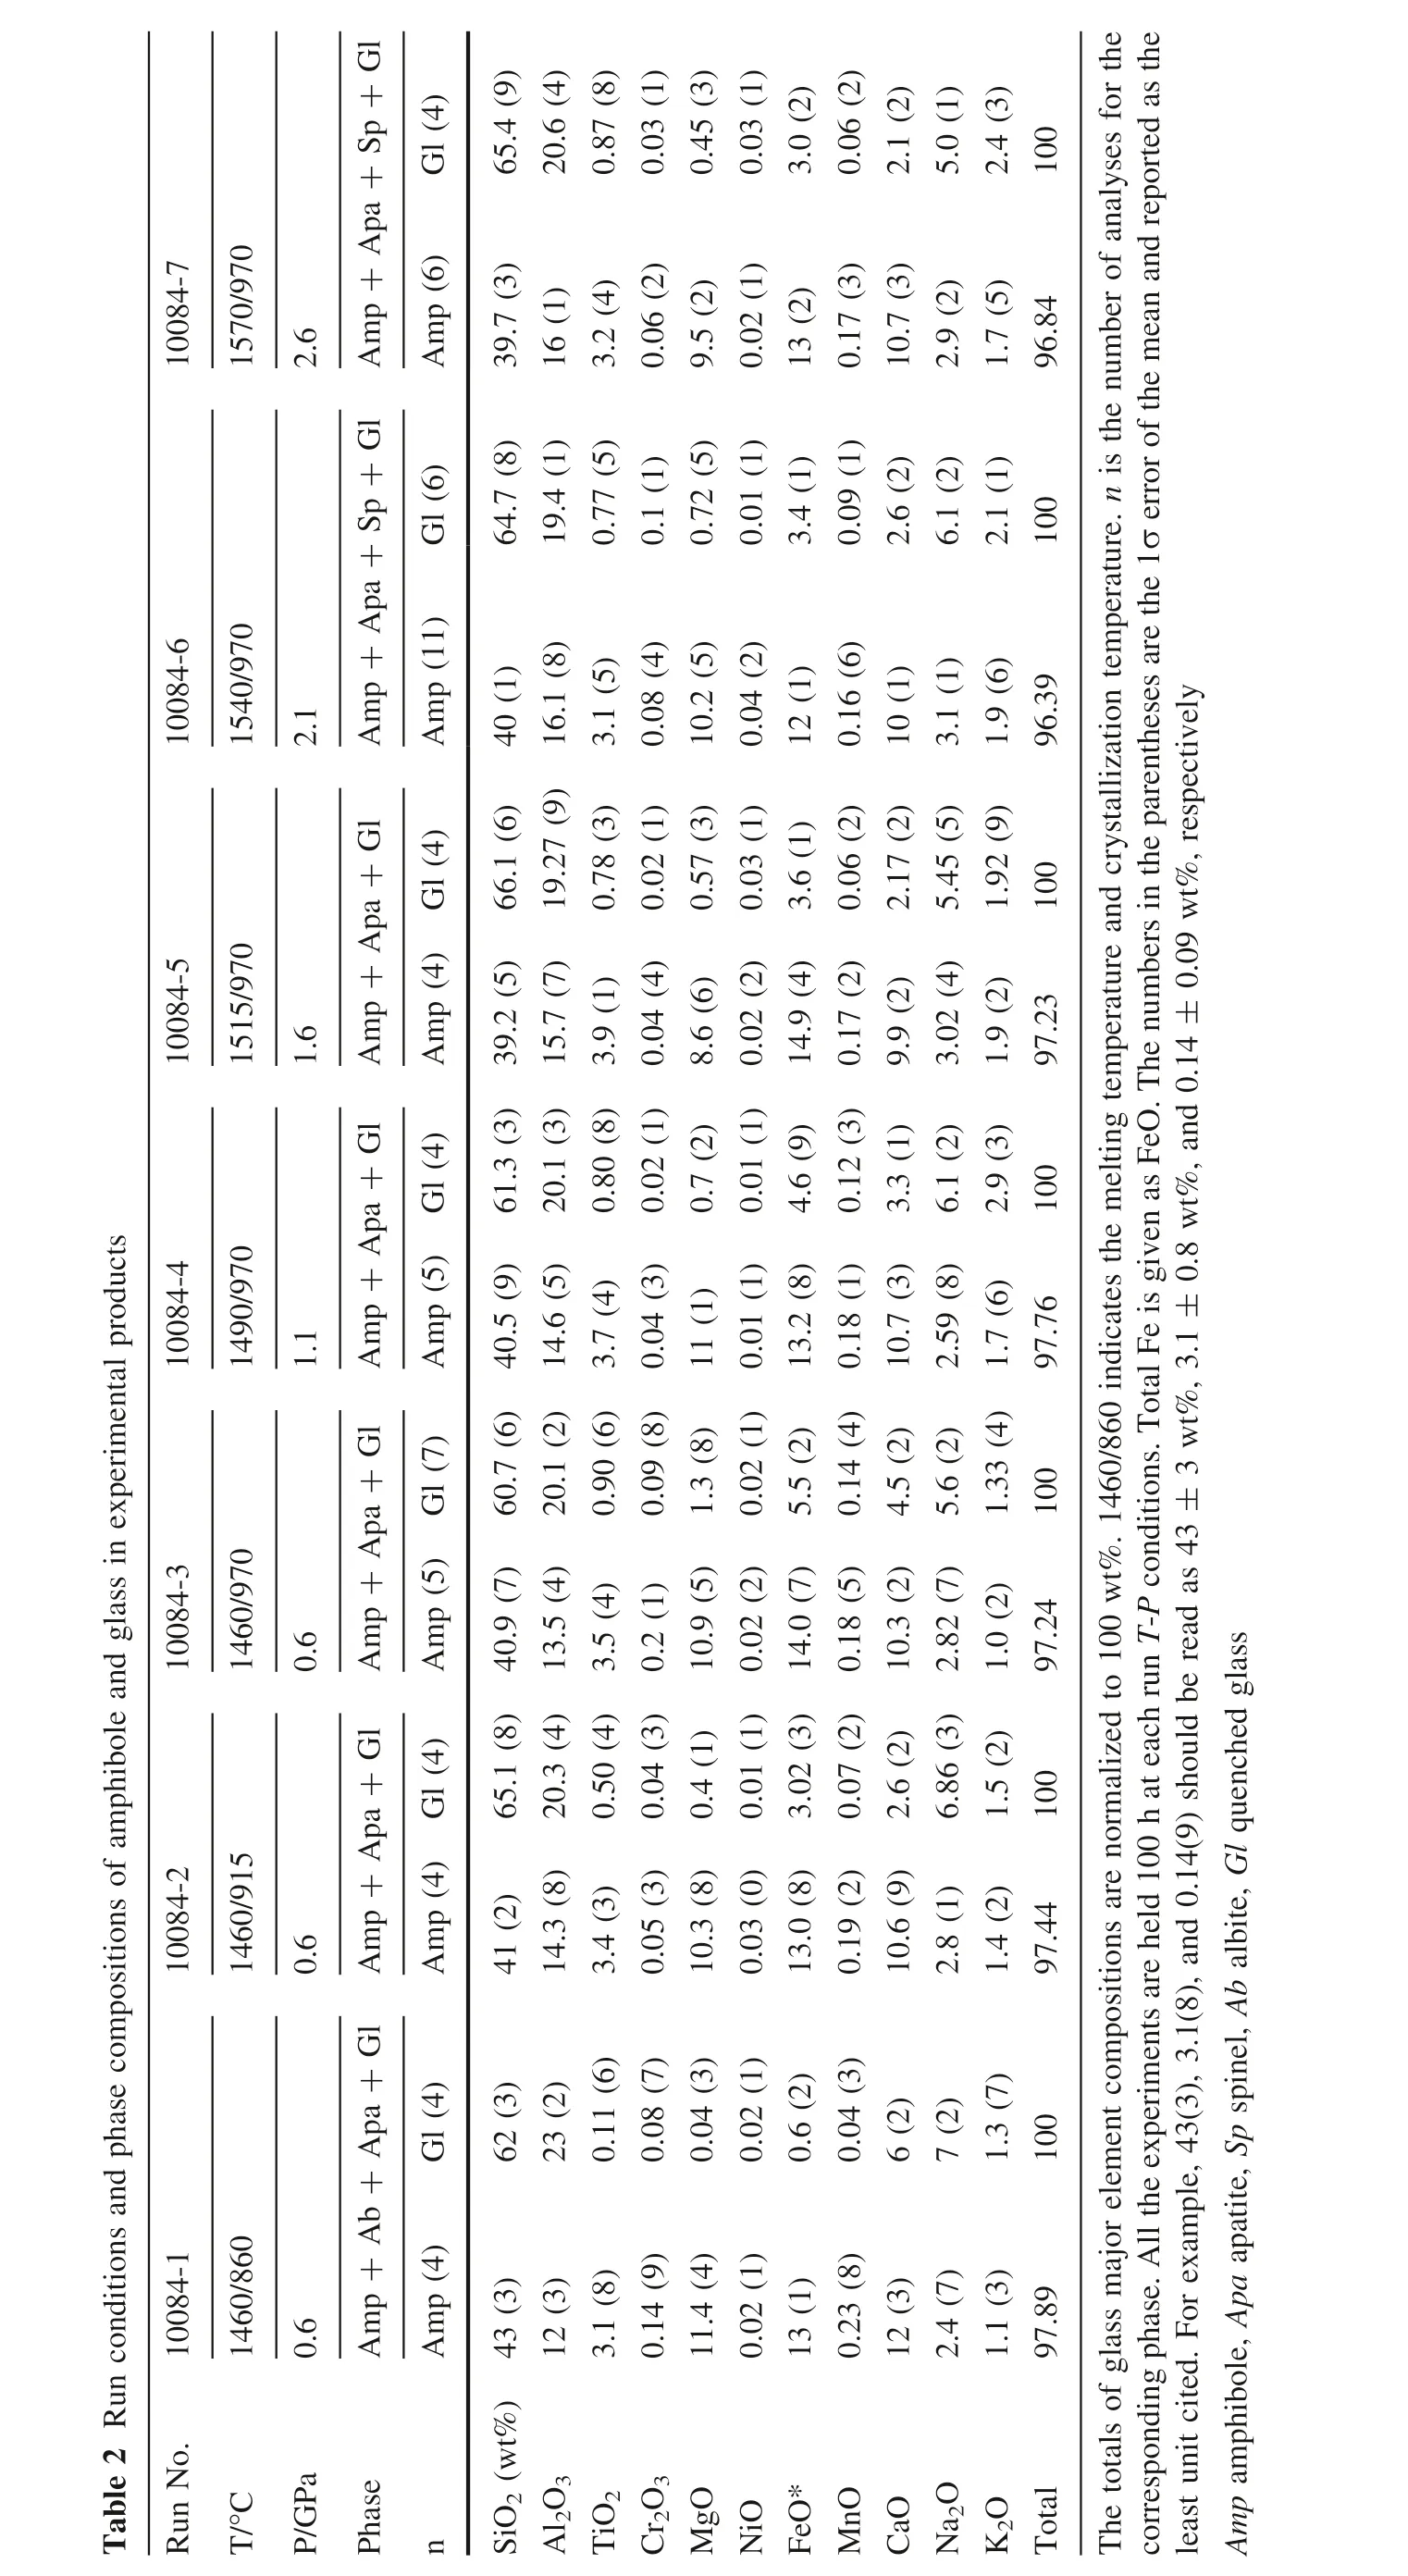
Table2Runconditionsandphasecompositionsofamphiboleandglassinexperimentalproducts Sp+Gl Gl(4)10084-7 1570/970 Apa+2.6 Amp+Amp(6)Sp+Gl Gl(6)10084-6 1540/970 Apa+2.1 Amp+Amp(11)Gl Gl(4)10084-5 1515/970 Apa+1.6 Amp+Amp(4)Gl Gl(4)10084-4 1490/970 Apa+1.1 Amp+Amp(5)Gl Gl(7)10084-3 1460/970 Apa+0.6 Amp+Amp(5)Gl Gl(4)10084-2 1460/915 Apa+0.6 Amp+Amp(4)Gl(4)10084-1 1460/860 Ab+Apa+Gl 0.6 Amp+Amp(4)RunNo.T/°C P/GPa Phase n 65.4(9)20.6(4)0.87(8)0.03(1)0.45(3)0.03(1)3.0(2)0.06(2)2.1(2)5.0(1)2.4(3)100 39.7(3)16(1)3.2(4)0.06(2)9.5(2)0.02(1)13(2)0.17(3)10.7(3)2.9(2)1.7(5)96.84 64.7(8)19.4(1)0.77(5)0.1(1)0.72(5)0.01(1)3.4(1)0.09(1)2.6(2)6.1(2)2.1(1)100 40(1)16.1(8)3.1(5)0.08(4)10.2(5)0.04(2)12(1)0.16(6)10(1)3.1(1)1.9(6)96.39 66.1(6)19.27(9)0.78(3)0.02(1)0.57(3)0.03(1)3.6(1)0.06(2)2.17(2)5.45(5)1.92(9)100 39.2(5)15.7(7)3.9(1)0.04(4)8.6(6)0.02(2)14.9(4)0.17(2)9.9(2)3.02(4)1.9(2)97.23 61.3(3)20.1(3)0.80(8)0.02(1)0.7(2)0.01(1)4.6(9)0.12(3)3.3(1)6.1(2)2.9(3)100 40.5(9)14.6(5)3.7(4)0.04(3)11(1)0.01(1)13.2(8)0.18(1)10.7(3)2.59(8)1.7(6)97.76 60.7(6)20.1(2)0.90(6)0.09(8)1.3(8)0.02(1)5.5(2)0.14(4)4.5(2)5.6(2)1.33(4)100 40.9(7)13.5(4)3.5(4)0.2(1)10.9(5)0.02(2)14.0(7)0.18(5)10.3(2)2.82(7)1.0(2)97.24 65.1(8)20.3(4)0.50(4)0.04(3)0.4(1)0.01(1)3.02(3)0.07(2)2.6(2)6.86(3)1.5(2)100 41(2)14.3(8)3.4(3)0.05(3)10.3(8)0.03(0)13.0(8)0.19(2)10.6(9)2.8(1)1.4(2)97.44 62(3)23(2)0.11(6)0.08(7)0.04(3)0.02(1)0.6(2)0.04(3)6(2)7(2)1.3(7)100 43(3)12(3)3.1(8)0.14(9)11.4(4)0.02(1)13(1)0.23(8)12(3)2.4(7)1.1(3)97.89 SiO2(wt%)Al 2O3 TiO2 Cr2O3 MgO NiO FeO*MnO CaO Na2O K2O Total Thetotalsofglassmajorelementcompositionsarenormalizedto100wt%.1460/860indicatesthemeltingtemperatureandcrystallizationtemperature.n isthenumberofanalysesforthe correspondingphase.Alltheexperimentsareheld100hateachrun T-P conditions.TotalFeisgivenasFeO.Thenumbersintheparenthesesarethe1σerrorofthemeanandreportedasthe 0.09wt%,respectively 3wt%,3.1±0.8wt%,and0.14±leastunitcited.Forexample,43(3),3.1(8),and0.14(9)shouldbereadas43±Amp amphibole,Apa apatite,Sp spinel,Ab albite,Gl quenchedglass

Table 3 Trace element data of experimental products for hydrous basalt
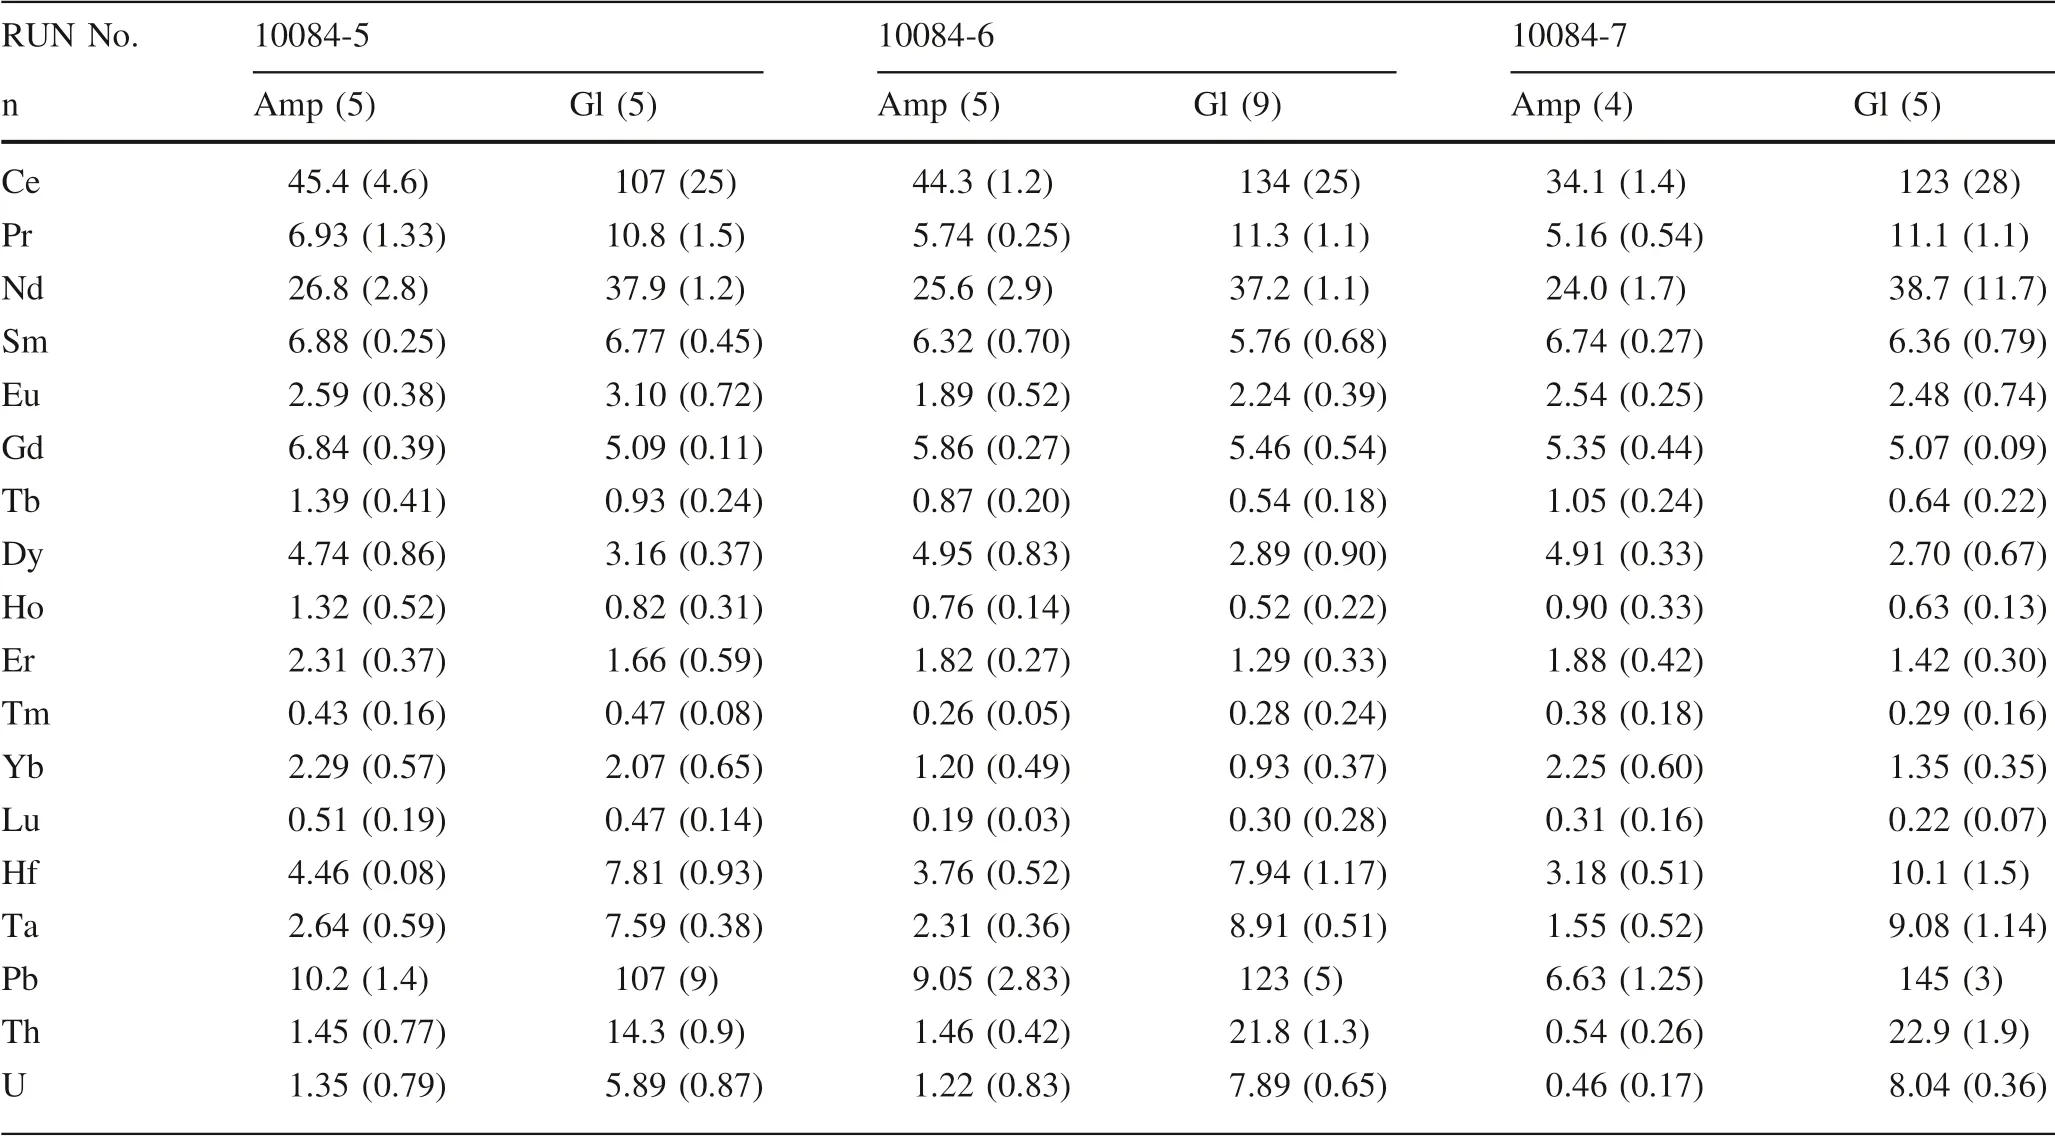
Table 3 continued
Thisstudy investigated the partitioning of trace elements between the crystalline amphibole and silicate liquid from the experimental products of crystallization of hydrous basalt melts at 0.6—2.6 GPa and 860—970°C.A combination of electron microprobe(EMP)and laser ablation-inductively coupled plasma-mass spectrometry(LA-ICPMS)was used to analyze major and trace elements in experimentally produced amphiboles and quenched glasses.The abundances of rare earth elements(REE),highf ield strength elements(HFSE),large ion lithophile elements(LILE),actinides,and the transition metals in experimental phases were determined and the data were used to calculate the partition coeff icients between amphiboles and glasses.In addition,the ideal radius,the maximum partition coeff icient and the apparent Young’s modulus of the M4 site of amphibole were estimated assuming that all REE3+occupy this site.
2 Experimental strategy and analytical techniques
2.1 Starting material and experimental procedures
The starting material used in the crystallization experiments is a natural hydrous basalt(10,084)with modal mineralogy plagioclase(40%),iddingsitized olivine(25%),clinopyroxene(20%),matrix(10%)and minor iron titanium oxide(5%)from the Yichuan—Ruyang region in west Henan province,China.Table 1 shows the composition of the starting material(Zhou et al.1998).
Two series of experiments(temperature series and pressure series)were conducted in the multi-anvil apparatus in the Key Laboratory for High Temperature and High Pressure Study of the Earth’s Interior,Institute of Geochemistry,Chinese Academy of Sciences.Run conditions and the experimental protocol and conf iguration of charges for multi-anvil experiments were same with those described by Zhang et al.(2019).Fine-ground powder samples were loaded into 3 mm long graphite containers with inner diameter 4 mm,and placed between 1 mm thick graphite discs at each end.The pressure transmitting medium was pyrophyllite.In the‘‘temperature series’’,charges were held at 0.6 GPa and 1460°C for 1 h,then rapidly cooled isobarically to crystallization temperatures of 860°C,915°C,or 970°C,and held for 100 h before quenching.In the‘‘pressure series’’,the charges were brought to superliquidus conditions(1460°C and 0.6 GPa,1490°C and 1.1 GPa,1515°C and 1.6 GPa,1540°C and 2.1 GPa,or 1570°C and 2.6 GPa)for 1 h,and then rapidly and isobarically cooled to an identical crystallization temperature of 970°C and annealed for 100 h.All samples were quenched by shutting off the electric power.Experimental conditions are reported in Table 2.Run products were mounted in an epoxy disc and carefully polished for EMP and LA-ICP-MS analysis.
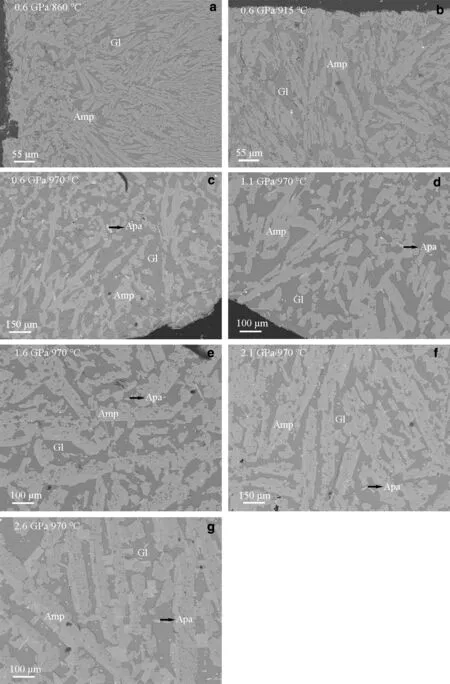
◀Fig.1 BSE images of experimental charges at 0.6—2.6 GPa and 860—970°Cillustrating coexisting mineralsand glassand theincrease in crystal size of amphibole with increasing pressure or temperature.Amp amphibole,Apa apatite,Gl glass
2.2 Analytical techniques
Major element compositions of phases were analyzed with the JEOL JXA-8100 electron microprobe at the Institute of Geology and Geophysics,Chinese Academy of Sciences.An accelerating voltage of 15 kV and beam current of 20 nA were employed.For mineral analysis,the beam diameter was 1—5μm and a slightly defocused beam of 10μm diameter was used for glass.Na and K were counted in the f irst pass to reduce the problem of Na and K loss during analyses(Morgan and London 2005).Major element compositions of amphibole and glass in the experimental products are reported in Table 2.Experimental charges were analyzed for trace elements by LA-ICP-MS(Agilent 7700X)at the State Key Laboratory of Ore Deposit Geochemistry,Institute of Geochemistry,Chinese Academy of Sciences.Laser sampling was performed using a Coherent GeolasPro laser ablation system(193 nm wavelength).Analytical methods are available in Huang et al.(2016).Each analysis incorporates an approximately 15 s background acquisition(gas blank)followed by 50 s data acquisition from thesample.Analytical spots(44μm)were ablated by 160 successive laser pulses(4 Hz).Every 5—6 sample analyses were followed by one analysis of NIST SRM 610 in order to correct the time-dependent drift of sensitivity and mass discrimination.Data reduction was performed by ICPMSDataCal(Liu et al.2008).Trace element compositions of amphibole and glass in the experimental products are summarized in Table 3.
3 Results
3.1 Description of run products
All of seven runs yielded amphibole-glass pairs that were suitable for the determination of trace element partition coeff icients(Fig.1,Table 2).The experimental phase assemblages are dominated by amphibole(Amp),glass(Gl).Some experiments also include accessory apatite(Apa),spinel(Sp),albite (Ab)or magnetite (Mt).Backscattered electron(BSE)images of the experimental charges illustrate the increasing crystal size of euhedral amphibole with increasing pressure or temperature.At 0.6 GPa and 860°C,amphibole is about 80μm in the maximum size and distributed within the glass(Fig.1a).Amphibole-glass contacts are straight without any resorption textures.Furthermore,at 0.6 GPa and 970°C,euhedral amphibole crystal of~100μm formed together with slightly smaller apatite(Fig.1c).Amphibole crystal about 300μm formed,which coexists with large,block apatite crystals at 2.6 GPa and 970°C(Fig.1g).
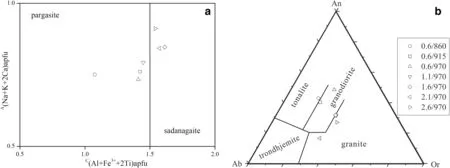
Fig.2 Classif ications of amphibole and glass in the experimental products.a Calcium amphibole and their compositional boundaries,showing thecrystallineamphibolesat 0.6—1.1 GPaand 1.6—2.6 GPafall in pargasiteand sadanagaitef ields,respectively.Thecalcium amphibolesdef ined by B(Ca+ΣM 2+)/ΣB≥0.75 and BCa/ΣB≥ΣM2+/ΣB.b CIPW normative An-Ab-Or plot for quenched glasses,showing therun liquidsfall in tonalite and granodiorite f ields at 0.6 GPa but fall in granodiorite to granite with increasing pressure.0.6/860 means crystallization pressure P(GPa)and temperature T(°C)in the legend
3.2 Amphibole and glass compositions
Amphibole and glass have homogeneous major and trace element compositions in each run(Table 2,3),and their classif ication is shown in Fig.2.According to the recommendations of Hawthorne et al.(2012),all the experimental amphibolesbelong to thecalcic amphibolecategory and are classif ied pargasite/sadanagaite and have Mg#=50—60[Mg#=molar(100×MgO/(MgO+FeO))].Figure 2a showsthe crystallineamphibolesat 0.6—1.1 GPaand 1.6—2.6 GPa fall in pargasite and sadanagaite f ields,respectively.From the CIPW normative An-Ab-Or plot for quenched glasses,Fig.2b shows the run liquids fall in tonalite and granodiorite f ields at the lower pressure(0.6GPa)but in granodiorite to granite at the higher pressures(1.1—2.6 GPa).Most trace elements are present in smaller amounts in amphibole than those in coexisting glass,but the concentrations of medium to heavy rare earth elements of amphibole are greater than those in the glass(Table 3).
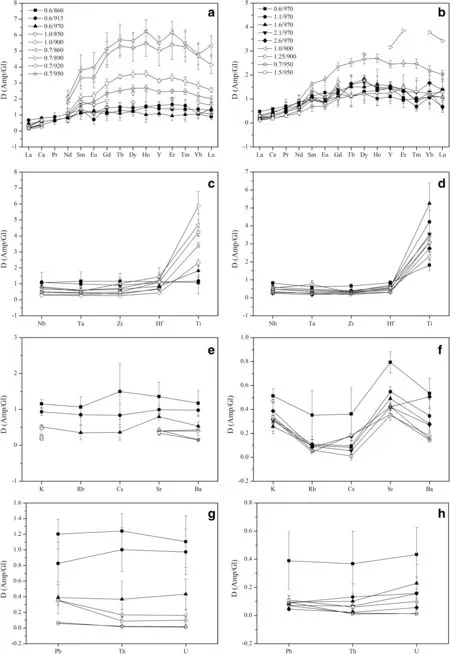
Fig.3 Trace elements partition coeff icients(Di)between amphiboles▶and glasses from this study and available literature studies.a,b Partition coeff icients for REE;c,d Partition coeff icients of high-f ield strength elements(Nb,Ta,Zr,Hf,Ti);e,f Partition coeff icients of large ion lithophile elements K,Rb,Cs,Sr and Ba;g,h Partition coeff icients for actinides(U,Th)and Pb;i,j Partition coeff icients of transition metals(Sc,V,Cr).The legends of temperature series runs and the pressure series runs are shown in f igure a and b,respectively.0.6/860 means crystallization pressure P(GPa)and temperature T(°C)in the legend.Open symbols data from previous literature.1.0/850,900:Klein et al.(1997);0.7/860,890,920,950:Nandedkar et al.(2016);1.25/900:Qian and Hermann(2013);1.5/950:Wan et al.(2009)
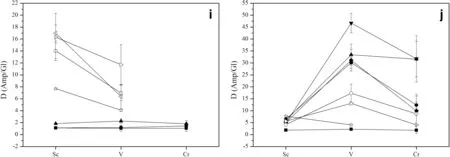
Fig.3 continued
4 Discussion
4.1 Attainment of equilibrium
The attainment or close approach to thermodynamic equilibrium of crystallization during the experiment is an important prerequisite for accurate trace element partitioning coeff icient.Although we did not perform reversal experiments,there are two arguments that suggest close approximation to equilibrium.Firstly,the experimental duration(100 h)of our study is longer than previous studiesthat haveobserved attainment of equilibrium(Klein et al.1997;Klemme et al.2002;Adam and Green 2006;Nandedkar et al.2014).Secondly,the homogeneous composition of the quenched experimental products as indicated by the average standard deviations of less than<5%for major elements(Table 2)and of less than<10%for trace elements(Table 3)further support our interpretation that major and trace element equilibrium was achieved.
4.2 Trace element partitioning
Amphibole-glass partition coeff icients(Di)calculated from the average trace element concentrations are listed in Table 4 and summarized in Fig.3.Uncertainties in the coeff icients are estimated by error propagation from analytical uncertainties in the individual phase.
4.2.1 Rare earth elements
The amphibole—glass partition coeff icients for REE in the temperature series products are illustrated in Fig.3a.The light rare earth elements(LREE:La—Nd)are incompatible elements with the exception of Nd at 0.6 GPa and 915°C.In contrast,medium to heavy rare earth elements(MREEHREE:Sm—Lu)are compatible apart from Lu at 0.6 GPa and 915°C,and Er and Lu at 0.6 GPa and 970°C.This observation is consistent with the results from Nandedkar et al.(2016).The compatibility of HREE is slightly increasing with increasing atomic number except the Yb at 0.6 GPa and 915°C.The behavior of Y isanalogousto that of HREE due to its identical valence and similar cation radius.It is worthy note that the DREE(with the exception of Yb and Lu)slightly increaseat 915°Cand then decrease at 970°C.
Moreover,most REEshow acontinuous,smooth change in their D values for amphibole-glass with increasing P in the pressure series products(Fig.3b).All of the LREE are incompatible elements,and the DLREEdecrease with increasing pressure at isothermal 970°C.But almost all of MREE and HREE are compatible elements apart from Sm at 1.1 GPa,Eu,Tm and Lu at 1.1 GPa to 2.1 GPa.Additionally,the most compatible rare earth element in the amphibole structure is dysprosium(Dy)in agreement with previous studies(Klein et al.1997;Nandedkar et al.2016).
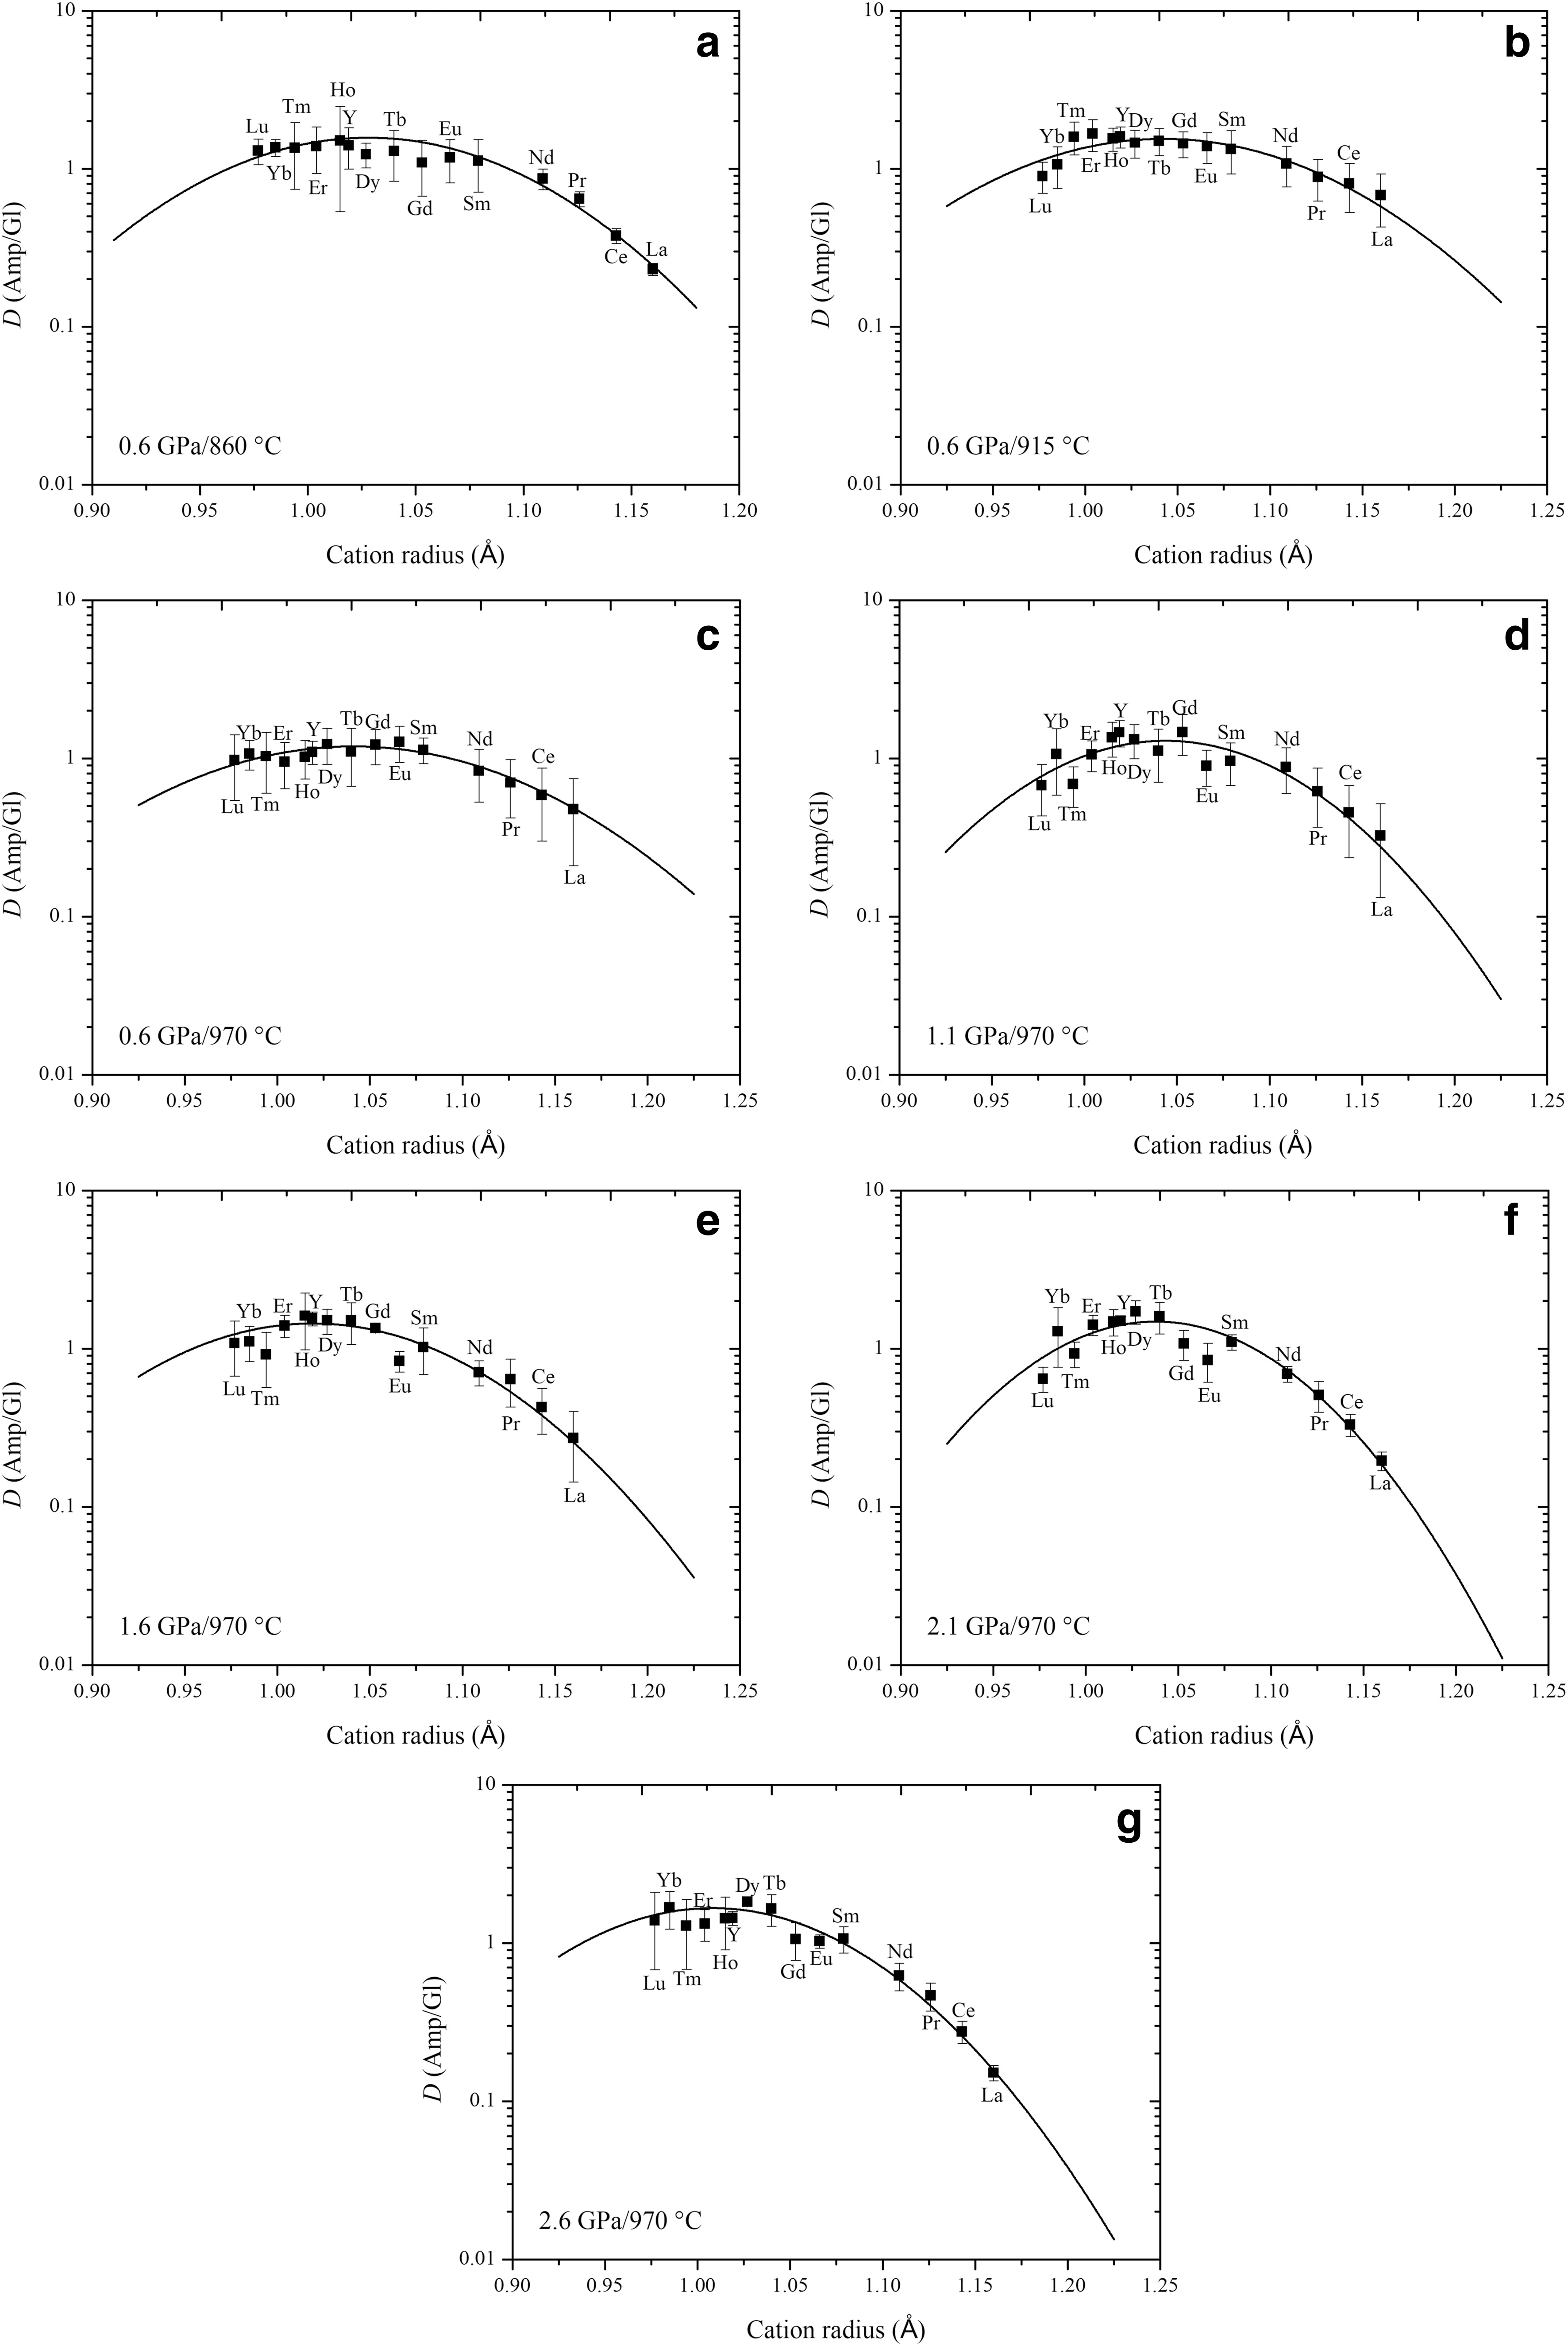
Fig. 4 Onuma diagrams, log (D) versus cation radius, for REE▶partition coefficients between amphibole and glass. Curves are fits of Eq. 1 to the data. Measuring these partition coefficients for REE show parabolic behavior. The REE3+ cations enter M4 site in amphibole from the temperature series products (a—c) and the pressure series products (d—g)
Thepartition coeff icientsfor some MREE(Eu,Tb,and Dy)and HREE(Tm and Yb)are positively proportional to pressure at 0.6—2.6 GPa and 970°C.
4.2.2 High-f ield strength elements
HFSEare tetra-or penta-valent cations such as Nb,Ta,Zr,Hf,and Ti.The amphibole—glass partition coeff icients for HFSE in the temperature series products are plotted in Fig.3c.The partition coeff icients of HFSE are>1 at 0.6 GPa and 860°C.But the HFSE become weakly compatible with incompatible as the temperature increases from 860 to 970°C at 0.6 GPa,with the exception of Ti,which is compatible in the amphibole,as also shown in previous studies(Tiepolo et al.2007;Nandedkar et al.2016).
Nb,Ta,Zr,and Hf are incompatible and their partition coeff icients are generally<1 in the pressure series,but the DTiis greater than one(Fig.3d).In addition,the HFSE(with the exception of Ti)partition coeff icients tend to decrease as the pressure increases from 0.6 to 2.6 GPa at 970°C.In summary,the partition coeff icients for HFSE increase with decreasing temperature or pressure,and the Ti is more compatible than other HFSE.
4.2.3 Large ion lithophile elements
Besides the result of 0.6 GPa and 860°C,the LILE are incompatible elements with partition coeff icients generally below 1 in the temperature series and the pressure series(Fig.3e,f).In the temperature series products,the LILE are weakly compatible with moderately incompatible with increasing temperature at 0.6 GPa.Thepartition coeff icient of the potassium(K)in this study indicates the same trend relative to Klein et al.(1997)and decreaseswith increasing temperature,but Nandedkar et al.(2016)show an opposite trend.In the pressure series products,the partition coeff icients for most LILE exhibit a negative correlation with pressureat 0.6—2.6 GPaand 970°C.Moreover,DLILEfrom the pressure series experiments show a uniform pattern when plotted against the atomic number in agreement with previous studies(Wan et al.2009;Nandedkar et al.2016),with the exception of Cs,Sr,and Ba in the run of 2.6 GPa and 970°C and Cs,Sr in the study of Qian and Hermann(2013).Another similarity is the maximum partition coeff icient for Sr except for Ba at 2.6 GPa and 970°C.
4.2.4 Actinides
Uranium(U)and thorium(Th)amphibole—glass partition coeff icients are reported in Fig.3g,h together with the partition coeff icient for Pb.Besides the result of 0.6 GPa and 860°C,the actinides elements are incompatibleelements with partition coeff icients below 1 in the temperature series and the pressure series.Th and U show decreasing partition coeff icients with increasing temperaturewith DThvarying from 1.24 to 0.37 and DUfrom 1.1 to 0.43.Similar to temperature series,U and Th show a consistent decrease in partition coeff icients between 0.6 and 2.6 GPa.DPbdisplays a decrease with increasing temperature or pressure.However,our data show substantially higher partition coeff icients for actinides than that in previous studies(Klein et al.1997;Nandedkar et al.2016).Probably,the result has to do with the relatively lower silica concentration of glasses from this experiment.
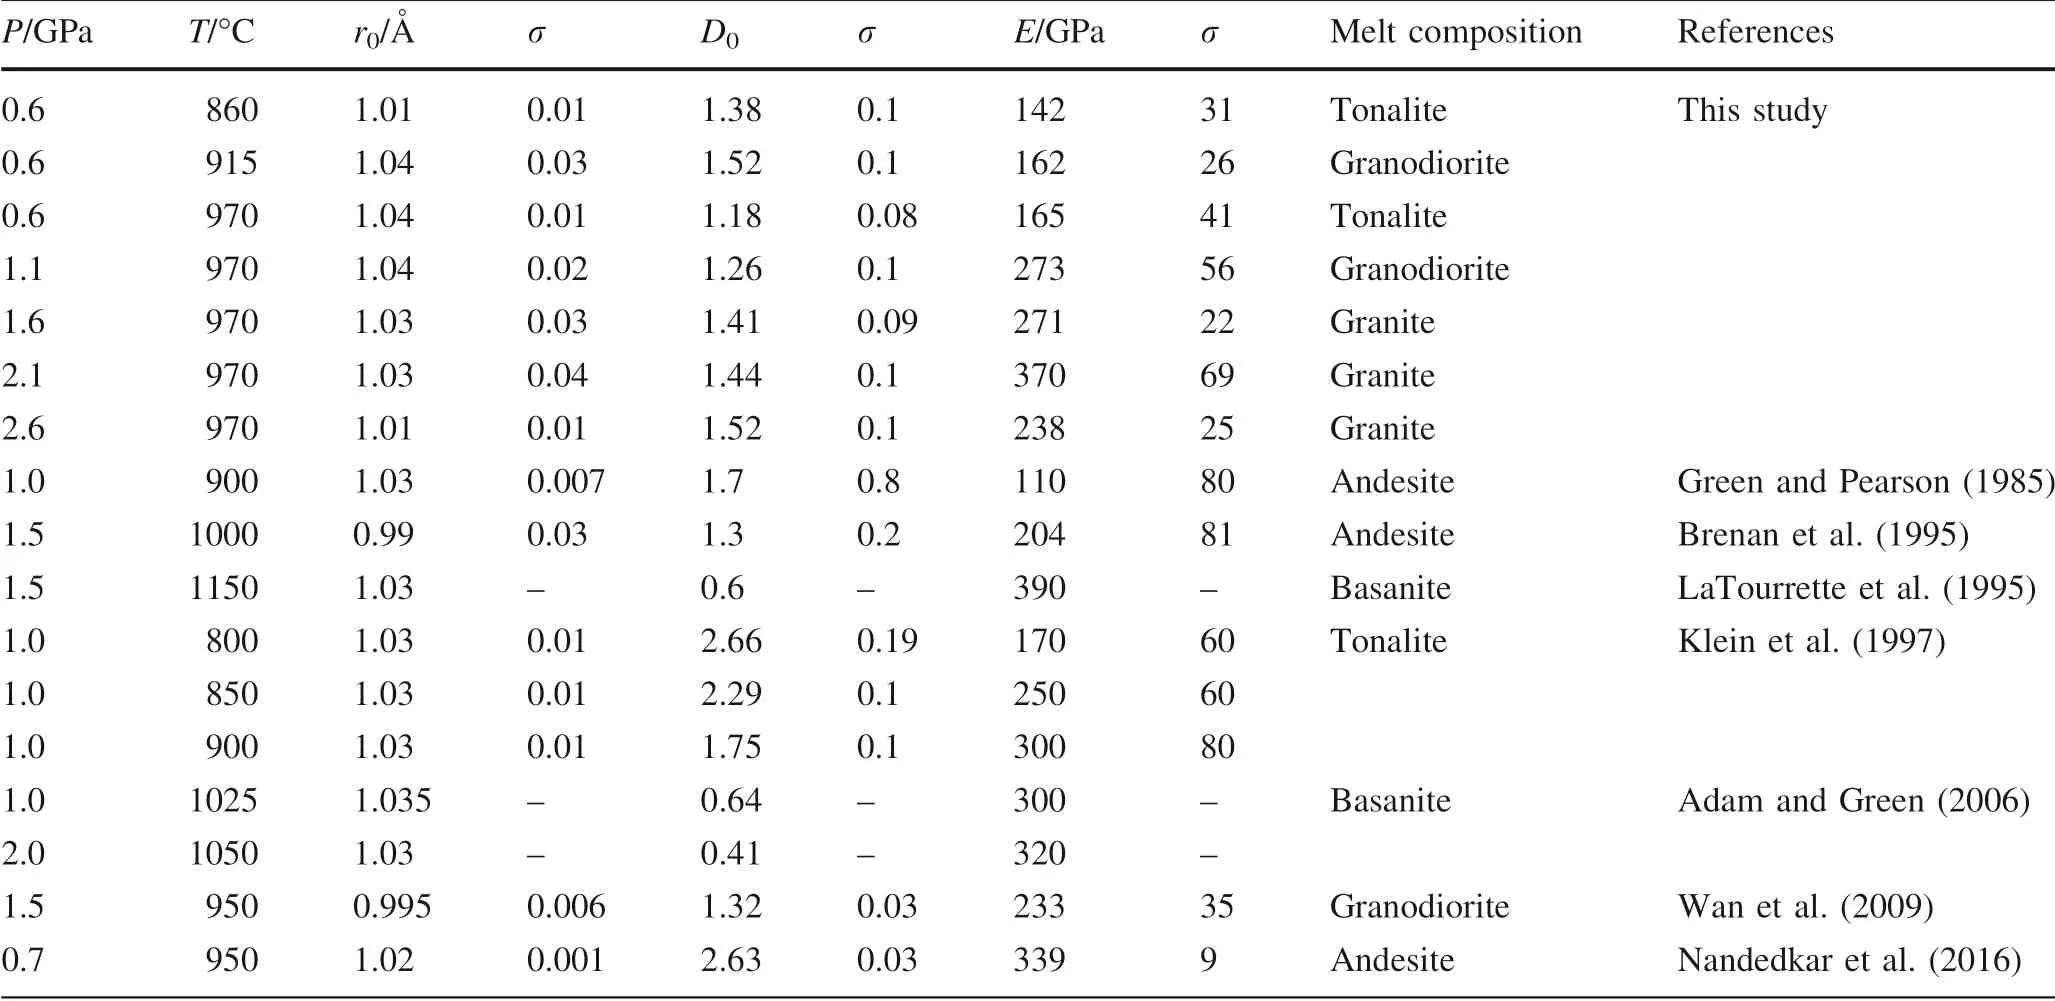
Table 5 Fitting parameters used in the lattice strain model for REE3+cations in amphibole
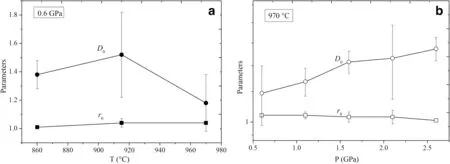
Fig.5 Change of f itting parameters r0,D0 of the REE with increasing T at isobaric 0.6 GPa(a),and increasing P at isothermal 970°C(b)
4.2.5 Transition metals
The partition coeff icients for transition metals are rarely reported in the literature.Threetransition metals,Sc,V and Cr,are investigated in this study(Fig.3i,j);all of them are compatible elements and their partition coeff icients positively correlate with temperature,with DSc,DV,and DCrranging from 1.11 to 1.85,1.06 to 2.26,and 1.05 to 1.82 at 860—970°C,respectively.Similarly,their partition coeff icients trend to increase with increasing pressure.For V and Cr,there is a notable increase in partition coeff icients between 0.6 and 1.1 GPa.Nandedkar et al.(2016)suggested the substantial increase of D for transition metals is related to change of the melt structure.
4.3 D Amp-GlREE with the lattice strain model
The inf luence of cation radius(Shannon 1976)on partitioning behavior for trace elements has been described by many publications(Onuma et al.1968;Brice 1975;Blundy and Wood 1994;Wood and Blundy 1997;Blundy and Wood 2003).The relationship,Lattice Strain Model-LSM,

relates the Nernst partition coeff icients of elements i(Di)for isovalent cations in crystals and melts as a function of cation radius(ri),the strain-free partition coeff icient(D0)that has an ionic radius r0equal to the strain-free lattice size of the crystallographic site,and an elastic constant E(apparent Young’s modulus)that is specif ic to the host cation site.NAis Avogadro’s constant,R is the universal gas constant,and T is temperature in Kelvin.
According to the lattice strain model,the r0,D0,and E are estimated by combining with the partition coeff icients of trivalent REE between amphiboles and silicate glasses.Partition coeff icients versus cation radius for the REE3+cationsentering M4 siteof amphiboleareplotted in Fig.4,these Onuma diagrams display the parabolic shape.A set of parabolas have the following ranges in f itting parameter values for the M4 site of amphibole,r01.01—1.04 A˚,D01.18—1.38,and E 142—165 GPa at 0.6 GPa and 860—970°C (Fig.4a—c,Table 5).Although some previous studies suggested that the D0decreases with increasing temperature(Klein et al.1997;Nandedkar et al.2016;Shimizu et al.2017),our D0hasthe maximum value at 0.6 GPa and 915°C rather than at 860°C(Fig.5a).Nevertheless,the D0trends to decrease at the range of 860—970°C.Furthermore,Shimizu et al.(2017)verif ied that D0positively correlates with the silica content of the coexisting glass.The maximum REE partition coeff icient D0corresponds with the highest silica content of the coexisting glass at 0.6 GPa and 915°C.For example,the REEareeasier enriched in amphiboleif thequenched glass is granodiorite or granite in this study,and the D0values are similar to the result of Wan et al.(2009).However,the D0between amphibole and tonalitic glass(Klein et al.1997)and between amphibole and andesitic glass(Green and Pearson,1985;Brenan et al.1995;Nandedkar et al.2016)are greater compared to amphibole-basaltic glass pair(LaTourrette et al.1995;Adam and Green 2006).Thus,glass composition exerts the dominant control on the incorporation of REE on the M4 site of amphibole at 0.6 GPa and 860—970°C.
In addition,thef itting parametersare r01.01—1.04 A˚,D01.18—1.52,and E 165—370 GPa at 0.6—2.6 GPa and 970°C(Fig.4c—g,Table 5).Amphibole-glass REE partition coeff icients have been shown to negatively correlate with P in some previous studies(Adam and Green 1994,2003;Dalpe´and Baker 2000),but our D0increases with increasing pressure(Fig.5b).In the‘melt model’from Shimizu et al.(2017),the D0negatively correlates with Ti and Ca contents in the glass,and the pressure series shows the same result in this study.Thus,the effect of pressure is signif icant for the partition coeff icient of REE between amphibole and coexisting glassat 0.6—2.6 GPa and 970°C.The ideal radius r0of amphibole M4 is almost constant both temperature series and pressure series,and the E trends to increase with increasing temperature or pressure(with the exception of 2.6 GPa).
5 Conclusions
The calcic amphibole is a suff iciently dominant mineral phase from crystallization of hydrous basalt melts at 0.6—2.6 GPa and 860—970°C,and the coexisting glass compositions are tonalite,granodiorite,and granite.
The LREE are dominantly distributed in the glass rather than the amphibole in this study.In contrast,most MREE and HREEarecompatiblein amphibole.These patternsare in good agreement with previous f indings,with the REE becoming increasingly compatible with decreasing ionic radius(Klein et al.1997;Wan et al.2009;Nandedkar et al.2016).It is notable that at 0.6 GPa,the(with the exception of Yb and Lu)slightly increase at 915°C but then decrease at 970°C.Similarly,thefor REE increases at 915°C and then decreases at 970°C.However,thevalues positively correlate with the pressure for REE in the amphibole-glass pairs.Furthermore,the derived best-f it values forandare almost constant and trend to increase with rising temperature or pressure,respectively.Although the LILE,HFSE(except the Ti),and actinides show a continuous decrease in compatibility with increasing temperature or pressure,the D of transition metals is inversely proportional to the T-P conditions in these experimental series.The experimental observations strongly suggest that the melt compositions play an important role to control the partition coeff icient between amphibole and glass.The REE become more enriched in amphibole if the quenched glass is granodiorite or granite compared to the tonalitic glasses.
AcknowledgementsWe wish to thank Ms.Zhihui Dai for her assistance during LA-ICP-MSanalyses.This work benef ited from the f inancial support of the National Natural Science Foundation of China(Grant Nos.41274105 and 41772043),the Joint Research Fund in Huge Scientif ic Equipment(U1632112)under cooperative agreement between NSFCand CAS,the Chinese Academy of Sciences‘‘Light of West China’’Program(Dawei Fan,2017),Youth Innovation Promotion Association CAS(Dawei Fan,2018),the Strategic Priority Research Program(B)of the Chinese Academy of Sciences(XDB 18010401),the CPSF-CAS Joint Foundation for Excellent Postdoctoral Fellows(Grant No.2017LH014),and China Postdoctoral Science Foundation(Grant No.2018M631104),the Guizhou Provincial Science and Technology Foundation(20171078),and the Guizhou Institute of Technology Foundation(XJGC20130901).
- Acta Geochimica的其它文章
- Triple oxygen isotope constraints on the origin of ocean island basalts
- The enhanced element enrichment in the supercritical states of granite-pegmatite systems
- Rare-earth and trace elements and hydrogen and oxygen isotopic compositions of Cretaceous kaolinitic sediments from the Lower Benue Trough,Nigeria:provenanceand paleoclimatic signif icance
- The contribution of bacteria to organic matter in coal-measure source rocks
- Using trace elements of magnetite to constrain the origin of the Pingchuan hydrothermal low-Ti magnetite deposit in the Panxi area,SW China
- Mercury speciation,bioavailability and risk assessment on soil-rice systems from a watershed impacted by abandoned Hg mine-waste tailings

