
Effect of grazing time and intensity on growth and yield of spring wheat (Triticum aestivum L.)
2019-05-10 06:14:00KetemaTilahunZeleke
Ketema Tilahun Zeleke
1 School of Agricultural & Wine Sciences, Charles Sturt University, Wagga Wagga, NSW 2650, Australia
2 Graham Centre for Agricultural Innovation, Wagga Wagga, NSW 2650, Australia
Abstract A simulated grazing f ield experiment was conducted to determine the effect of timing and intensity of grazing on the growth and yield of a mid-late maturing spring wheat (cv. Flanker) under different watering regimes, at Wagga Wagga in southeastern Australia. The experiment was a factorial design of watering regime and pasture “grazing” as factors, with three replications. The two watering regimes were rainfed (R) and supplemental irrigation (I). There were four simulated grazing treatments: no grazing, “crash” grazing by mowing to 5 cm height on 13 June (Cut1-5), “crash” grazing by mowing to 5 cm on 15 July (Cut2-5) and “clip” grazing by mowing to 15 cm height on 15 July (Cut2-15). The lowest dry matter (simulated grazing) was obtained from RCut1-5 (0.13 t ha-1) and the highest (0.86 t ha-1) was from ICut2-5. There was no signif icant difference (P<0.05) among the grain yields of the grazing treatments in the respective watering regimes. However, there was signif icant difference (P<0.05) between the grain yields of the rainfed (3.60 t ha-1) and irrigated (6.0 t ha-1) treatments. Under both watering regimes, the highest grain yield was obtained from the late “clip” grazings: 3.79 t ha-1 (RCut2-15) for rainfed and 6.47 t ha-1 (ICut2-15) for irrigated treatments. The lowest grain yield for the rainfed treatment was 3.26 t ha-1 (RCut1-5) and for the irrigated treatments, the lowest grain yield was 5.50 t ha-1 (ICut2-5). Harvest index (HI) was not signif icantly affected (P>0.05) by either the watering regime or grazing. Seed weight was signif icantly (P<0.05) affected both by the watering regime and grazing with the lowest value for 1 000-seed weight of 30.05 g (RCut2-5) and the highest value of 38.00 g (ICut2-15). Water use eff iciency was signif icantly (P<0.05) affected both by the watering regime and grazing with the lowest value of 9.94 kg ha-1 mm-1 (ICut2-5) and the highest value 13.43 kg ha-1 mm-1 (RCut2-5). By “crash” grazing late (just before stem elongation stage) to a height of 5 cm, a signif icantly higher (P<0.05) above ground dry matter can be grazed without signif icantly affecting the yield both in seasons with low amount of rainfall and high amount of rainfall (irrigated in this study) although in a wet season a slightly lower (15% lower) grain yield is obtained relative to “clip grazing” to 15 cm height. Grazing of mid-late maturing wheat cultivars has the potential to f ill the feed gap without signif icantly affecting grain yield.
Keywords: dual-purpose crop, productivity, simulated grazing, wheat
1. lntroduction
In a mixed farming system, reliable and quality feed availability is essential for sustainable livestock production. However, in semi-arid environments such as in southeastern Australia, this is not always the case; in autumns, the pasture is still recovering from dry and hot summer and in winters its growth is limited by low temperature. One of the commonly used strategies to f ill the feed gap during this period (April-August) is grazing of winter crops in a way that will not (signif icantly) affect the grain yield and still provide the much needed feed hence the crops called dual-purpose crops (Harrison et al. 2011a). In addition to the main goal of livestock feed availability, grazing of earlysown winter crops has been reported to have positive effects on crop yield by reducing above ground dry matter growth, delaying f lowering, and short plant stature (Winter and Thompson 1990; Dean 2007). These factors, respectively, can conserve soil water, minimise the risk of frost damage, and reduce lodging. On the other hand, Edwards et al. (2011) reported that early sown dual-purpose crops have lower yield than grain-only crops sown in the optimal sowing window. However, the general consensus is that, if properly managed, dual-purpose crops provide the farmers with the opportunity of generating income both from forage and grain (Browne et al. 2013).
Due to their slow maturing characteristics, winter varieties of wheat and canola offer relatively long period of grazing and produce substantial amount of dry matter for grazing before reaching the stage unsafe for grazing and hence are the most commonly studied and used dual-purpose crops (Kirkegaard et al. 2016). However, not all the environments and seasons are suitable to grow winter wheat or canola cultivars. Early rainfall breaks (as early as February/March), the recommended sowing time of dual-purpose winter-type wheat varieties, are not common in most of the wheat-belt regions of Australia. Under such conditions, the typical grain-only spring wheat varieties can also be sown early, say in April, and grazed without signif icantly reducing grain yield (Kirkegaard et al. 2016). While there are many reported studies on the performance of dual-purpose wintertype wheat vary in Australia and elsewhere (Winter and Thompson 1990; Arzadun et al. 2006; Kelman and Dove 2009; Harrison et al. 2011b), there is only limited information on the potential, performance and resource use of spring wheat for grazing and grain production.
Concurrent measurement of changes in soil water content, evapotranspiration, canopy growth and dry matter production of dual-purpose crops in general, and spring wheat in particular is required to understand and evaluate the performance of these crops. Some studies show that defoliated crops conserve soil water (Edwards et al. 2011) while others report increased soil water use due to defoliation (Kelman and Dove 2009). The research questions are: Will grazing of spring wheat have effect on grain yield, grain quality (size), and harvest index and water use eff iciency? Grazing of the crop to the ground level or grazing at progressively later stages of growth would be expected to have different effects on grain yield. The objective of this study was to evaluate the effect of simulated grazing of different intensities and timing on dry matter production, crop growth and yield, and water use of a mid-late maturing spring wheat cultivar (cv. Flanker) sown at the beginning of its recommended sowing window (4th week of April) in south-eastern Australia.
2. Materials and methods
The f ield experiment was conducted at f ield experimental site of Wagga Wagga Agricultural Institute (34.930°S, 147.767°E), Riverina region of south-eastern Australia. The region is a major agricultural area for mixed farming, cropping and livestock production. The soil type is a sandy clay loam Red Kandosol (Isbell 2002) with its hydrologic characteristic as shown in Table 1.
2.1. Experimental site and setup
In arid and semi-arid regions such as in south-eastern Australia, high year to year rainfall variability is the major constraint for crop and pasture production. It is expected that the performance of dual-purpose crops is affected by this variability. Conducting an experiment in one season, but subjected to different watering regimes to simulate year to year variability, can provide a more reliable evaluation as the effects of other factors which vary from year to year are minimised. Therefore, this study was conducted by creating a dry season (as the winter season rainfall during the experimental season was only 50% of the long term average) scenario and a wet season scenario by using supplemental irrigation.
The soil of the experimental site is a sandy clay loam Red Kandosol with soil organic carbon of 1.4% and p H of 6.5 (Zeleke et al. 2011). The experimental area had 24 experimental plots and 24 buffer plots. The plots were 5 m long and 1.8 m wide (standard experimental plot widths for sowing and harvesting machineries) with 0.5 m gaps (access area for sampling, monitoring and data collection) between the plots. Experimental plots were physically and hydrologically separated by buffer plots. The experiment was a factorial design, with watering regime and pasture “grazing” as factors, with three replications. There were two watering regimes: rainfed/dryland and supplemental irrigation. Soil moisture content was measured using neutron probe. One neutron probe access tube per plot was installed to a depth of 1.5 m, a total of 24 access tubes. Soil moisture content measurement was conducted at 15, 30, 45, 60, 90, and 120 cm depths at two to three weeks interval; small depth interval (15 cm) was used for depths where much of the crop root is expected. Wheat (cv. Flanker) was sown on 20 April for a target population of 120 plants m-2. At the time of sowing, nitrogen fertiliser (urea) was applied to all the plots at a rate of 120 kg N ha-1and on 17 July at a rate of 50 kg N ha-1. In addition to these commonly used rates in the area, as nitrogen could be leached from the root zone of the irrigated plots and to avoid nitrogen being a limiting factor in the vigorously growing crops, an additional 50 kg N ha-1was applied to the irrigated plots.
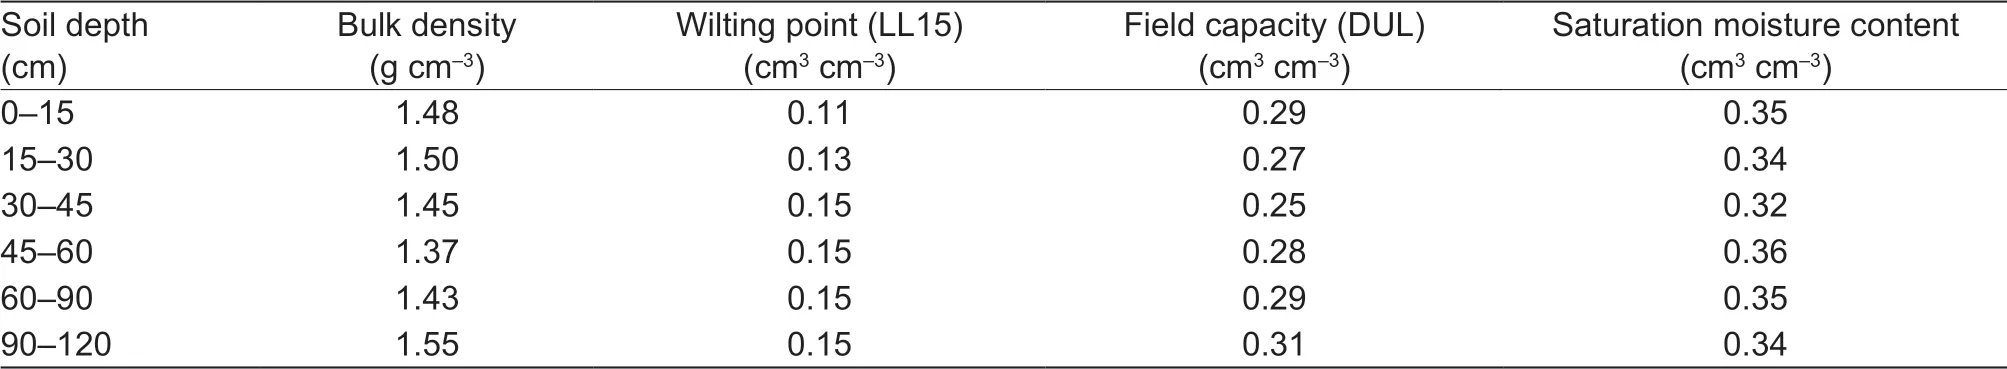
Table 1 Hydrologic properties of the Red Kandosol soil at Wagga Wagga, New South Wales, Australia1)
2.2. Rainfall and irrigation
The weather data were obtained from the off icial website of the Australian Bureau of Meteorology (http://www.bom.gov.au/nsw/observations/index.shtml) and the Scientif ic Information for Land Owners (SILO) Climate Data Base (Jeffrey et al. 2001). The mean annual and cropping season (April-October) rainfall is 515 and 330 mm, respectively. The rainfall during the experimental season (April-October) was only 167 mm (50% of the long term average). Long-term annual maximum and minimum temperatures are 22.5 and 9.2°C, respectively. Supplemental irrigation was applied using drip irrigation system. For each irrigated plot, four drip laterals with pressure compensated drippers of 1.6 L h-1f low rate and 30 cm spacing were used. Automatic valve was used to control the amount of irrigation. The climate data and amount of irrigation summarised on monthly basis is given in Fig. 1.
2.3. Crop data measurement
The green crop canopy growth was monitored using GreenSeeker®(NTech Industries Inc., Ukiah, CA, USA), a handheld remote sensing tool that determines normalized difference vegetative index (NDVI). It measures the proportion of green-coloured material in the f ield against the background of exposed soil (Holzapfel et al. 2009). On 13 June, at about Zadoks growth stage 25 (GS25) (Zadoks et al. 1974), the above ground part of the plant was cut at a height of 5 cm, to simulate “crash” grazing, from the plots assigned to this treatment. This treatment was designated as RCut1-5 for rainfed treatment and ICut1-5 for the irrigated treatment. The plant material was then dried in a drying oven at 70°C for 48 h to determine the weight of dry matter removed. At about just before GS30 (15 July), the plants were defoliated by cutting at two heights from the plots assigned to the respective treatments. These two treatments were set to simulate two grazing intensities. One treatment was cut at 5 cm height (“crash” grazing) and the other treatment at 15 cm height (“clip” grazing). This approach of simulated grazing has also been used in other studies (Arzadun et al. 2006; Seymour et al. 2015). The 5-cm high treatment was designated as RCut2-5 for the rainfed treatment and ICut2-5 for the irrigated treatment. The 15-cm high treatment was designated as RCut2-15 for the rainfed treatment and ICut2-15 for the irrigated treatment. The plant material was dried in a drying oven at 70°C for 48 h and the respective dry matter weight was determined. The simulated cut times represent the ends of “grazing” at these respective dates.
At maturity, a 2-m length of each experimental plot was harvested by mechanically cutting the plants at the ground level. The plant material was then dried in a drying oven at 70°C for 48 h. The above ground dry matter was weighed and the grains trashed out using a mechanical trasher. The collected grain was cleaned and weighed to determine the grain yield. Then, 1 000 seeds were passed through a seed counter to determine the seed weight. The harvest index was determined as the ratio of harvested grain yield to the above ground dry mater.
2.4. Crop evapotranspiration calculation using soil water balance
Crop evapotranspiration (ET) was determined using the following soil water balance equation:

Where, R is the rainfall (mm), I the amount of irrigation (mm), Dpis drainage below the root zone (mm) which was taken as 90 cm, and ΔS is the change in soil water storage. Rfis surface runoff (mm); there is no major rainfall event to cause runoff. Eq. (1) then is reduced to:

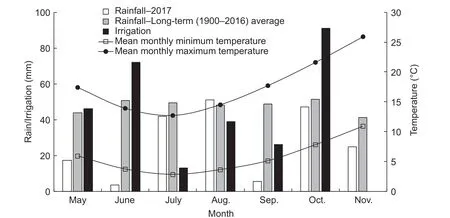
Fig. 1 Long-term mean rainfall, rainfall during the experimental season and irrigation, and mean monthly minimum and maximum temperatures at Wagga Wagga, New South Wales, Australia.
The change in soil water storage ΔS over a time interval t2-t1(days) was calculated as:

Where, z1is the initial depth (mm); z2is the f inal depth (mm); θ is volumetric water content of soil at the given depth and time (cm3cm-3).
Darcy equation was used to estimate the deep percolation (Dp) below the 90-cm depth as:
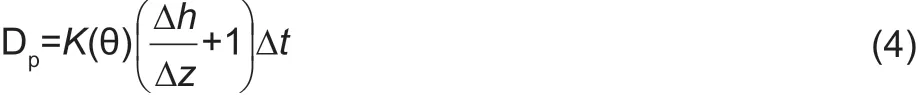
Where, K(θ) is the unsaturated hydraulic conductivity at the water content θ of the soil layer (cm d-1); Δh is matric potential difference between two points (90 and 120 cm depths in this study, respectively) (cm); Δz is the distance (cm) between the two points (120-90=30 (cm) in this case). Soil water retention curve of the soil in the study site was used to determine K(θ) using van Genuchten Closed Form Equation (van Genuchten 1980), the detail of which is given in Zeleke (2014).
2.5. Water use effciency
Water use eff iciency (WUE) was determined as:

Where, Y is grain yield or above ground dry matter (kg ha-1) and ET is crop evapotranspiration (mm).
Irrigation water use eff iciency (IWUE) was calculated as:

Where, Yiis irrigated grain yield, Ydis dryland/rainfed grain yield (kg ha-1) and I is the amount of irrigation (mm).
2.6. Statistical analysis
To detect difference between the watering regimes and the grazing treatments and their interactions, the analysis of variance of crop growth and harvest parameters was done using statistical software R (R Core Team 2013). Signif icance was considered at P<0.05 and Fisher's LSD test was used to detect where differences occurred within signif icant interactions.
3. Results and discussion
3.1. Soil water content
The soil water dynamics, integrated over the rooting depth, is presented in Fig. 2. From sowing to the end of the winter period, the irrigated treatments had higher soil water content than the rainfed treatments. However, at the end of winter, high amount of rainfall in August brought the soil water contents of rainfed and irrigated treatments to almost the same level. Right from the beginning of the spring period, the soil water content of the rainfed treatments decreased sharply as there was almost no rainfall in September (Fig. 1) and crop water demand increased due to increase in temperature. However, irrigation applied to the irrigated plots maintained the soil water content at a high level during this important growth stage, anthesis and grain f illing. Throughout October and beginning of November, the two late-mowed treatments (RCut2-5 and RCut2-15) had depleted more soil water than the other treatments. Fig. 3 and Table 2 also show that these treatments had higher canopy cover than the other treatments during this period. This shows that, during the relatively dry spring period, defoliated wheat depleted more soil water than the undefoliated wheat which might be due to its compensatory growth habit (Harrison et al. 2011b). As shown with the error bars in Fig. 2, at other times there was no signif icant difference (P>0.05) among the respective treatments. During the cooler months with low evapotranspiration, defoliation did not result in major effect on soil water extraction pattern.
3.2. Crop canopy growth
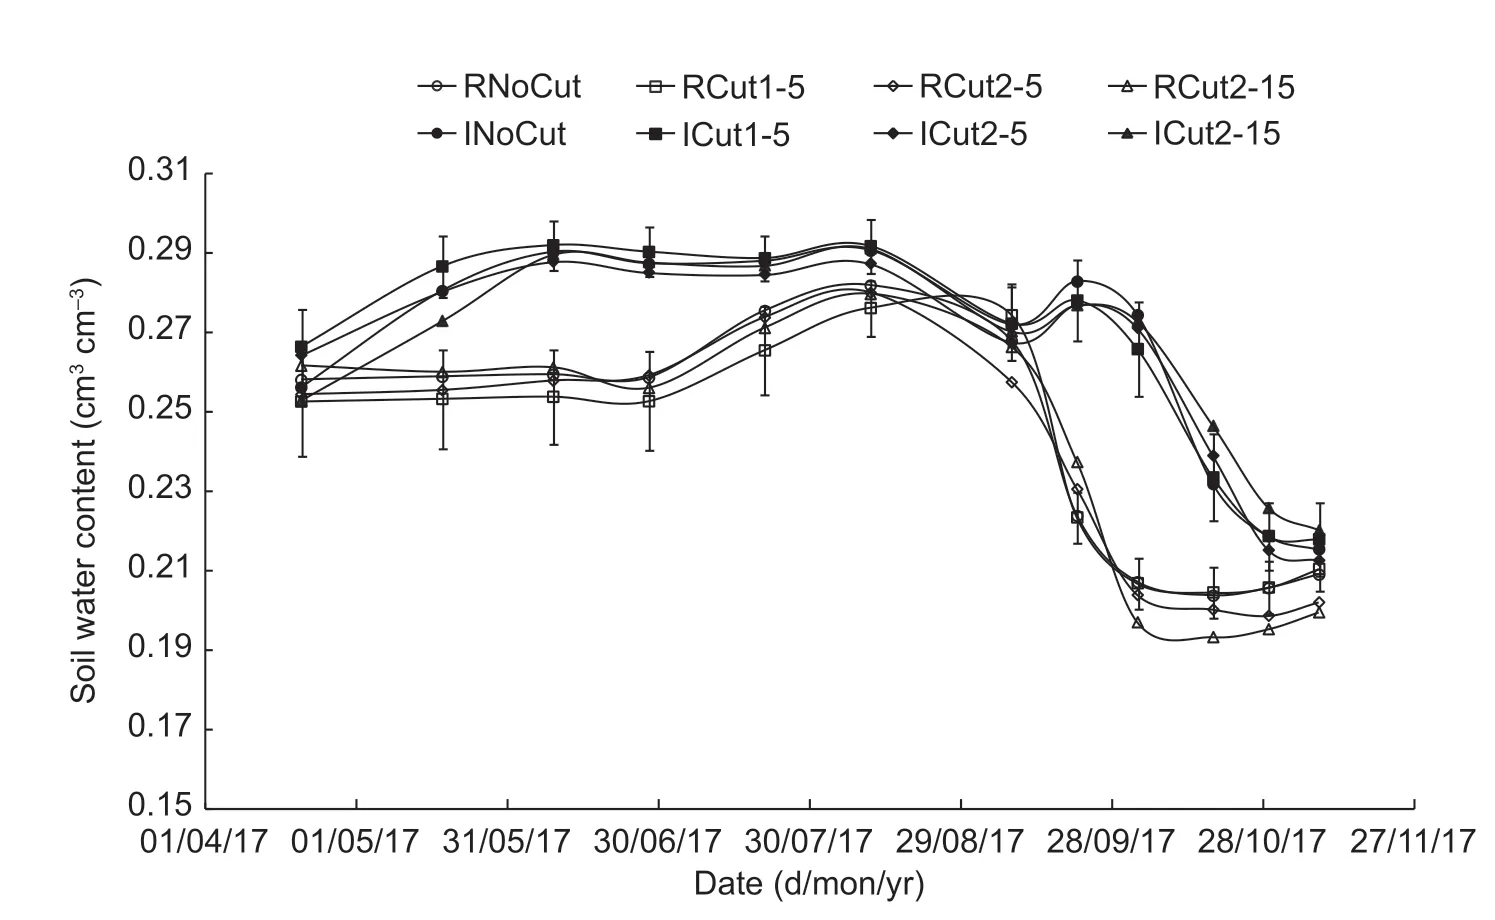
Fig. 2 Soil water content measured over the crop growing season for different grazing and watering regime treatments. Each point is an average of three data records or replications. RNoCut, rainfed non-defoliated; RCut1-5, rainfed defoliated to 5 cm height at Zadoks growth stage 25 (GS25); RCut2-5, rainfed defoliated to 5 cm height at GS30; RCut2-15, rainfed defoliated to 15 cm height at GS30; INoCut, irrigated non-defoliated; ICut1-5, irrigated defoliated to 5 cm height at GS25; ICut2-5, irrigated defoliated to 5 cm height at GS30; ICut2-15, irrigated defoliated to 15 cm height at GS30. Data are mean±SE. n=3.
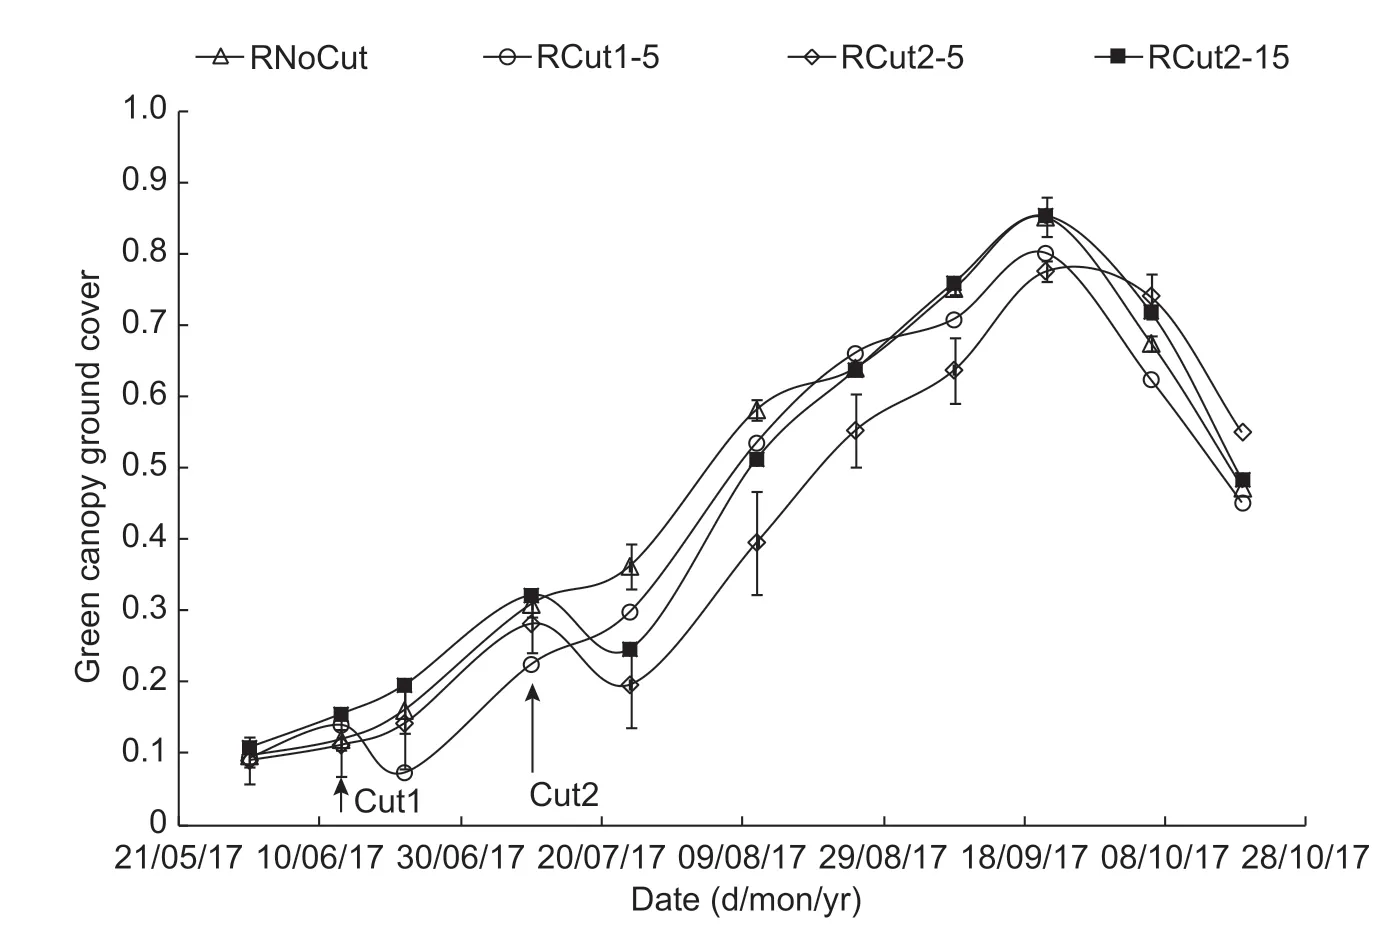
Fig. 3 The green crop canopy ground cover for the grazing treatments of the rainfed treatment during the crop growing season. Each data point is an average of three records/replications. Indicated by the arrows are also the grazing times (Cut1 and Cut2). RNoCut, rainfed non-defoliated; RCut1-5, rainfed defoliated to 5 cm height at Zadoks growth stage 25 (GS25); RCut2-5, rainfed defoliated to 5 cm height at GS30; RCut2-15, rainfed defoliated to 15 cm height at GS30. Data are mean±SE. n=3. For clarity, error bars (SE) were shown only for RNoCut and RCut2-5.

Table 2 Summary of the results of analysis of variance on grain yield, dry matter, plant height, water use efficiency, 1 000-seed weight, harvest index, green canopy cover(at 50%flowering) of a spring wheat for different watering regimes and grazing conditions at Wagga Wagga, south-eastern Australia1)
The evolution of crop canopy cover of the rainfed treatment is shown in Fig. 3. The treatment which was subjected to simulated “crash” grazing at GS25 and “clip” grazing just before GS30 had equal canopy cover to that of non-defoliated treatment. Although RCut2-5 and RCut2-15 were grazed on the same day, the treatment which was cut close to the ground (RCut2-5) took longer to recover. However, towards the end of the season, RCut2-5 had higher canopy cover than the other treatments probably due to the moisture conserved from the slow growth during the winter period (Harrison et al. 2010). Other studies found that less water is depleted from the top 60 cm of soil in intensively grazed treatments and grazed crops use less water during and directly after grazing (Kelman and Dove 2009). At harvest, RCut1-5 had the lowest canopy cover. At the time of the maximum canopy cover, RNoCut and RCut2-15 treatments had the highest (0.853) value. The 50% f lowering stage for non-defoliated treatments was on 4 October while the defoliated treatments reached this stage on 9 October. The unirrigated plots matured and harvested on 8 November while irrigated plots matured and harvested on 12 November.
There was no signif icant difference (P>0.05) between the canopy cover of rainfed and irrigated treatments when this was measured before the onset of water stress around 21 September: RNoCut (0.851), RCut1-5 (0.800), RCut2-5 (0.775), RCut2-15 (0.853), INoCut (0.815), ICut1-5 (0.823), RCut2-5 (0.799), RCut2-15 (0.804). The grain yield achieved depends on conditions during the f lowering and grain f illing period, soil moisture being the major limiting factor. For the irrigated treatments, this demand was fulf illed by applying irrigation (Figs. 1 and 2). However, for the rainfed crops, there was signif icant soil water limitation as there was only very small amount of rainfall in September. September rainfall is highly correlated to the grain yield of winter crops in this region (Zeleke et al. 2014). High dry matter accumulation during the winter season followed by soil moisture def icit during spring leads to early leaf senescence, reduced canopy cover and lower grain yield (van Herwaarden 1996). This can be seen from the signif icant difference (P<0.05) between the crop canopy cover of the rainfed and irrigated treatments measured on 6 October (Table 2): RNoCut (0.674), RCut1-5 (0.623), RCut2-5 (0.741), RCut2-15 (0.718), INoCut (0.822), ICut1-5 (0.843), RCut2-5 (0.828), RCut2-15 (0.812). For the rainfed treatments, the lowest green canopy cover was 0.623 (RCut1-5) and the highest was 0.741 (RCut2-5). For the irrigated treatments, the lowest green canopy cover was 0.812 (ICut2-15) and the highest was 0.843 (ICut1-5). The canopy cover measured on 19 October was even more contrasting: RNoCut (0.471), RCut1-5 (0.451), RCut2-5 (0.550), RCut2-15 (0.483), INoCut (0.785), ICut1-5 (0.801), RCut2-5 (0.774), RCut2-15 (0.779). These later green canopy cover values had a strong positive relation with grain yield (Fig. 4). This shows that maintaining higher crop canopy during spring results in increased grain yield. Supplemental irrigation during this f lowering and grain f illing stage can substantially increase crop yield.
The cumulative evapotranspiration determined using the soil water balance approach is presented in Fig. 5. As the season progresses into spring, the crop water use increased at a higher rate. However, there was no clear/signif icant difference (P>0.05) between the evapotranspiration of the different grazing treatments of the respective watering regimes.
3.3. Crop harvest parameters
The analysis of variance and the presence/absence of signif icant difference (P<0.05) between the crop growth and harvest parameters is presented in Tables 2 and 3, respectively. The season during which this experiment was conducted was one of the driest winter seasons with April-October rainfall of only 167 mm (which is only 50% of the long-term average). There was almost no rainfall during months: June (2 mm vs. 51 mm long-term average) and September (6.8 mm vs. 49 mm long-term average) (Fig. 1). As a result, there was signif icant difference (P<0.05) between the crop yield of rainfed and irrigated treatments; the irrigated treatments' yield being 66% higher than the rainfed treatments' yield. There was no signif icant interaction effect indicating that the effect of simulated grazing was similar in drought years and years with normal or above normal rainfall.
Neither of the simulated grazings had signif icant (P<0.05) effect on crop yield both under rainfed and irrigated treatments. The yield of the rainfed-defoliated treatments differed from the non-defoliated treatments by -11.2% (RCut1-5), 0.5% (RCut2-5), and 3.3% (RCut2-15), respectively. The yield of the irrigated-defoliated treatments differed from the non-defoliated treatment by -1.7% (ICut1-5), -9.1% (ICut2-5), and 6.9% (ICut2-15), respectively. Both in suboptimal and optimal conditions, clip grazing just before GS30 slightly increased grain yield relative to unclipped treatment. This was mainly due to lodging of the non-defoliated irrigated treatments (INoCut). Although it had the highest above ground dry matter of the irrigated treatments, its yield was lower than that of the ICut2-15 treatment by 6%. Its harvest index was signif icantly low (0.318 vs. 0.360). Crash grazing of the irrigated treatment just before GS30 (ICut2-5) resulted in signif icantly lower (P<0.05) above ground dry matter than the non-defoliated treatment (INoCut) and 15% lower grain yield than the concurrent clipped grazed treatment probably due to shorter recover time before anthesis (Harrison et al. 2011b). Seymour et al. (2015) also reported that simulated “crash” grazing reduces grain yield more than “clip” grazing of the top 5-10 cm of crop canopy. Arzadun et al. (2006) found no signif icant difference (P<0.05) between the yields of 3 and 7 cm clipped treatments; however, the clipped treatments had lower yield than the unclipped treatments. On the other hand, clipping can have no or little effect, or in some cases, increase grain yield (Redmon et al. 1995). Earlier studies done with actual livestock grazing have found no yield difference (e.g., Dove et al. 2002), yield reductions (e.g., Harrison et al. 2011a), or increased yield (e.g., Sprague 1954) due to grazing. This shows that interactions of crop species, genetics, management and environmental factors determine the effect of grazing on crop yield.
The relationship between grain yield and canopy cover measured at different times is shown in Fig. 4 and it can be seen that there is a strong positive relation between the green canopy cover at 50% f lowering. The relationship becomes even stronger during the grain f illing period. The green canopy cover controls the amount of solar radiation the plant intercepts and eventually plant growth and grain yield (Sinclair and Muchow 1999). As indicated by the higher R2value (0.94 on October vs. 0.02 on 21 September and 0.83 on 6 October), canopy cover measured later in spring can be a good predictor of the f inal grain yield. However, the canopy cover measured before or at f lowering might not be a good indicator of the grain yield; conditions during the grain f illing, mainly soil moisture and air temperature, determine the grain yield. The higher deviation of some of the points was the result of some irrigated treatments having low harvest index probably due to factors such as lodging.
Similar to the grain yield, there was no signif icant effect (P>0.05) of simulated grazing on crop dry matter at harvest. For the rainfed treatment, the lowest and highest above ground dry matters were 9 t ha-1(RCut1-5) and 11.03 t ha-1(RCut2-15), respectively. These treatments were also the ones with the lowest (3.26 t ha-1) and highest (3.79 t ha-1) grain yields, respectively. For the irrigated treatment as well, the lowest above ground dry matter was 15.67 t ha-1(ICut2-5), the treatment with the lowest grain yield (5.50 t ha-1). However, the highest above ground dry matter was recorded for the non-defoliated treatment (INoCut) while the highest grain yield was recorded for ICut2-15 (Table 2).
The harvest index (HI) was not signif icantly affected by either grazing or watering regime. For the rainfed treatment, the lowest HI was 0.342 (RCut2-5) and the highest was 0.382 (RCut2-15). For the irrigated treatment, the lowest HI was 0.318 (INoCut) and the highest was 0.360 (ICut2-15). The 1 000-seed weight was signif icantly (P<0.05) affected both by grazing and watering regimes. For the rainfed treatment, the lowest seed weight was 30.05 g (RCut2-15), the treatment with the highest yield, and the highest was 31.89 g (RNoCut). For the irrigated treatment, the lowest seed weight was 32.55 g (ICut2-5) and the highest was 38.00 g (ICut2-15). Overall, the irrigated treatment had signif icantly higher (P<0.05) seed weight (35.16 g) than the rainfed treatments (31.20 g). There was also interaction effect with the seed weight being higher for the defoliatedirrigated treatments and getting lower for the non-defoliated irrigated treatments. Since defoliation did not signif icantly affect the grain yield, this shows that the increase in yield in irrigated treatments is due to higher seed number.
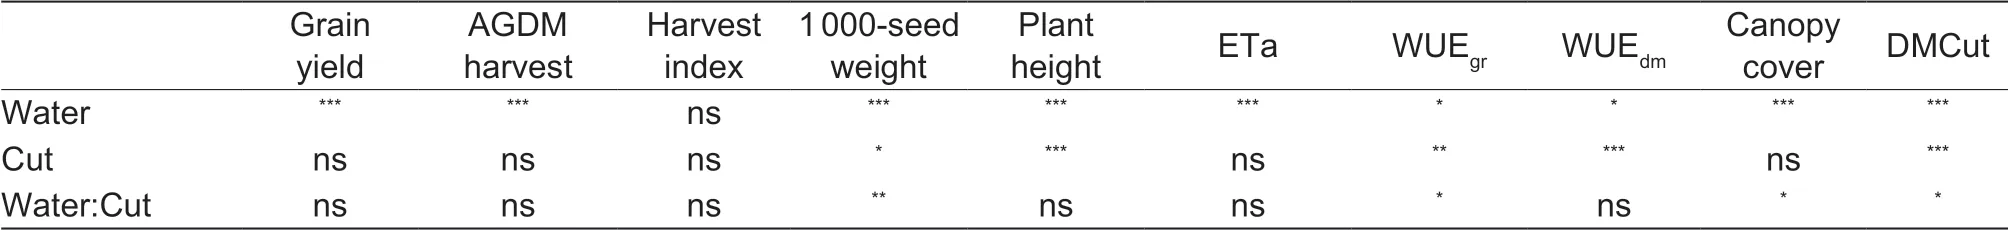
Table 3 ANOVA signif icance table for the effects watering regimes and grazing conditions on growth and yield of spring wheat (cv. Flanker)1)
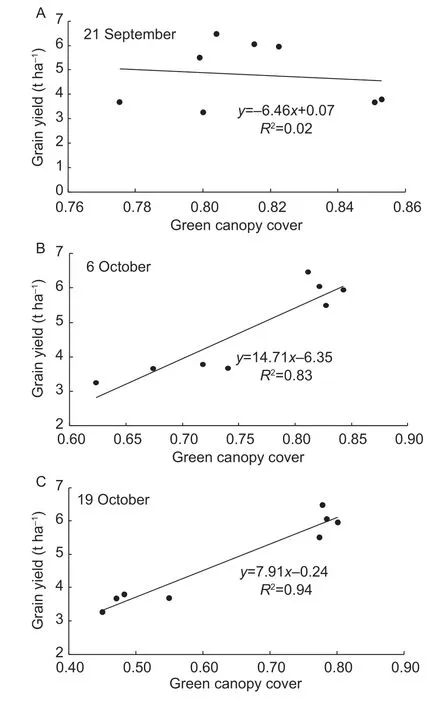
Fig. 4 The relation between crop canopy cover measured at different times in spring and grain yield.
There was no signif icant (P>0.05) effect of simulated grazing on crop water use/evapotranspiration. For the rainfed treatment, RCut1-5 had the lowest water use (257.5 mm) while RCut2-15 had the highest (295.0 mm) which was 37.5 mm (15%) higher. For the irrigated treatments, the lowest evapotranspiration was 528.4 mm (ICut2-15) and the highest was 552.8 mm (ICut2-5). Expectedly, the evapotranspiration of the irrigated treatments was higher than that of the rainfed treatments by 269 mm (98%).
There was signif icant difference (P<0.05) between the water use eff iciency of grain yield (WUEgr) of the two watering regimes; the WUEgrof rainfed treatments was higher than that of the irrigated treatments by 19%. Sandars and Angus (2006) reported that water use eff iciency and evapotranspiration had inverse relation and that evapotranspiration accounts for most of the variation in WUEgrbetween different environments. The lowest WUEgrfor the rainfed treatment was 1.27 kg m-3(RCut1-5) and the highest was 1.34 kg m-3(RCut2-5). For the irrigated treatments, the lowest was 1.00 kg m-3(ICut2-5) and the highest was 1.23 kg m-3(ICut2-15). Although the maximum WUEgrfor grain-only wheat in wide range of world environments is 2.2 kg m-3, in dry regions of south-eastern Australia this is only about 1.0 kg m-3(Sandras and Angus 2006). There was signif icant (P<0.05) effect of grazing and watering regime on the dry matter water use eff iciency (WUEdm) with the lowest value of 3.50 kg m-3(RCut1-5) and the highest value of 3.82 kg m-3(RNoCut) for the rainfed treatment and the lowest value of 2.84 kg m-3(ICut2-5) and the highest value of 3.48 kg m-3(INoCut) for the irrigated treatment. The irrigated-non-defoliated (INoCut) treatment had 23% higher WUEdmthan ICut2-5 and RNoCut had 9% more WUEdmthan RCut2-5. This can be attributed to the reduced evaporation, less soil surface exposure, from non-defoliated crops (Harrison et al. 2011a). There was a signif icant effect of grazing on the irrigation water use eff iciency of grain yield (IWUEgr). The lowest IWUEgrwas 0.63 kg m-3(ICut2-5) and the highest was 0.94 kg m-3(ICut1-5). There was no signif icant effect of grazing (P>0.05) on the irrigation water use eff iciency of the above ground dry matter (IWUEdmwith the lowest value of 2.09 kg m-3(ICut2-5) and the highest 2.97 kg m-3(ICut1-5). Plant height was signif icantly (P<0.05) affected by grazing and water regimes. For the rainfed treatments, the shortest was 80 cm (RCut2-5) and the tallest was 98 cm (RNoCut). For the irrigated treatments, the shortest was 88 cm (ICut2-5) and the tallest was 125 cm (INoCut).
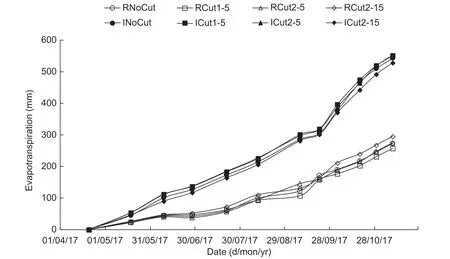
Fig. 5 Cumulative crop evapotranspiration for different grazing and watering regimes of wheat at Wagga Wagga, NSW Australia. Each point is an average of three data records or replications. RNoCut, rainfed non-defoliated; RCut1-5, rainfed defoliated to 5 cm height at growth stage (GS) 25 (GS25); RCut2-5, rainfed defoliated to 5 cm height at GS30; RCut2-15, rainfed defoliated to 15 cm height at GS30; INoCut, irrigated non-defoliated; ICut1-5, irrigated defoliated to 5 cm height at GS25; ICut2-5, irrigated defoliated to 5 cm height at GS30; ICut2-15, irrigated defoliated to 15 cm height at GS30.
The dry matter cut at different times and intensities and under different watering regimes is presented in Table 2. For the rainfed treatment the amount of forage harvested from RCut1-5 (0.13 t ha-1) was signif icantly lower (P<0.05) than that of RCut2-5 (0.29 t ha-1) and RCut2-15 (0.27 t ha-1). However, there was no signif icant difference (P<0.05) between RCut2-5 and RCut2-15. For the irrigated treatment, there was signif icant difference (P<0.05) among all the three grazing treatments with the lowest being 0.35 t ha-1(ICut1-5) and the highest 0.86 t ha-1(ICut2-5). On average, the irrigated treatments had 0.38 t ha-1(167%) higher above ground dry matter cut than the rainfed treatments. The dry matter at the early cutting might be insuff icient to support grazing. Although the “safe” grazing period for a winter wheat variety is from the time the crop roots are well anchored, until the plants reach elongation of the reproductive parts (stem elongation and hallow stem), for spring wheat it is only after a couple of months since sowing that there will be substantial forage for grazing. These results show that spring wheats such as cv. Flanker can also be grazed without signif icantly affected grain yield although the grazing value is low due to the later sowing dates and smaller safe grazing window. If grazed before June, there will not be enough dry matter to graze and after July, the crop reproductive parts can be damaged affecting the grain yield.
4. Conclusion
There was no signif icant effect of simulated grazing on grain yield. Grazing of spring wheat earlier in the season (13 June or GS25, in this experiment), has a very low grazing potential as the crops would not yet accumulated substantial above ground dry matter. Grazing spring wheat up to just before stem elongation or f irst hollow stem (GS30) is a feasible compromise between grazing potential and grain yield. Under optimal soil water regime, grazing increases harvest index as ungrazed crops can be tall and eventually lodge. Grazing did not affect seed size and water use, although irrigated crops had higher seed size and, as expected, had high evapotranspiration. In a mixed farming system of Australia, grazing of mid-late maturing wheat cultivars has the potential to f ill the feed-gap during the winter months without affecting grain yield. However, the forage which can be grazed from spring wheat crops is substantially lower than that can be obtained from dual-purpose winter varieties reported in literature, as the amount of available above ground dry matter for grazing is low, especially earlier in the season and in drought years. These results need to be tested under actual livestock grazing condition and for different varieties and environments.
Acknowledgements
The study was supported by the Graham Centre for Agricultural Innovation, Australia.
 Journal of Integrative Agriculture2019年5期
- Journal of Integrative Agriculture的其它文章
- Mulching with plastic f ilm improved the root quality of summersown sweet potato (Ipomoea batatas (L). Lam.) in northern China
- Impacts of Sletr1-1 and Sletr1-2 mutations on the hybrid seed quality of tomatoes
- The chemical treatments combined with antagonistic yeast control anthracnose and maintain the quality of postharvest mango fruit
- Comparison of phenolic prof iles and antioxidant activities in skins and pulps of eleven grape cultivars (Vitis vinifera L.)
- Polyaspartic acid mediates the absorption and translocation of mineral elements in tomato seedlings under combined copper and cadmium stress
- lnteraction effect of nitrogen form and planting density on plant growth and nutrient uptake in maize seedlings