Cross section scan trace planning based on arc additive manufacturing
Sun Qingjie,Sang Haibo,Liu Yibo,Feng Jicai
1.State Key Laboratory of Advanced Welding and Joining,Harbin Institute of Technology,Harbin 150001,China;2.Shandong Provincial Key Laboratory of Special Welding Technology,Weihai 260209,China;3.Kuka Robotics(Shanghai)Co.,Ltd,Shanghai 201612,China
Abstract In the context of additive manufacturing processes,the influence of specimen deformation from different welding paths is conducted by using CMT-AM.A least-squares method was used to quantitatively measure specimen deformation.The values of S(i.e.,the sum of the distance from each feature point in a plane to the ideal plane)from different welding paths had significant influence on deformation of deposited layer.With the value of S increasing,the deformation of deposited layer gradually increased.With this result,a suitable welding trace plan was ascertained,which was successfully used to acquire well-formed and densely organized specimens during the arc-welding additive manufacturing process.Our results provide a foundation for experiments based on deposited layer scanning trace planning.
Key words additive manufacturing,cold metal transfer,scanning trace planning
0 Introduction
Rapid prototyping technology based on cold metal transfer(CMT)is a new arc-manufacturing technique.Compared with other electrode melting methods,the CMT method allows the droplet transition when without the welding current.In addition,the characteristics of CMT are low arc temperatures,low droplet temperatures,low required heat input,and the welded components experience only small amounts of deformation[1-2].Therefore,CMT has been widely used in arc additive manufacturing.
During arc additive manufacturing,the scanning path of a section component describe the location of arc initiation and arc extinguishing in the welding process,as well as the spatial positions and temporal sequences between welds.Different forming trajectories have significantly influence on the weld formation[3-4].For example,different forming paths in the arc-metal forming process result in different temperature fields,affecting the characteristic dimensions of the welds resulting in size changes of the welded component[5].Besides that,stress changes are induced in the arcforming component due to the uniformly applied heat process,and different amounts of residual stress existence along different section of scanning path can result in different degrees of deformation imparted to the component that directly affects its dimensional accuracy[6].However,how to choose a suitable cross-section scanning track for a section to ensure its required size accuracy after welding hasnot been reported for additive manufacturing processes.
Based on CMT additive manufacturing technology,this paper designs different welding trajectories,and investigates the effect of the CMT scanning trajectories on postwelded deformation,where the results are numerically analyzed.In addition,the deformation of a test plate under different section scanning trajectories is quantitatively compared.Across section scanning trajectory plan is subsequently proposed.
1 Experimental method
The AM experiments of aluminum are conducted using a Fronius CMT welding system with a lower heat input job number.The test material was a fifth series aluminum alloy plate with specimens measuring 100 mm×90 mm×1 mm,as shown in Fig.1.
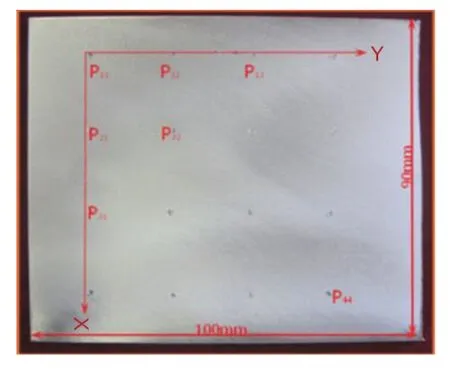
Fig.1 Standard test substrate
The oil,water and oxide film on the surface of the aluminum alloy plate was removed using a steel wire brush.Signs were marked at the same position of each test plate,which were used to measure the amount of deformation incurred after welding trajectory.The marking points on each board were divided along thex-andy-axes,with four marks on each axis.There were a total of 16 marks on each board.Each welded test plate was placed on the measuring platform,and the amount of deformation experienced by each of the 16 marked points on the standard test plate was measured by a dial indicator.The deformation data of the feature points were recorded in the spatial coordinate system to obtain a series of scatter distribution maps.These scatter points were then fitted by the method of spatial multi-point least-squares plane fitting[7-8],and the best-fitting plane was obtained.The total sum of the distance from the scatter to the fitting plane(S)was taken as the criterion of the total deformation of each test plate.
In three-dimensional space,the coordinates of a series ofnpoints in space are:

There is always an ideal plane:

The sum of the distances from the scatter points set(xi,yi,zi),wherei=0,1,…,n-1,to the ideal plane was the shortest.This plane was called the datum plane,whereA,B,CandDare constants describing the spatial characteristics of the plane.The distances(d)from the sespatial points to the plane were used to calculate the sum of the distance from each feature point to the ideal plane(i.e.,theSvalue),which was used as the numerical measurement standard of the total deformation of the thin plate.
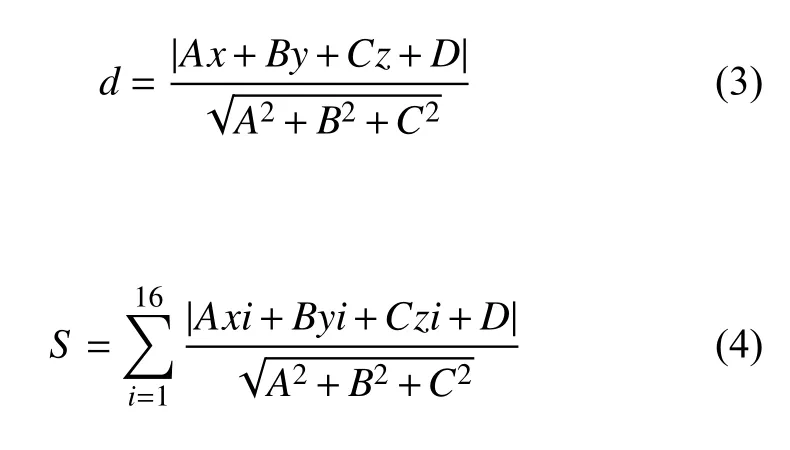
By comparing theSvalue of each test plate under different test schemes,the deformation degree of each test plate was quantitatively compared,and the influence of the scanning trajectory sequence on part deformation was quantitatively explored.
2 Experimental results
On the standard test plate shown in Fig.1,a forming test of a double-channel weld was conducted,where the considered variables were the distance between the two welds and the welding direction.The influence of these variables on the total deformation of the thin plate after welding was emphatically studied to provide reference for futuredesigns of multi-pass weld scanning trajectory.
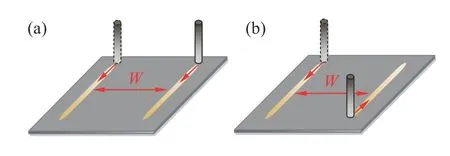
Fig.2 Two main experiment(A/B)plans(a)Plan A:same direction welding(b)Plan B:alternate direction welding
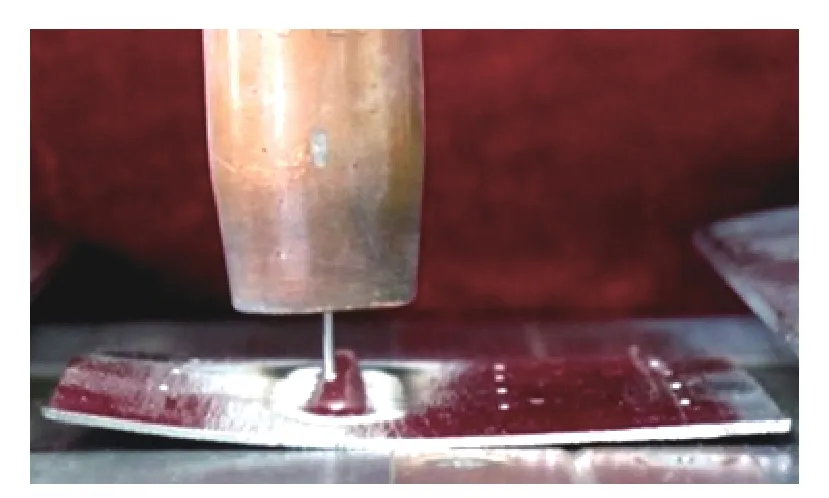
Fig.3 Real welding process
The welding was performed in the same and alternate directions,where we used 20 mm and 40 mm distances between adjacent welds,as shown in Fig.2.During the actual welding process,the deformation trend of the substrate was a shrinkbending deformation,wherethe edges of the substrate showed irregular and random bending deformations(Fig.3).The deformation degree increased with anincrease of the number of welds.In order to quantitatively describe the degree of deformation,the least-squares method mentioned in Section 2was used to fit the deformation data of the 16 characteristic points on the substrate,wherebythe best-fitting plane was obtained.TheSvalue of the substrate was calculated according to Eqs.(3)and(4),and the total deformation value was obtained.
In Fig.4,deformation data of 16 characteristic points are represented in the form of a cloud map,which allows us to intuitively reflect the deformation trends and degree of deformation experience by the thin test plate.The spatial expression of the fitted plane of the feature points was obtained by means of plane fitting,and theSvalue was calculated.The best-fitting plane equations andSvalues were displayed in Table 1.It can be seen that the larger the distance between adjacent welds(such as A1 and A2),the smaller the deformation of the test plate in the case of the same welding direction.The larger the spacing,the more dispersed the heat source distribution,the smaller the stress concentration area,and hence,the smaller the deformation of the test plate.
On the other hand,we found that it was better to use staggered welding directions rather than the same welding direction in the case of same-spaced welds(such as A2 and B2),as the former resulted in smaller deformations.The analysis used to obtain this result is as follows.When welding in the same direction,once the first weld was finished,the test plate fully cooling especially at the arc-quenching position was far away from the arcing-welding position.A second arc-weld was then performed at the position of the first weld;here,the plate underwent another heat cycle from low to high temperature.After the second weld the accumulated welding stress resulted in large deformation.
Next,staggered welding was used,and this time the arc quenching position on the test plate did not suffer a complete heat dissipation process after the first weld.The surface temperature of the first weld was relatively high,which was equivalent to the preheating temperature applied to the test plate.During the second weld,the temperature-difference and temperature-gradient experienced for the test plate was significantly lower than that during the first weld.The subsequent distribution of the welding residual stress was relatively uniform,and the amount of deformation experience by the test plate was less than during the same-direction welding test.
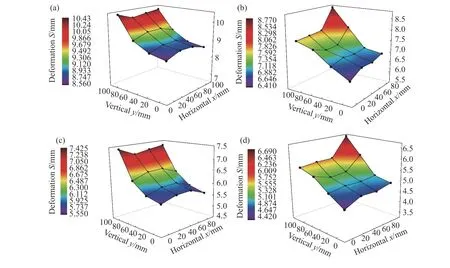
Fig.4 Measurement deformations for plans A&B(a)A1:syntropy welding,W=20 mm(b)B1:alternate welding,W=20 mm(c)A2:syntropy welding,W=40 mm(d)B2:alternate welding,W=40 mm
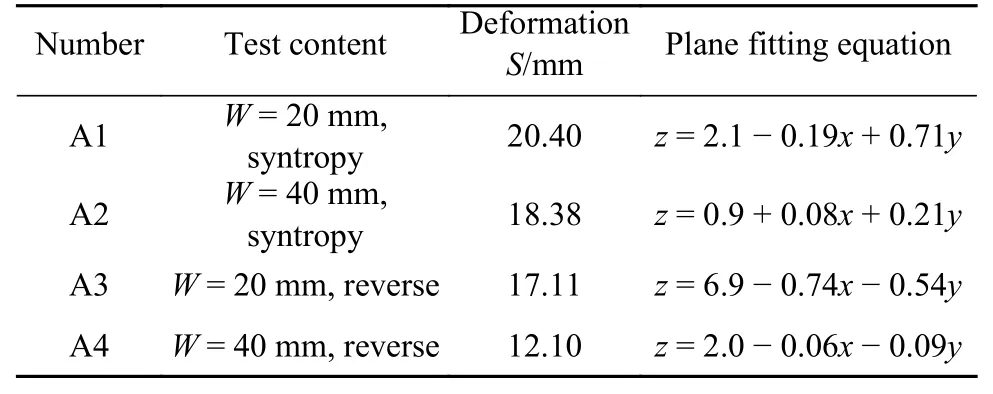
Table 1 Results of the regression fitting for double-pass weld test plan
In order to verify the accuracy of the above tests,the welding direction was taken as the variable of interest.A test scheme was simulated using the ANSYS software to obtain the deformation cloud diagram,as shown in Fig.5.The fixed spacingWis 40 mm.It can be seen that the maximum deformation of the substrate was 8.02 mm at the base vertex far away from the arc starting point,as seen in Fig.5a.The maximum deformation of the substrate occurred at the base vertex near the arc extinguishing point of the finalweld,and the maximum deformation was 5.86 mm(Fig.5b).In comparison,the deformation arising afteralternating weldingwas significantly less than that incurred by welding in the same direction,which is consistent with the trend results obtained viatheSvalue method.
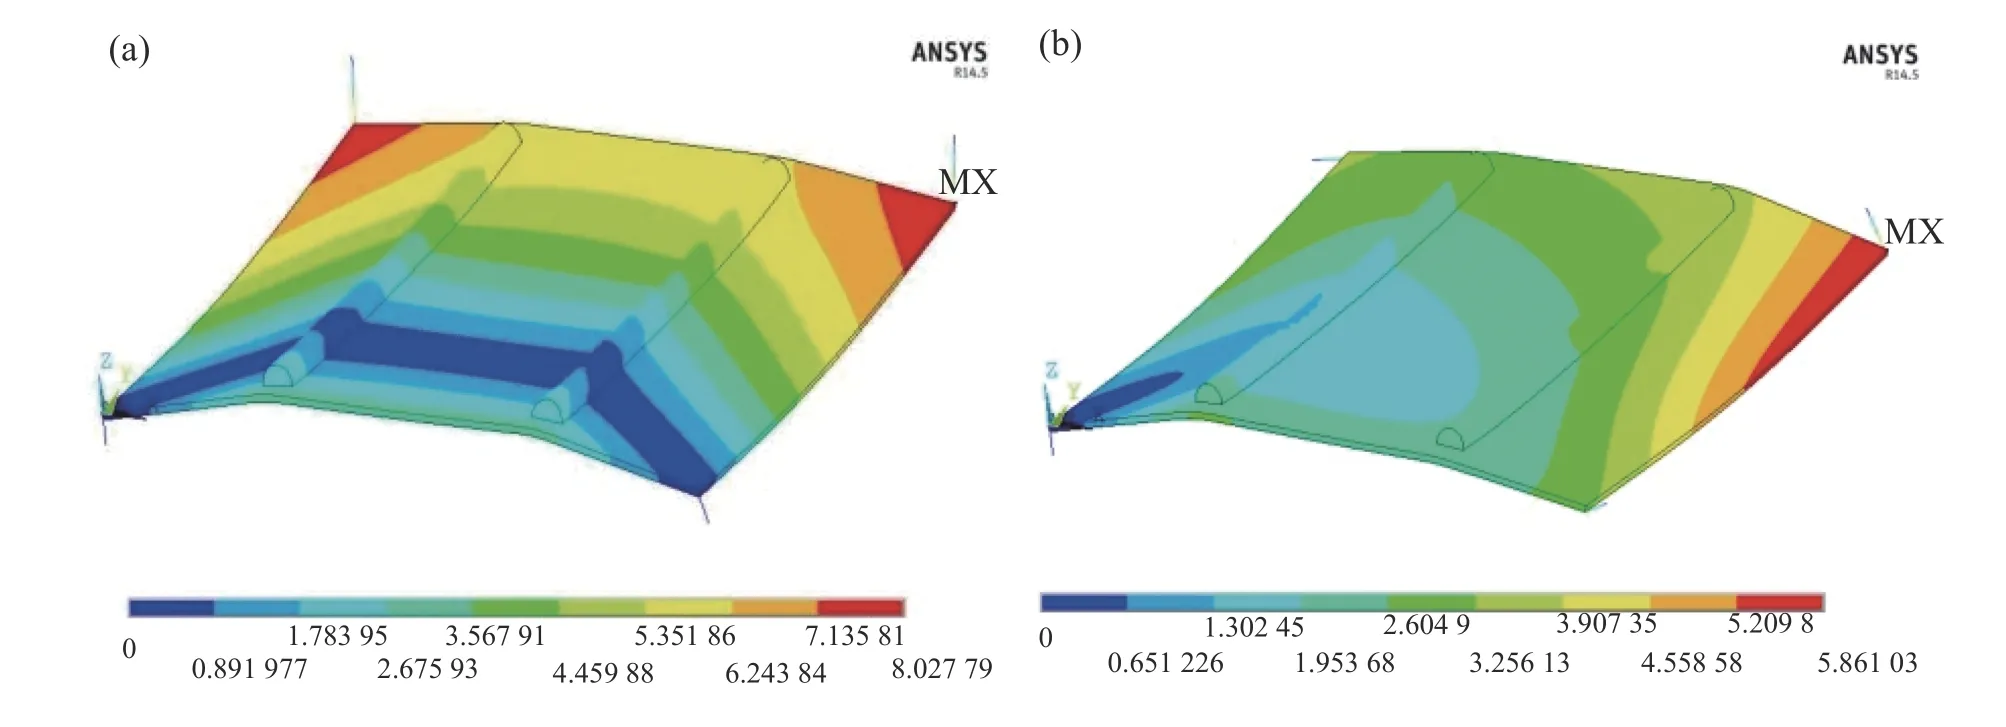
Fig.5 Deformation in different welding directions(a)Syntropy welding,W=40 mm(b)Alternate welding,W=40 mm
3 Cross-sectional scan-trajectory planning
3.1 Planar multipass weld test
On the basis of the experiments presented in section 3,the influence of planar multi-pass welding on welding deformation was studied in order to determine the ideal scanning path.
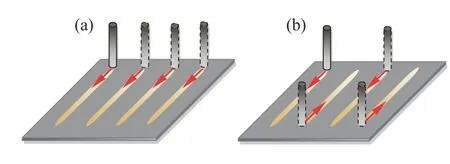
Fig.6 Experimental plans for multi-weld seams(a)Plan C(b)Plan D
As shown in Fig.6,the planar multipass weld test was designed to simulate the design schemes of different scanning trajectories of the same section in the context of rapid prototyping technology.For the same section,on the basis of the experimental test results(section 3),plan C(i.e.,an adjacent welding seam with equal-interval scanning using a relatively concentrated heat source,a large temperature gradient,and uneven distribution of the heat field)and plan D(i.e.,an adjacent welding seam with staggered-interval scanning using a relatively dispersed heat source,a small temperature gradient,and a uniform temperature distribution)were adopted.The spatial least-squares method was used to fit the datum plane using the same data recording and fitting methods employed for the experimentaltest data.The values of the test plate deformationSin plans C and D were calculated,as shown in Table 2S values in these cases,the validity of the experimental results(section 3)were verified.Moreover,these results provide a basis for the planning and design of the scanning trajectory of rapid prototyping section technology..
The deformation of the test plate after welding according to the cross-sectional scan track of plan C was significantly greater than that of the scan track of plan D,as shownin Table 2.The increased amount of deformation arising in plan D was because the heat source was relatively dispersed,the temperature gradient was small,and the temperature distribution was uniform.This finding accords with and verifies the correctness of the aforementioned test results.Meanwhile,this result also provides an experimental basis and principle for the planning and design of the scanning track of rapid prototyping,i.e.,a scanning track that moves from the edge of the substrate to the center should be conducted using staggered welding direction.

Table 2 Results of the regression fitting for multi-weld plans
3.2 Practical application of cross-sectionalscantrajectory planning
On the basis of the above conclusions found in Section 4.1,the derived scan trajectory was applied during an actual CMT additive manufacturing process,as shown in Fig.7.The height direction of the component consisted of 10 layers in total,and 12 scan trajectories were used in each section.The scanning trajectory plan used for each section,whereby scanning occurred from both sides of the component toward the center,and staggered welding was adopted for the two adjacent welds.It can be seen that the height of the welded component remained basically the same,and there was no severe post-welding deformation with high dimensional accuracy,as shown in Fig.7a.Each scanning track weld present dwell formation(Fig.7b).
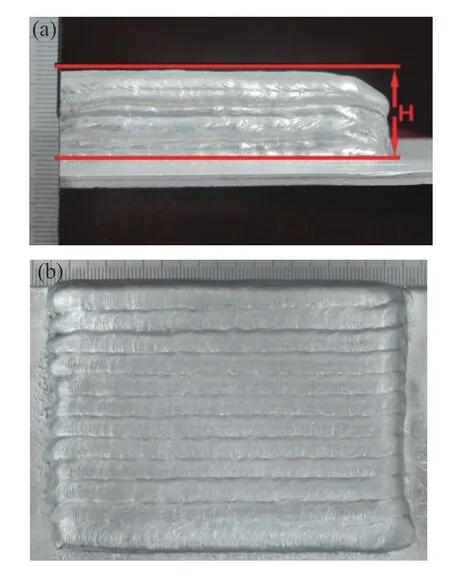
Fig.7 Cross section scan trace in CMT additive manufacturing solid parts(a)Physical part of additive manufacturing(bottom view)(b)Physical part of additive manufacturing(vertical view)
Fig.8 shows the cross section of a CMT additive manufactured component after corrosion.It can be seen that the welds between each layer are well combined,and no defects such as cavitiesor unfused sections can be found.On the same layer,the welds were closely combined with no obvious fluctuation and they have good dimensional accuracy.This experiment further verifies the rationality of principles of the proposed CMT additive manufacturing process.
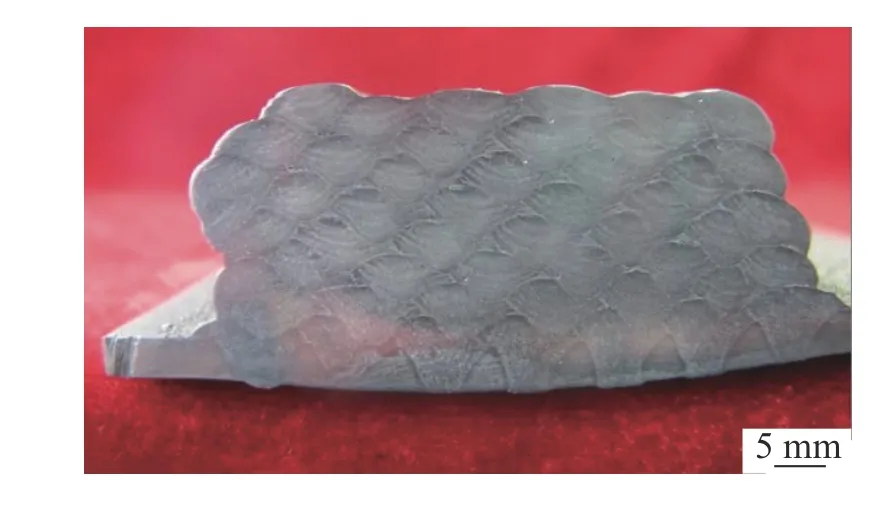
Fig.8 Cross section of a CMT additive manufactured component
4 Conclusions
The following conclusions can be drawn from our study:
(1)The Least-squares fitting was used to construct the model and datum plane.When the welding spacing was 40 mm,scanning tracks with alternating welding directions had minimumS-values,and the corresponding deformations were the smallest.
(2)TheS-value method was applied to the design of the multi-track scan trajectories.A trajectory design scheme with equal spacing and alternating directions was adopted,and the correspondingSvalue(35.47 mm)and degree of deformation were smaller than those from a trajectory scheme based on parallel welds.
(3)For arc additive manufacturing processes,a scanning method that proceed from the edge to center of the section combined with alternate scanning trajectories will obtain component with accurate shape,few defects and contain only small amount of deformation.
- China Welding的其它文章
- Effect of Ga on microstructure and properties of Sn-Zn-Bi solder for photovoltaic ribbon
- Mechanism analysis of free formation of backing weld by the pulsed MAG-TIG double arc tandem welding
- Underwater robot local dry welding system
- Analysis of weld pool vibration characteristics in pulsed gas metal arc welding
- Graphene-coated copper foam interlayer for brazing carbon/carbon composite and niobium
- Combine S-N curve and fracture mechanics for fatigue life analysis of welded structures

