
利用糖蜜活性炭固定化混合微生物群落厌氧产氢研究
2019-04-03 12:12张伊帆齐凤岱李晓燕孙嘉曼王晓彤李永峰
中国甜菜糖业 2019年1期
张伊帆,齐凤岱,李晓燕,孙嘉曼,王晓彤,李永峰
(东北林业大学林业学院,哈尔滨 150040)
1 Introduction
Environmental pollution due to the use of fossil fuels as well as their shortfall makes it necessary to find alternative energy sources that are environmentally friendly and renewable. A great deal of attention is being paid for the usage of hydrogen (H2) as a sustainable energy carrier which is clean, efficient (with high-energy yield, 122 kJ/g), renewable and moreover does not generate any toxic by-product. Generally, there are some available basic processes for the production of hydrogen from non-fossil primary energy sources, such as water electrolysis, thermo-chemical processes, radiolytic processes and biological processes. Among various hydrogen production processes, biological method is known to be less energy intensive, for it can be carried out at ambient temperature and pressure. In the biological process, hydrogen can be produced through dark fermentation from organic wastes. Additionally, there is also a need to dispose of human-derived wastes in an environmentally friendly manner. Therefore, fermentative hydrogen production has been received increasing attention in recent years.
Biohydrogen production from waste and high organic wastewater through fermentation is carried out by anaerobic acidogenic bacteria with highly diverse fermentation characteristics and hydrogen production capabilities. Fermentation performance is dependent on a number of factors, such as pH, oxidation-reduction potential (ORP), temperature. The variations of these factors result in diverse microbial communities, which finally lead to different fermentation types. There are mainly three fermentation types in the anaerobic acidogenesis of organic matters, namely propionate type fermentation, butyrate type fermentation and ethanol type fermentation. The major products of propionate type fermentation are propionate and acetate (Reactions (1)), while the products of butyrate type fermentation include butyrate and acetate (Reactions (2)). As for ethanol type fermentation, ethanol and acetate are the primary fermentation products (Reactions (3)). Reactions (1)-(3) show that hydrogen is generated from butyrate and ethanol fermentations, not from propionate fermentation. Current studies have been focused on butyrate for biohydrogen production, insufficient information is available on the rapid start-up of ethanol-type fermentation which is considered to be the best type fermentation in biohydrogen production.
C6H12O6+2NADH→2CH3CH2COO-+2H2O+2NAD+
(1)
(2)
(3)
Suspended-cell culture has been frequently used for fermentative hydrogen production. However, continuous operation of suspended-cell system often encounters problems with washout of biomass at high dilution rates and would require the recycling of biomass from the effluent to maintain sufficient cell density for high hydrogen production activity. Immobilized-cell system have been successfully applied for biohydrogen production in various bioreactors, including fluidized bed reactor, carrier induced granular sludge bed and up-flow anaerobic sludge bed. There are reports outlining the use of pure cultures immobilized by agar gel and PVA alginate film being applied in continuous hydrogen production. In contrast, there is minimal reserch in using immobilized sludge for anaerobic hydrogen production. This work aimed to study the feasibility of biohydrogen production using molasses wastewater as substrate through anaerobic fermentation by attached sludge in a CMAGR.
2 Materials and methods
2.1 Experimental Apparatus and Processes
A 12.5 L continuous mixed attached grow reactor (CMAGR) with an effective volume of 5.4 L was used in this study (Fig.1). The CMAGR was constructed with transparent plexiglas with a gas-liquid-solid separating device, operating in a continuous flow mode. The influent flow rate was controlled by a feed pump to regulate the HRT in the reactor. The biogas generated was collected with a water lock and measured by a wet gas meter.
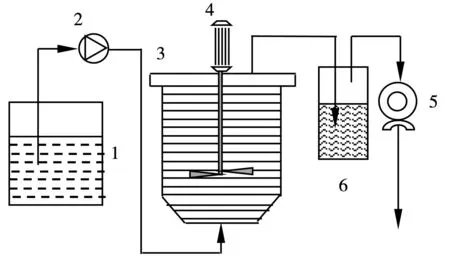
1.waste water box 2.feed pump 3.CMAGR 4.agitator 5.biogas meter 6.water lockFig.1 Schematic diagram of the CMAGR for biohydrogen production from molasses wastewater
2.2 Feeding and Seed Sludge
Substrate is also considered as an important non-organism factor which depended on the source and concentration of substrate [51]. The molasses used for biohydrogen production in the study was collected from a local sugar refining industry. The COD∶N∶P of the influent was maintained at a ratio of 1 000∶5∶1 by adding synthetic fertilizer in order to supply microorganism with adequate nitrogen and phosphorus.
The seed sludge used in this study was obtained from a local municipal wastewater treatment plant. The sludge settled at room temperature for 10 days, was aerated for 30 days to inhibit the methane-producing bacteria activity and then was added into the CMAGR. Granular activated carbon was used as support media for cell immobilization and retention. H2-producing sludge was mixed with granular activated carbon at a volume (ml) to weight (g) ratio of 1∶10.
2.3 Analytical Methods
COD, pH, biogas yield and its constituents were measured or monitored daily, according to Standard Methods [52]. Biogas were analyzed using a gas chromatography (SC-7, Shandong Lunan Instrument Factory). The gas chromatography was equipped with a thermal conductivity detector (TCD) and a stainless steel column (2 m×5 mm) filled with Porapak Q (50-80 meshes). Nitrogen was used as the carrier gas at a flow rate of 30 ml/min. Detection of volatile fatty acids (VFAs) in the fermentation solution was analyzed by another gas chromatograph (GC112, Shanghai Anal. Inst. Co.) using a flame ionization detector (FID). A 2-m stainless steel column was packed with the supporter GDX-103 (60-80 meshes). The temperatures of the injection port, the oven, and the detector were 220℃, 190℃, and 220℃, respectively. The carrier gas was also nitrogen at a flow rate of 30 ml/min.
3 Results and discussion
3.1 Acclimation of ethanol-type fermentation microbial community in the CMAGR
3.1.1 Variation in soluble metabolites
Fermentative H2production is always associated with substrate metabolic conversion of organic fraction to acid intermediates (secondary metabolites) in the anaerobic microenvironment. Production of acidic intermediates reflects the changes in the metabolic process involved and provides information to improve the conditions favorable for H2production. Fig.2 revealed the distribution of soluble fermentation products during the start up process. The total concentration of liquid fermentation products ranged from 627.7 mg/L to 1 266.5 mg/L during the first 10 days. The variation of liquid products suggested that the system had undergone a transition of fermentation types. On the 20 day, the concentration of ethanol, acetate, propionate, butyrate and valerate were 379.3 mg/L, 330.6 mg/L, 18.1 mg/L, 201.4 mg/L and 7.9 mg/L respectively, which indicated mixed acid type fermentation, meanwhile the H2production was inactive (Fig.3). Among these VFAs, acetate was a major metabolite formed during H2production. On the 40 day, the CMAGR system reached a stable stage with the concentration of ethanol, acetate, propionate, butyrate and valerate of 1 095.5 mg/L, 874.8 mg/L, 35.6 mg/L, 183.6 mg/L and 16.1 mg/L, respectively. The total amount of ethanol and acetate was 1 970.3 mg/L, accounting for 89.3% of the total liquid products, which indicated the ethanol type fermentation was formed. Ren’s group [36] considered that ethanol-type fermentation had many advantages for H2production and proposed that ethanol-type fermentation was quite an excellent choice for maximum HPR in continuous mode H2-producing system by mixed culture.
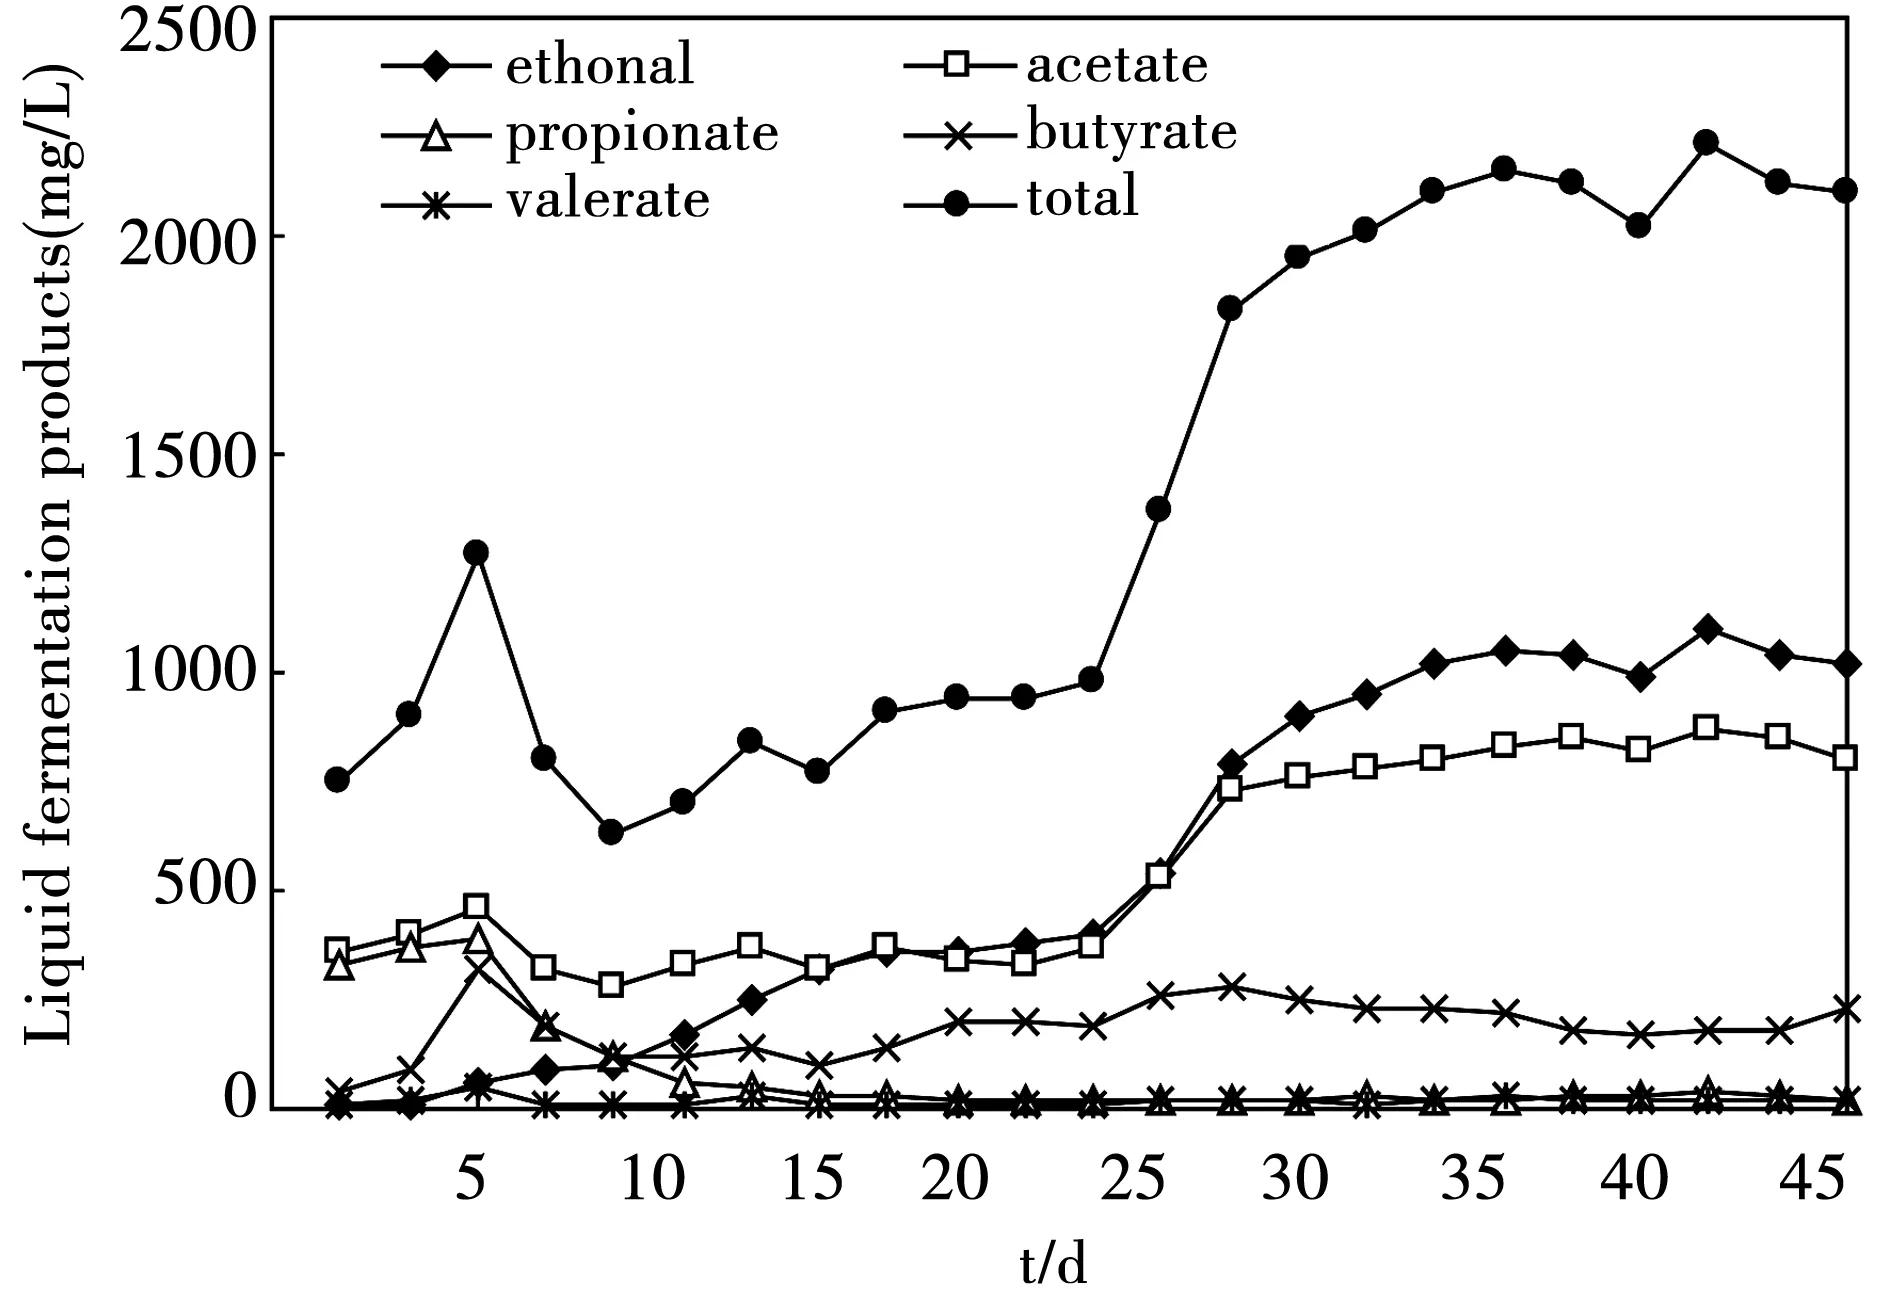
Fig.2 The variations of liquid fermentation products in the start up process
3.1.2 Biogas and biohydrogen production
After inoculation with selectively enriched mixed consortia immobilized by activated granular carbon, the CMAGR was operated with molasses wastewater at influent COD ranging from 2 000 to 6 000 mgCOD/m3d. The results of biogas and hydrogen production in the process of startup and sludge acclimatization are shown in Fig.3. The differences in H2production rate were attributed to the microbial population and influent COD. Because activated sludge was in this phase of adjusting and acclimatizing itself to the inner environment of the reactor, the biogas yield and H2content were low at the beginning of the startup (the first 10 days). After 30 days of operation, the reactor demonstrated stable performance with respect to biogas production and substrate degradation (Fig.4). In the CMAGR, the activated sludge acclimatized gradually and the biogas productivity increased with the operation. After 40 days, the sludge acclimatization was done, and then the biogas productivity and H2content reached to stability. At length, the biogas yield kept at 1.96 m3/m3d, and correspondingly the H2content and average yields were 46.6% and 1.09 m3H2/m3d, respectively.

Fig. 3 The variations of biogas and biohydrogen production in the CMAGR system
3.1.3 Wastewater treatment
The performance of substrate removal efficiency was also evaluated during H2production with the function of reactor operation (Fig.4). The CMAGR documented potential for substrate removal in concurrence with H2production. From the observed substrate degradation pattern, it was evident that the molasses wastewater was consumed in the metabolic reactions as primary carbon source involving molecular H2generation.
This study also satisfied operation efficiency on COD removal rate (Fig.4). In this initial days of startup period, the COD removal efficiency was higher due to the activity of inoculated aerobic sludge immobilized by activated granular carbon and the absorption of sludge floc. The influent and effluent COD on the 2nd day of inoculation were 4 232 mg/L and 1 426 mg/L, respectively. The COD removal efficiency fluctuated from -31.2% to 53.9% according to influent COD and stabilzed at 13% in 40 days. The experimental data documented the feasibility of molecular H2generation along with substrate degradation from molasses wastewater during the bioreactor operation.
In a traditional anaerobic wastewater treatment process, COD was mainly removed through the conversion of intermediate products (e.g. acetate) to methane by the methanogenic microbes. In the CMAGR system where acidogenic bacteria were dominant, COD was removed through the cytogenesis and gas releases (mainly CO2and H2), while COD was converted to liquid intermediate products (e.g. ethanol, butyrate, and propionate) significantly and stayed in the system. Therefore, the COD removal efficiency in this system was lower than traditional anaerobic process.
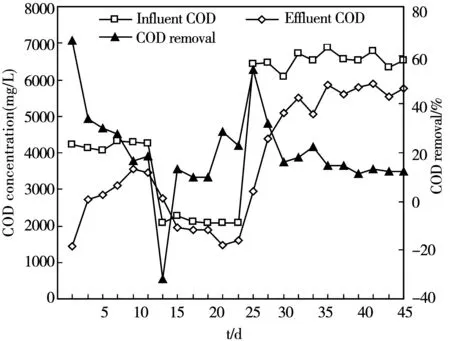
Fig.4 The variations of COD concentration and COD removal in the CMAGR system
3.1.4 Variation in pH and ORP
One of the factors that affected the metabolic pathways and consequently the H2-producing efficiency in dark fermentative H2production was pH [40-44]. The pH had great effect on the biohydrogen production process, which would influence certain enzyme activity and fermentation pathway, and would further change nutrient supply and toxicity of harmful substances, especially for wastewater. It was reported that, optimum pH for growth of methanogenic bacteria (MB) was between 6.8 and 7.5, while that for acidogenic bacteria (AB) was below 6 [45]. Fang and Liu [43] found that the optimal pH for H2production was at 5.5, and optimal pH of 5.5-5.7 in batch test was also reported by Khanal et al. [44]. In this study, high HPR occurred at pH values 4.16 (Fig.2, Tab.2), which was consistent with the studies reported by Li et al. [40] and Ren et al. [36]. Optimal pH scopes for H2production might be different due to microbial communities under different operation conditions. There was no CH4detected in the biogas during the whole process, which indicated that low operating pH would effectively block the methanogenesis.
During the first 15 days, ORP rose from -465 mV to -337 mV in the CMAGR system, and then dropped to -422 mV after the 25 day. Then the ORP of the system stabilized at -416 mV to -434 mV, which had been demonstrated as the optimal condition for ethanol type fermentation. In an anaerobic system, ORP was mainly affected by pH. Because the CMAGR system was operated in a continuous mode and pH underwent consistent variations, it was difficult to derive a clear correlation between ORP and pH. However, it could still be seen from Fig.5 and Fig.6 that ORP was inversely related with pH in most cases, with low ORP correspongding with high pH.
3.2 The performance of hydrogen production with different OLR
To investigate the effects of OLR on hydrogen production in the CMAGR, a total of 4 runs (8-32 kg/m3d) were carried out. The produced biogas was composed of H2and CO2. Methane was not detected which indicated that the variation of pH and OLR in this study can inhibit the activity of hydrogen consumers. Each run was lasted at least 16 times of HRT to obtain the average values for the data analysis. The performance of hydrogen production at different OLRs is shown in Fig.4. The hydrogen production rate was gradually increased with the increase of OLR from 8 to 32 kg/m3d.
The optimum OLRs for hydrogen production in the comparable process differ significantly among studies (OLR 20-50) (Tab.1), since OLR is well known as one of the important factors which impact upon the structure of the hydrogenic microbial community[15]. In this study, the CMAGR achieved a maximum hydrogen production rate of 12.51 mmol/hL at a OLR of 32 kg/m3d.

Fig.5 The variations of pH in the CMAGR system

Fig.6 The variations of ORP in the CMAGR system
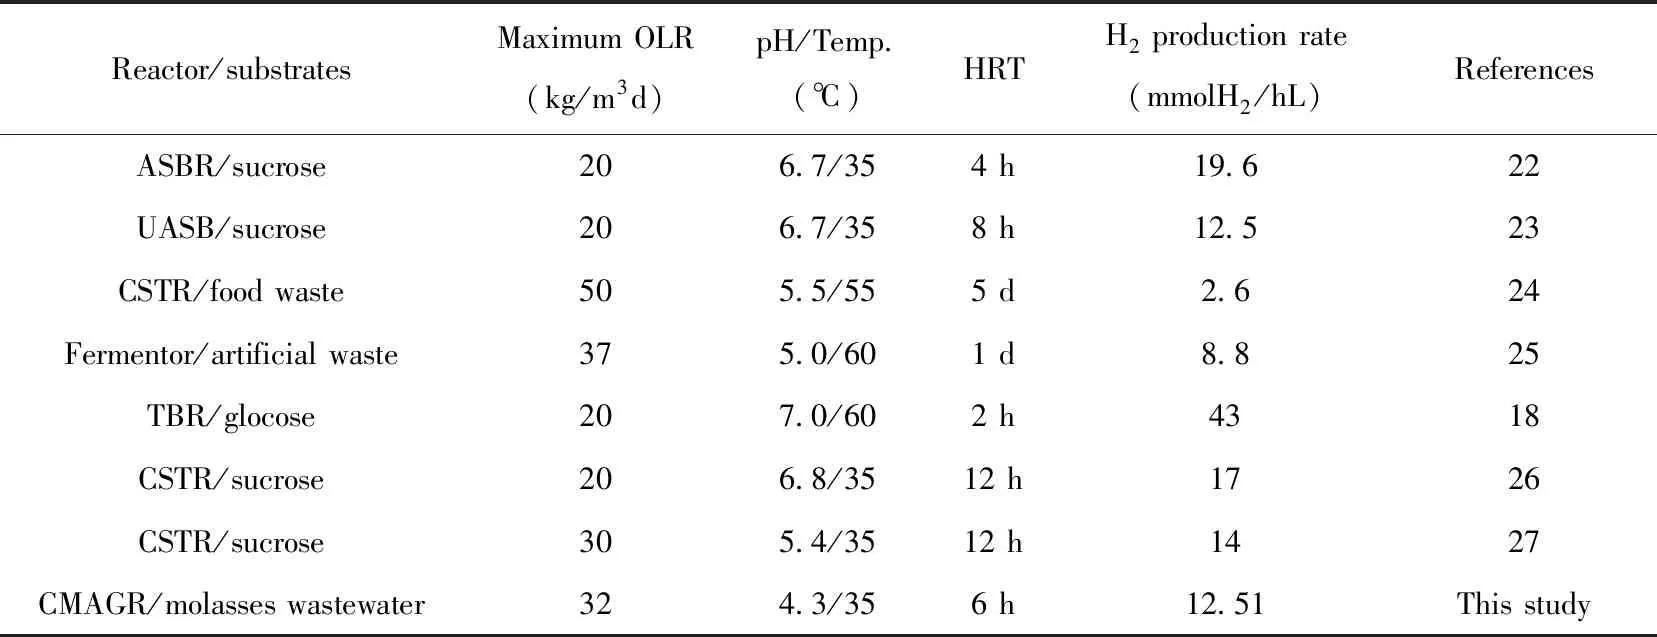
Reactor/substratesMaximum OLR(kg/m3d)pH/Temp.(℃)HRTH2 production rate (mmolH2/hL)ReferencesASBR/sucrose206.7/354 h19.622UASB/sucrose206.7/358 h12.523CSTR/food waste505.5/555 d2.624Fermentor/artificial waste375.0/601 d8.825TBR/glocose207.0/602 h4318CSTR/sucrose206.8/3512 h1726CSTR/sucrose305.4/3512 h1427CMAGR/molasses wastewater324.3/356 h12.51This study
Fig.7(a) shows a maximum hydrogen production rate of 12.51 mmol/hL at a OLR of 32 kg/m3d. The hydrogen production rate was directly correlated to OLR. The correlation coefficients was greater than 0.9. Fig.7(b) indicates the maximum hydrogen yield by substrate consumed was 130.57 mmol/mol happened at OLR of 16 kg/m3d. Based on these results, it was concluded that hydrogen production rate was enhanced with a higher OLR and hydrogen yield by substrate consumed was reduced with OLR greater than 16 kg/m3d. Comparing the results of hydrogen production rate and hydrogen yield, significant differences were found at OLRs between 8 and 32 kg/m3d. The hydrogen yield by substrate consumed was decreased as the OLR greater than 16 kg/m3d.

Fig.7 Performance of hydrogen fermentation at different organic loading rates:(a)hydrogen production rate; (b)hydrogen yield.
Fig.8 reveals the performance of biogas at different OLRs in the CMAGR. As in evident from the figure, the variation of biogas production rate and biogas yield were similar to hydrogen production rate and hydrogen yield. Fig.8 (a) shows a maximum biogas production rate of 25.02 mmol/hL at a OLR of 32 kg/m3d. Linear regression results show that biogas production rate (y) and OLRs (x) was proportionately correlated which can be expressed as y=0.7592x+2.58 (r2=0.939 5). The biogas yield by substrate consumed reached 252.02 mmol/mol at OLR of 16 kg/m3d and declined to 152.72 mmol/mol at OLR of 32 kg/m3d in Fig.8 (b).

Fig.8 Performance of biogas production at different organic loading rates: (a) biogas production rate; (b) biogas yield.
3.4 The relationship between liquid fermentation products and hydrogen production rate
Fig.9 shows the relationship between liquid fermentation products and hydrogen production rate. Maximum ethanol concentration of 55.8 mmol/L was obtained at hydrogen production rate of 12.51 mmol/hL. Acetic acid concentration of 42.41 mmol/L was observed at 12.51 mmol/hL. Butyric acid and propionic acid concentration decreased at hydrogen production rate of 7.68 mmol/hL, and increased to 13.3 mmol/L and 1.33 mmol/L, respectively, at hydrogen production rate of 12.51 mmol/hL. Overall, the ethanol concentrations were higher that the acetic acid concentrations at hydrogen production rates from 3.72 to 12.51 mmol/hL. Ethanol and acetic acid were the main by-products which suggested that ethanol fermentation was carried out by hydrogen-producing bacteria.


Fig.9 Relationship between liquid fermentation products and hydrogen production rate: (a) ethanol; (b) acetic acid; (c) butyric acid; (d) propionic acid
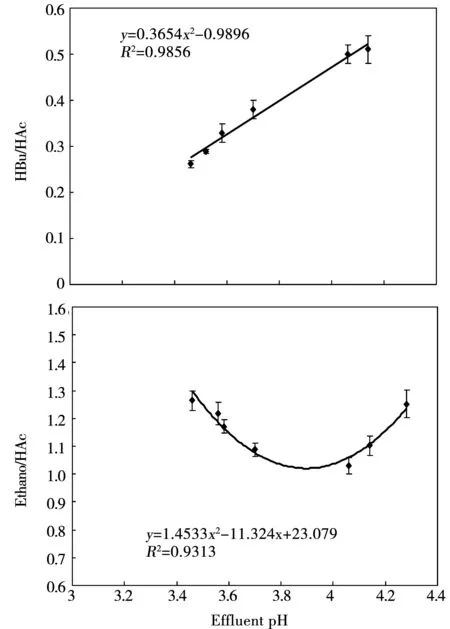
Fig.10 Ratio of butyric acid to acetic acid (a) and ethanol to acetic acid (b) at different pH value
3.6 The variation of Hbu/HAc and ethanol/HAc at different pHs
Fig.10 (a) and (b) illustrates the variation of butyric acid to acetic acid ratio and ethanol to acetic acid at different pHs, respectively. The ratio of butyric acid (HBu) to acetic acid (HAc) increased with increasing pH from 3.4 to 4.4. The HBu to HAc ratio was less than 0.6 mol/mol at pHs between 3.4 to 4.4 and the maximum of 0.51 mol/mol was obtained at pH of 4.14. Thus, greater pHs appeared to be favour to butyric acid production. The linear regression results show that HBu/HAc (y) and pHs (x) was proportionately correlated which can be expressed as y=0.3654x-0.9896 (r2=0.985 6). The variation of ethanol to HAc at different pHs is presented in Fig.10 (b). As evident from the figure, ethanol/HAc ratio was greater than 1.1 at pH fluctuated between 3.4-3.6 and 4.1-4.4 which indicated that these pHs were favour to ethanol type fermentation. The variation of HBu/HAc ratio and ethanol/HAc ratio with pH indicated that liquid fermentation products was significantly affected by pH. The linear relationship between ethanol/HAc ratio and pHs can be expressed by y=1.4533x2-11.324x+23.079(r2=0.931 3). pH has great effects on activity of microorganism which can lead to influence nutritious substrate ingestion and the performance of hydrogen-producing bacteria.
Conclusions
Based on the results of this study, we concluded that:
This study demonstrated the feasibility of biological H2production from molasses wastewater treatment in a continuous mixed attached growth reactor (CMAGR) with aeration pretreated sludge immobilized by activated granular carbon using enriched aerobic mixed inoculum at 35℃. When the influent COD concentration ranged from 2 000 mg/L to 6 000 mg/L and HRT was 6 h, resulting in high H2production ability (1.96 m3/m3d) and good COD removal rate (13%), respectively. The dominant position of ethanol-type fermentation microbe communities in the fermentative hydrogen producing system could be formed after 40 days acclimatization.
It was also investigated that the effects of organic loading rates (OLRs) on CMAGR hydrogen production system. It was found that hydrogen production yield increased from 3.72 mmol/hL to 12.51 mmol/hL as OLRs increased from 8 kg/m3d to 32 kg/m3d. The maximum hydrogen production rate of 12.51 mmol/hL at a OLR of 32 kg/m3d and the maximum hydrogen yield by substrate consumed was 130.57 mmol/mol happened at OLR of 16 kg/m3d. Greater pHs appeared to be favour to butyrate production and the maximum of 0.51 mol/mol was obtained at pH of 4.14. However, ethanol/acetate ratio was greater than 1.1 at pH fluctuated between 3.4-3.6 and 4.1-4.4 which indicated that these pHs were favour to ethanol type fermentation.
Acknowledgment
Financial support from the National Hi-Tech R&D Program (863 Program), Ministry of Science & Technology, China (Grant No. 2006AA05Z109) and Shanghai Science and Technology Bureau (Grant No.071605122) and Shanghai Education Committee (Grant No.07ZZ156) and GRAP09, Northeast Forestry University are gratefully acknowledged.
猜你喜欢
南京林业大学学报(自然科学版)(2022年1期)2022-11-30
南京林业大学学报(自然科学版)(2022年3期)2022-11-30
中国奶牛(2022年6期)2022-07-01
东北林业大学学报(2021年9期)2021-11-03
建材发展导向(2021年12期)2021-07-22
山东畜牧兽医(2021年4期)2021-04-28
童话世界(2020年32期)2020-12-25
新农业(2020年7期)2020-07-27
中学生数理化·八年级物理人教版(2019年3期)2019-04-25
养生保健指南(2017年5期)2017-05-26
