
ZnO@ZIF-8 Core-Shell Structure as Host for Highly Selective and Stable Pd/ZnO Catalysts for Hydrogenation of CO2 to Methanol
2019-03-22 06:34:40YINYazhiHUBingLIUGuoliangZHOUXiaohaiHONGXinlin
物理化学学报 2019年3期
YIN Yazhi, HU Bing, LIU Guoliang, ZHOU Xiaohai , HONG Xinlin
College of Chemistry and Molecular Sciences, Wuhan University, Wuhan 430072, P. R. China.
Abstract: Catalytic CO2 hydrogenation to methanol is a promising route to mitigate the negative effects of anthropogenic CO2. To develop an efficient Pd/ZnO catalyst, increasing the contact between Pd and ZnO is of the utmost importance, because “naked” Pd favors CO production via the reverse water-gas shift path. Here, we have utilized a ZnO@ZIF-8 core-shell structure to synthesize Pd/ZnO catalysts via Pd immobilization and calcination. The merit of this method is that the porous outer layer can offer abundant “guest rooms” for Pd,ensuring intimate contact between Pd and the postgenerated ZnO. The synthesized Pd/ZnO catalysts (PZZ8-T, T denotes the temperature of calcination in degree Celsius)is compared with a ZnO nanorod-immobilized Pd catalyst (PZ). When the catalytic reaction was performed at lower reaction temperatures (250, 270, and 290 °C), the highest methanol space time yield (STY) and highest STY per Pd achieved by PZ at 290 °C were 0.465 g gcat-1 h-1 and 13.0 g gPd-1 h-1, respectively. However, all the PZZ8-T catalysts exhibited methanol selectivity values greater than 67.0% at 290 °C, in sharp contrast to a methanol selectivity value of 32.8% for PZ at the same temperature. Thus, we performed additional investigations of the PZZ8-T catalysts at 310 and 360 °C, which are unusually high temperatures for CO2 hydrogenation to methanol because the required endothermic reaction is expected to be severely inhibited at such high temperatures. Interestingly, the PZZ8-T catalysts were observed to achieve a methanol selectivity value of approximately 60% at 310 °C, and PZZ8-400 was observed to maintain a methanol selectivity value of 51.9% even at a temperature of 360 °C. Thus, PZZ8-400 attains the highest methanol STY of 0.571 g gcat-1 h-1 at 310 °C.For a better understanding of the structure-performance relationship, we characterized the catalysts using different techniques, focusing especially on the surface properties. X-ray photoelectron spectroscopy (XPS) results indicated a linear relationship between the methanol selectivity and the surface PdZn : Pd ratio, proving that the surface PdZn phase is the active site for CO2 hydrogenation to methanol. Furthermore, analysis of the XPS O 1s spectrum together with the electronic paramagnetic resonance results revealed that both, the oxygen vacancy as well as the ZnO polar surface, played important roles in CO2 activation. Chemisorption techniques provided further quantitative and qualitative information regarding the Pd-ZnO interface that is closely related to the CO2 conversion rate. We believe that our results can provide insight into the catalytic reaction of CO2 hydrogenation from the perspective of surface science. In addition, this work is an illustrative example of the use of novel chemical structures in the fabrication of superior catalysts using a traditional formula.
Key Words: ZnO@ZIF-8; PdZn alloy; Methanol synthesis; CO2 hydrogenation; Surface oxygen vacancy
1 Introduction
Heterogeneous catalysis of CO2hydrogenation to methanol has recently been under extensive research due to environmental concerns1,2. The first commercial catalyst, a sulfur-resistant ZnO/Cr2O3, was patented by BASF in the early 1920s to synthesize methanol from CO2/CO/H2under 20-30 MPa and 300-400 °C3. Later, much cleaner syngas derived from naphtha or methane facilitated the development and final commercialization of Cu/ZnO/Al2O3by ICI in 1960s that brought down the reaction temperature and pressure to 200-300 °C and 5-10 MPa4. It is found that the Cu-ZnO synergy is crucial for the high activity of the catalyst, although the debate on the catalytic mechanism of Cu/ZnO over CO2hydrogenation to methanol has not stopped until today focusing at whether surface CuZn alloy5or Cu-ZnO interface6is the active site. Pdbased catalyst has also been found to be active for CO2hydrogenation and the type of support or promoter can be decisive for modulating the product selectivity7,8. Using ZnO to support Pd can shift the product distribution away from CO towards methanol9. However, the catalytic activity of Pd/ZnO varies a lot with different preparation method. Recently Xu et al.10show that methanol selectivity increases with the increase of PdZn/Pd0ratio of the reduced Pd/ZnO. Later, Liao et al.11reported a Pd@Zn core-shell structure that is highly selective toward methanol for CO2hydrogenation even at 2 MPa and the good activity was attributed to the surface enrichment of Zn0on Pd nanoparticles which is found to stabilize the formate intermediate and thus is beneficial for methanol formation. Pure ZnO cannot be reduced by H2, but ZnO in the vicinity of Pd in the Pd/ZnO catalyst can be reduced into Zn0as it can migrate onto Pd to form the active PdZn phase11. Thus it is naturally significant to achieve an intimate contact between Pd and ZnO in order to synthesize a highly selective and active Pd/ZnO catalyst.
Recently, metal organic frameworks (MOFs) are attracting attention due to their potential applications as efficient cocatalysts for CO2hydrogenation to methanol. For instance,Müller loaded Cu/ZnO into MOF-5 to fabricate Cu/ZnO@MOF-5 catalyst12. An’s work displayed that Cu/ZnOx@UiO-bpy catalysts can prevent the agglomeration of Cu NPs and phase separation between Cu and ZnOx, showing very high activity for the reaction13and similar idea has been adopted by Wang14. It can be seen that in such cases MOFs only serve as a supportive framework. But, it should also be noted that a very intimate contact between metal and MOFs has been achieved. We then turn our attention to ZIF-8, which is usually evolved out of a solution of Zn2+and 2-methyl imidazole15and can form ZnO under pyrolysis16and has been reported to encapsulate highly dispersed Pd within its scaffold17-19.
Interestingly, ZnO nanoparticles can be weakly dissolved in polar solvent to provide Zn2+for the growth of ZIF-820,21.Thinking of a ZnO@ZIF-8 structure fabricated in such a fashion,it is easy to picture that the pyrolysis of the core-shell structure would turn it back into ZnO with the same dimension as the mother ZnO and the porous outer layer as host can offer abundant “rooms” for Pd as guests ensuring intimate contact between Pd and post-generated ZnO. Thus, a comparison between the Pd/ZnO catalyst derived from pyrolysis of ZnO@ZIF-8 immobilized Pd and the one from ZnO immobilized Pd provides the perfect scenario to look into the pros and cons (related to the catalysis of CO2hydrogenation to methanol) of two methods of Pd/ZnO catalyst preparation, the former of which can achieve a better contact between Pd and ZnO moieties.
With such an inspiration, we carried out the following experiments in this work. We first synthesized a core-shell rod-ZnO@ZIF-8 by using rod-shaped ZnO nanoparticles as a sacrificial template to provide Zn source to grow ZIF-8 overlayer on it. Then we accommodated Pd nanoparticles inside the ZnO@ZIF-8 host and transformed the host-guest materials into Pd/ZnO catalysts (PZZ8-T) through calcination. The catalytic performance of the catalysts in CO2hydrogenation to methanol was compared with that of Pd immobilized on ZnO nanorods(PZ). Various characterization techniques especially surface characterization were carried out to understand the structureactivity relationship behind the different performance of the catalysts.
2 Experimental section
2.1 Catalyst preparation
2.1.1 Syntheses of ZnO and ZnO@ZIF8
Rod-shaped ZnO nanoparticles were synthesized via a hydrothermal route by Liu’s method22. The as-synthesized ZnO nanorods (0.3 g) were added to a round-bottom flask with DMF/H2O (14 mL, 1 : 1 of V/V), stirred for 1h. And then the flask was transferred to an oil bath preheated to 70 °C under magnetic stirring. After thermal equilibrium, 2-methylimidazole(0.6 g) with DMF/H2O (14 mL, 1 : 1 of V/V) was added rapidly and the reaction was maintained for 1h. The white product was collected by centrifugation, rinsed by ethanol for three times and then vacuum dried overnight at 50 °C.
2.1.2 Syntheses of ZnO and ZIF-8 immobilized Pd
ZnO@ZIF-8 (or ZnO) with Zn amount equivalent to 0.3 g ZnO was added into a Pd solution formed by dispersing 0.0413 g Na2PdCl4in 10 mL deionized water. After the mixture was kept under magnetic stirring for 1 h, 10 mL NaBH4solution (1.5 mg mL-1) was added into it dropwise to reduced PdCl42-for 2 h. The as-prepared ZnO@ZIF-8, ZIF-8 or ZnO immobilized Pd suspension was purified by centrifugation and washing with DI-water and ethanol each for three times, followed by vacuum drying at 50 °C overnight.
2.1.3 Syntheses of the catalysts: PZZ8-300, PZZ8-400,PZZ8-500 and PZ
Three aliquots of the above synthesized ZnO@ZIF-8 immobilized Pd were calcined in a muffle furnace at 300 °C,400 °C and 500 °C, respectively, for 2 h with a heating rate of 2 °C·min-1. The products were named as PZZ8-300, PZZ8-400 and PZZ8-500. Given that ZnO nanorod is a nonporous support,the as-prepared ZnO immobilized Pd was directly used as catalyst without calcination and it was denoted as PZ.
2.2 Characterization
2.2.1 Physicochemical
Inductively coupled plasma-atomic emission spectrometry(ICP-AES, IRIS Intrepid II XSP, Thermo Elemental, USA) was used to measure Pd loading. X-ray diffraction (XRD) spectra were recorded on a Bruker D8 Advance X-ray diffractometer(Bruker, Germany) with Cu Kαradiation and a generator operating at 40 kV and 40 mA. Samples were scanned from 5°to 85° with a step angle of 0.02°. Thermal gravimetric (TG)measurement was performed on an instrument by TA with a heating rate of 10 °C·min-1under air flow. Fourier-transform infrared (FTIR) spectra were collected on a Bruker Vertex 70(Bruker, Germany) using KBr as background. X-ray photoelectron spectra (XPS) were obtained on Thermo Scientific ESCALAB 250Xi X-ray Photoelectron Spectrometer(ThermoFisher Scientific, USA) with a monochromatic Al Kαsource. Before the test, all samples were stored in a container with Fe power which can prevent samples from oxidization.Sample data were calibrated by the binding energy of C 1s (284.8 eV). The Brunauer-Emmett-Teller (BET) surface area/porosity measurements were operated on a Micromeritics ASAP-2010 Analyzer (Micromeritics, USA) with N2adsorption-desorption at -196 °C. Transmission electron microscopy (TEM) images were taken in a JEM-2010 (JEOL, Japan) electron microscope.Electron paramagnetic resonance (EPR) was performed on a Bruker EMX spectrometer (Bruker, Germany).
2.2.2 Chemisorption
H2temperature-programmed desorption (H2TPD)experiments were performed on a Micromeritics Autochem 2920(Micromeritics, USA) to examine the hydrogen adsorption properties of the catalysts. The pretreatment steps are as follows.0.1 g of sample was placed upon a layer of quartz wool in a U-shaped quartz tube and reduced in a 10% H2/90% Ar flow of 30 mL·min-1at 300 °C for 1 h with a ramping rate of 10 °C·min-1and cooled down to room temperature in 30 mL·min-1of 10%H2/90% Ar. Then Ar flow (30 mL·min-1) was used to purge the residual H2for 1h. After the above pretreatment was done, the carrier gas was switched to Ar at a flow rate of 10 mL·min-1and the temperature was elevated to 700 °C at a rate of 10 °C·min-1while the TCD recording was started.
CO2TPD experiments were conducted on a Micromeritics Autochem 2920. The pretreatment steps are as follows. 0.1 g of the catalyst was placed upon a layer of quartz wool in a U-shaped quartz tube and reduced in a 10% H2/90% Ar flow of 30 mL·min-1at 300 °C for 1 h with a ramp rate of 10 °C·min-1. Then Ar (30 mL·min-1) was introduced to cool down the tube to room temperature and was further flushed for 1 h in order to remove extra hydrogen adsorbed on the surface. After heating up the sample to 60 °C, the gas was switched to 30 mL·min-1of CO2and CO2absorption was continued at 60 °C for 2 h. Finally the sample was flushed in Ar flow to ambient temperature. TPD measurement was carried out, using 30 mL·min-1of pure Ar as the carrier gas, from room temperature to 800 °C with a heating rate of 10 °C·min-1. And the signals were detected by a thermal conductivity detector (TCD, Micromeritics, USA).
2.2.3 Catalytic test

Fig. 1 (a) XRD profiles of rod-shaped ZnO, ZIF-8, ZnO@ZIF-8 and Pd/ZnO@ZIF-8 from 5° (2θ) to 85° (2θ).(b) SEM image of the ZnO@ZIF-8 immobilized Pd host-guest material.

Table 1 N2 physisorption results and ICP data.
All catalytic tests were carried out on a continuous flow fixedbed microreactor. Before activity test, 0.1 g catalyst was reduced at 300 °C in a flow of pure H2(20 mL·min-1) for 1 h under atmospheric pressure. After cooling to 80 °C, CO2/H2mixture with a molar ratio of 1 : 3 was fed into the reactor until the pressure inside increases to 4.5 MPa as controlled by a backpressure valve. Then the reactant gas flow (n(CO2)/n(H2) = 3)was set as 36 mL·min-1while the reaction temperature was raised up to 250, 270 and 290 °C, respectively. For PZZ8-T catalysts, catalytic data under another two temperature points,310 °C and 360 °C, were also collected. Post lines of the reactor were maintained at 150 °C to avoid condensation and the effluent products were analyzed online by a gas chromatograph equipped with a TCD detector.
The computational formulas are as follow:
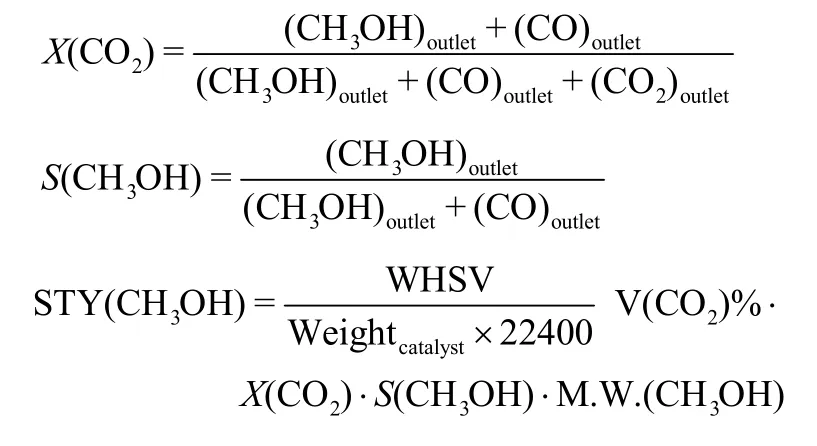
0.1 g of catalyst is used to calculate the STY.
3 Results and discussion
3.1 The physicochemical and textual properties
Fig. 1a displays the XRD patterns of rod-shaped ZnO, ZIF-8,ZnO@ZIF-8 and the catalyst precursor Pd/ZnO@ZIF-8. It can be clearly seen that both ZnO@ZIF-8 and Pd/ZnO@ZIF-8 hold the diffraction patterns of ZIF-8 and a wurtzite ZnO,demonstrating that ZIF-8 has been successfully grown by using ZnO as Zn source. The SEM image of Pd/ZnO@ZIF-8 in Fig.1b shows that the morphology of ZnO@ZIF-8 maintains the nano-rod shape of ZnO as reported in the reference19. From Table 1, we can see that pure ZIF-8 has a high BET surface area of 1459.6 m2·g-1and rod ZnO has a low BET surface area of 24 m2·g-1and those of ZnO@ZIF-8 and Pd/ZnO@ZIF-8 lie in between being 700-800 m2·g-1. With these results, we can initially conclude that ZnO@ZIF-8 indeed has a core-shell structure. ICP results show that the Pd loading in the series of catalyst falls in between a weight percentage of 3.5% to 4.2%.

Fig. 2 XRD profiles of the catalysts from 5° (2θ) to 85° (2θ).

Fig. 3 (a) Fourier-transform infrared transmission (FTIR) spectra obtained on compressed KBr pellets containing the tested samples. (b) TG curves of ZnO@ZIF-8 and the pre-catalysts Pd-ZnO@ZIF8 obtained at a liner temperature programming of 10 °C·min-1 under air flow of 20 mL·min-1.
The XRD patterns of the as-synthesized PZZ8-T and PZ catalysts shown in Fig. 2 demonstrate that ZIF-8 phase turned into wurtzite-type ZnO at all calcination temperatures. Fig. 3a shows the FTIR spectra of the PZZ8-T catalysts and the blank ZnO and ZIF-8. The black line presents ZIF8, depicting peaks at 3134 cm-1, 2929 cm-1and 1584 cm-1that are ascribed to the aromatic and aliphatic C―H stretches and the stretching vibration of the imidazole ring, respectively. Spectra of the catalysts (colored lines) show no characteristic peaks of ZIF-8 and match that of the ZnO blank (grey line), indicating that ZIF-8 components in the catalyst precursors have all been completely oxidized into ZnO. TG curves in Fig. 3b clearly show that Pd impairs the thermal stability of ZnO@ZIF-8 as the collapse temperature of Pd/ZnO@ZIF-8 was accelerated to prior to 300 °C compared with that of ZnO@ZIF-8. The inset graph in Fig. 2 is used to discern the state of Pd in the catalysts.Obviously, the calcination leads to the agglomeration of Pd particles since no diffraction peaks of Pd species are found on PZ while Pd (111) and PdO (110) peaks can be observed on PZZ8-400 and PZZ8-500 and Pd (111) on PZZ8-300. Both Pd(111) and PdO (110) peaks appear on PZZ8-300 and PZZ8-40023,, indicating that only a part of Pd has been oxidized during calcination which is probably due to the reduction atmosphere provided by the decomposition of ZIF-8 as well as the protection of Pd by surrounding ZnO24. When the pyrolysis temperature goes up to 500 °C, all Pd have been oxidized as only PdO (110)peak can be seen on PZZ8-500.
In order to characterize the microstructures of PZZ8-400, we observed the as-synthesized PZZ8-400 using HRTEM. From Fig. 4a, we can measure the lattice fringe of Pd (111) on some sub-5nm nanoparticles embedded in the rough surface layer of a ZnO rod with a diameter of 23 nm. Since the surface morphology of the ZnO nanorods would be much smoother as will be displayed later (Fig. 8a, b) and we previously proved that ZnO@ZIF-8 had been successful fabricated, it is sure the rough surface layer originates from the lamellar ZIF-8 grown around the ZnO rod25. The surface area of PZ is 27.3 m2·g-1, which is slightly higher than the value of about 20 m2·g-1reported in many other references26-28. PZZ8-T catalysts have surface area around 20 m2·g-1and when the calcination temperature is as high as 500 °C the surface area and porosity start to shrink compared with calcined at lower temperature. Although PZZ8-T catalysts have lower BET surface area than PZ, the porosity of the former are much higher than PZ (0.178 cm3·g-1vs 0.0377 cm3·g-1),suggesting that pyrolysis of ZIF-8 is indeed a good method of creating porous ZnO. The Pd particles size distribution is narrow and locates at a mean value of 2.2 nm as shown in Fig. 4b,demonstrating that confinement effect of MOFs is really beneficial for maintaining small size of noble metal nanoparticles during pyrolysis29,30.
3.2 The catalytic activity of catalysts
Fig. 5 shows the CH3OH selectivity, CO2conversion and CH3OH STY over PZZ8 and PZ catalysts. It is noteworthy that the three PZZ8 samples exhibit similar and high methanol selectivity which is stable against temperature elevation. At areaction temperature of 290 °C, CH3OH selectivity of PZZ8 samples all maintain at higher than 67%. In comparison,methanol selectivity for PZ is much lower and decreases drastically with increased reaction temperature from an initial 47.4% to 32.8%. Even at an unusually high temperature of 360 °C, the methanol selectivity over PZZ8-400 can maintain at 51.9%. The fact that methanol selectivity decreases with reaction temperature complies with the endothermic nature of the methanol synthesis reaction31. CO2conversion of PZ rapidly increases with the reaction temperature rise while the increase for PZZ8 samples is much less steep, which indicates that PZZ8 catalysts decrease the activation energy of CO2hydrogenation compared to PZ. The highest CO2conversion is 18.4% for PZ at 290 °C with 60.3% CO2transformed into CO via the reverse water gas shift (RWGS) reaction. PZZ8 series show much lower CO2conversion, and the relative regularity between 250 °C to 290 °C was: PZZ8-400 > PZZ8-500 > PZZ8-300. From the multiplicity of CO2conversion and methanol selectivity we derive the methanol STY for the series of catalysts as shown in Fig. 5c. Between 250 °C to 290 °C, a parabolic decay of the increase in methanol yield with temperature increment can be seen for all catalysts. All catalysts’ methanol STY reach the highest at 290 °C with similar values in the order of PZ (0.465 g gcat-1h-1) ≈ PZZ8-400 (0.461 g gcat-1h-1) > PZZ8-500 > PZZ8-300. Because the PZZ8-T catalysts maintained high methanol selectivity at 290 °C, we decided to extend the catalytic test to higher temperature zones. PZZ8-400 still has rather high methanol selectivity with 61.5% at 310 °C and 51.9% at 360 °C while the methanol selectivity of PZZ8-300 and PZZ8-500 fall off much steeply but the lowest value of 34.0% for PZZ8-300 at 360 °C is still higher than PZ at 290 °C. Interestingly, the CO2conversion of PZZ8-300 increases quite steeply with temperature. With a CO2conversion of 12.0% and methanol selectivity of 61.5%,PZZ8-300 reaches a very high methanol STY of 0.571 g gcat-1h-1at 310 °C. At 360 °C, all three catalysts’methanol yield is seen with a downturn due to severe thermodynamic throttle.

Fig. 4 (a) HRTEM image of PZZ8-400 depicts Pd and PdO nanoparticles deposited in the rough ZnO scaffold formed at the outer layer of 23 nm ZnO rod. (b) HRTEM image of PZZ8-400 shows averagely 2.2 nm Pd particles as confirmed by size counting.

Fig. 5 CH3OH selectivity (a), CO2 conversion (b) and CH3OH STY (c) over PZZ8 and PZ catalysts. Reaction conditions: 0.1 g catalyst was pre-reduced prior to the reaction at 300 °C under flow of H2. The reaction was carried out at 4.5 MPa with 1CO2: 3H2 at 36 mL min-1.
3.3 Time on stream catalytic test
To investigate the long term stability of the PZZ8-T catalysts,we subjected PZZ8-400 to a time on stream (TOS) test of nearly 116 h. From Fig. 6 it can be seen that at the end of TOS test the CO2conversion increases from 5.3% to 6.2% while methanol selectivity decrease from 76% to 72%. Thus there is an increase of about 10% in methanol yield after TOS test. We speculate that during the TOS test the microstructure of the catalyst is still evolving toward a slightly more efficient one.
3.4 The structure-activity relationship
The X-band CW EPR spectra of the as-synthesized catalysts as well as the support materials were shown in Fig. 7. The strong resonance of ZnO at g values near 1.96 mirror the shallow donor centers in the conduction band of ZnO32. This signal attenuated when ZIF-8 was grown around ZnO and almost faded after Pd plus a post calcination was introduced into the system, indicating the electron transfer from ZnO to Pd. Another feeble signal at g value around 2.03 was deemed to be caused by single electron trapped in oxygen vacancy in ZnO33. It can be deduced that PZ and PZZ8-300 have more oxygen vacancy than PZZ8-400 and PZZ8-500. These properties of the as-synthesized catalystswould have influence on their reduction behavior and in the following we would focus on the properties of the reduced catalysts.

Fig. 6 TOS test of nearly 116 h of PZZ8-400. Reaction conditions:0.1 g catalyst was pre-reduced prior to the reaction at 300 °C under flow of H2. The reaction was kept at 290 °C, 4.5 MPa with 1CO2 : 3H2 at 36 mL·min-1.

Fig. 7 The X-band CW EPR spectra of the as-synthesized catalysts as well as the support materials.
TEM and XRD characterization results are shown in Fig. 8. A characteristic feature of the reduced catalysts is the formation of PdZn alloy phase as evidenced by the clear lattice fringes of PdZn (111) in Fig. 8a, c as well as diffraction peaks of PdZn alloy in the XRD patterns in Fig. 8e, f. The particle size distribution of PZ and PZZ8-400 are similar to each other, demonstration the size of Pd species in both samples are near 5 nm. This, compared with the former 2.2 nm for the as-synthesized PZZ8-400,suggests that PdZn formation under a reduction temperature of 300 °C in H2can enlarge Pd particles size.
The XPS spectra of Pd 3d5/2in Fig. 9a provide information about the chemical state of Pd on the catalyst surface. Three valence states of Pd exist in PZ while the PZZ8 samples contain two kinds of Pd. The dark gray peaks at 335 eV are ascribed to Pd 3d5/2of metallic Pd and the light gray peaks at 336 eV belong to PdZn while the pink peaks at 337 eV are attributed to PdO34.The PdO phase in PZ probably results from the air oxidation of highly dispersed Pd in the sample. Table 2 lists the relative content of these three kinds of Pd species in each catalyst, as obtained by calculating the ratio of peak area. Thereinto the relative content of PdZn alloy is in the order of PZZ8 (66% to 67%) > PZ (41%). This trend is nearly identical to the methanol selectivity over the catalysts that PZZ8 all have a similar and higher selectivity than PZ. Tsang et al. reported that PdZn would stabilize the formate intermediate species thus facilitating the transformation toward methanol10,11. Here we are adding quantitative evidence into such a claim.
The O 1s spectra in Fig. 9b reveals three kinds of chemical states. The peaks from 530 eV to 530.4 eV belong to the innerlattice O in ZnO, those at 531.8 eV to oxygen vacancies and 532.8 eV to O in the polar surface of ZnO35,36. The relative quantity of oxygen vacancies of the reduced catalysts follows the order of PZ > PZZ8-300 > PZZ8-400 > PZZ8-500, which is in accord with the indication of EPR results. Meanwhile, as the calcination temperature goes higher, more polar surface evolve as can be seen from the increased peak ratio of O 1s at 532.8 eV for PZZ8-T catalysts. Schlögl et al. has found that oxygen defects in ZnO is beneficial for CO2activation37. Liao et al.showed that the polar surface of ZnO facilitate methanol formation as it would favor the stabilization of Cu thus resulting in more intimate Cu-ZnO synergy38. PZ catalyst has the highest oxygen vacancy content as well as the highest CO2conversion rate. The CO2conversion of PZZ8-300 only gets higher than PZZ8-400 and PZZ8-500 at high reaction temperature,indicating that the contribution of polar surface facilitated Pd-ZnO interface to CO2activation at lower reaction temperature cannot be neglected. Our catalytic results together with XPS results suggested that the above mentioned two effects both count in catalytic CO2hydrogenation reaction.

Fig. 8 (a) HRTEM image of reduced PZ. (b) TEM image of reduced PZ shows averagely 5.0 nm Pd-species particles as the inset shows the size distribution. (c) HRTEM image of reduced PZZ8-400. (d) TEM image of reduced PZZ8-400 shows averagely 4.9 nm Pd-species particles.(e) XRD patterns of PZZ8-T catalysts and PZ after H2 reduction. (f) Magnification of the 2θ region in (e) that is characteristic of Pd species.

Table 2 Relative contents of the Pd-species with different valence states on the surface of catalysts after catalytic evaluation,as obtained from the area ratio of correspondent peak component in the XPS spectra.
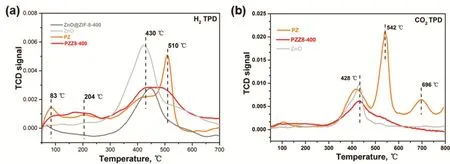
Fig. 10 H2-TPD (a) and CO2-TPD (b) of rod-shaped ZnO, PZ and PZZ8-400.
Chemisorption technique can provide further insight into the structure and properties of in situ reduced catalysts. Fig. 10a depicts the H2desorprtion profiles for catalysts and supports.The desorption peaks before 250 °C belong to hydrogen chemisorbed on Pd species. Hydrogenheterolytically adsorbed on ZnO starts to desorb at 430 °C. Compared with ZnO, PZ exhibits a characteristic strong desorption peak at 510 °C, which is unequivocally belonged to hydrogen adsorbed on Pd-ZnO interface (which include PdZn-ZnO) because hydrogen adsorbed on Pd species would not remain at such a high temperature34.PZZ8-400 also shows broad desorption regions at higher than 430 °C but the area is much lower than that of PZ. Again, in the CO2desorption patterns in Fig. 10b we can observe other than the sole one at 428 °C for ZnO the extra desorption peaks at 542 °C and 696 °C for PZ. The adsorption of CO2on Pd species is much weaker than on ZnO39, thus we consider this part of CO2to be chemisorbed on Pd-ZnO interface. The quantity of the adsorbed indicates the quantity of Pd-ZnO interface, which is also in accord with different CO2conversion rate in catalysis.
4 Conclusions
In this work, we successfully constructed a core-shell ZnO@ZIF-8 structure and innovatively used it as a host material to encapsulate Pd inside. Then we transformed the host-guest materials into Pd/ZnO catalysts for hydrogenation of CO2to methanol. In comparison with the contrast ZnO-immobilized Pd catalyst, the PZZ8-T showed much superior methanol selectivity in the reaction. At a high reaction temperature of 290 °C, the methanol selectivity for the PZZ8-T catalysts all exceed 67%while that for PZ is only 32.8%. At unusually higher reaction temperatures of 310 and 360 °C, the PZZ8-T catalysts can still maintain a very high methanol selectivity. Through XPS analysis, we found that the high methanol selectivity is attributed to a high surface content of PdZn which we deem as the active site for methanol synthesis. From the EPR and XPS O1s spectra,we also found that oxygen vacancy as well as a polar surface induced Pd-ZnO interface are two critical elements for CO2activation, which is further propped by the chemisorption characterization of H2TPD and CO2TPD. The current work is a good example of using novel chemical structures to fabricate better catalysts with a traditional formula and provides both the insight into the understanding of the catalytic reaction of CO2hydrogenation and the guidance for designing better catalysts.
- 物理化学学报的其它文章
- Preparation and Sensing Properties of Organic Gel Fluorescence Films Based on ZnS Nanoparticles
- Removal of Fluorides from Aqueous Solutions Using Fresh and Regenerated Activated Alumina
- Application of Ag Nanoparticle-Modified Fiber Probe for Plasmonic Catalysis Reaction
- Removal of Methyl Orange from Aqueous Solutions by a Novel Hyper-Cross-Linked Aromatic Triazine Porous Polymer
- In Situ Study of the Conversion Reaction of CO2 and CO2-H2 Mixtures in Radio Frequency Discharge Plasma
- Effect of Oxygen Partial Pressure on Solid Oxide Electrolysis Cells