Removal of Fluorides from Aqueous Solutions Using Fresh and Regenerated Activated Alumina
XU Xiangyu, LIAO Yanqing, SUN Jianchuan, WANG Xuhui, CHEN Shuaiqi, LV Zhi, SONG Jiaqing
State Key Laboratory of Chemical Engineering, Beijing University of Chemical Technology, Beijing 100029, P. R. China.
Abstract: Fluoride contamination of water is a problem worldwide and has caused great concern. Our study focused on the removal of fluorides from aqueous solutions using newly prepared and regenerated activated alumina. To obtain a suitable adsorbent, industrial boehmite was calcined from 573 K to 1473 K and the sample was characterized. The X-ray diffraction patterns showed that the sample was transformed to γ-alumina (activated alumina) at temperatures from 773 K to 1173 K, and the BET dates showed that the specific surface area of the sample decreased gradually from the temperature of 773 K to 1173 K. In our study, the activated alumina calcined from 773 K to 973 K was selected as the defluoridation adsorbent, and dynamic adsorption was employed for the removal of fluorides from aqueous solutions. The breakthrough curves demonstrated that the adsorption capacity of the adsorbent decreased with increasing calcination temperature. To investigate the effect of initial fluoride concentration on the adsorption capacity, 15 mg∙L-1, 20 mg∙L-1, and 25 mg∙L-1 fluoride solutions were selected as the initial aqueous fluoride solution. As a result, the capacity of the adsorbent increased gradually with the increase in the initial fluoride concentration. In order to improve the capacity, we also studied the regeneration process in our experiment. When the activated alumina was saturated by the fluorides, it was regenerated with a NaOH solution (pH = 13.0, 13.3, 13.5) and activated with a HCl solution (0.1 mol∙L-1). By a comparison of the five desorption and Al3+ dissolution rates during the regeneration process, it was determined that the NaOH solution with pH 13.0 was the most suitable desorption agent. An analysis of the nitrogen adsorption-desorption isotherm showed that its sharpness was almost unchanged after regeneration, which indicated that the pore structure of the adsorbent was not destroyed during this process. The change in the specific surface area and isoelectric point for the five-times regenerated adsorbent were important impact factors for fluoride adsorption. The specific surface area of the regenerated adsorbent increased, and the study of the zeta potential demonstrated that the isoelectric point also increased after regeneration. To observe the adsorption effect of regenerated activated alumina, we performed an adsorption experiment after each regeneration. The breakthrough curves demonstrated that the regenerated activated alumina exhibited faster saturation and increased adsorption capacity compared to fresh activated alumina. To elucidate the adsorption mechanism, IR spectroscopy was employed to characterize the O―H band of the adsorbent. The change in the Al―O―H content of the activated alumina during regeneration was the main factor impacting the fluoride adsorption capacity of the activated alumina.
Key Words: Defluoridation; Regeneration; Activated alumina; Breakthrough curve; Zeta potential
1 Introduction
According to the World Health Organization (WHO), fluoride is one of three chemicals that can lead to widespread health problems in human beings as a consequence of excessive exposure through drinking water1. Excess fluoride consumption can lead to dental fluorosis, skeletal fluorosis, and lesions of the endocrine glands, thyroid, and liver1-4. Nonetheless, fluoride is one of the most abundant inorganic anion contaminants in groundwater worldwide5,6.
Many methods have been investigated to remove excessive fluoride from water, including adsorption7-9, membrane separation methods, including reverse osmosis10, electrodialysis11,dialysis12, and nanofiltration13, electrocoagulation14, and ion exchange15. Among these methods, adsorption by activated alumina is one of the most effective technologies because of its low-cost, simplicity of operation, and effectivness even at low F-concentrations16-20. Currently, γ-alumina, with boehmite(AlOOH) as a precursor, calcined from 773 K to 1073 K, and with a high surface area, was employed for the removal of fluoride in a sewage disposal plant. Considering economic and environmental perspectives, regeneration of adsorbent is important, and thus the complete process of fluoride ion includes both adsorption of F-and regeneration of the adsorbent material.The fluoride removal capacity of activated alumina was about 2 mg·g-1within wide pH range of 4-8 in aqueous solution6,19-24.Usually, the regeneration process was performed by rinsing the alumina column with 0.1 mol·L-1NaOH to release the adsorbed fluoride ions. Then, the alumina was reactivated with 2% H2SO4 to recovery adsorption capacity6,19,20,25. There are two main challenges in the fluoride removal process. First, aluminum ions are dissolved from the surface of adsorbent material during the process of adsorption and regeneration. After every regeneration,about 5%-10% of alumina is lost. After three to four regenerations,the adsorbent is discarded and replaced19,20,24. Second, the fluoride adsorption capacity of activated alumina before and after regeneration is poor and requires further improvement6,19,24. In recent years, research was focused on increasing the adsorption capacity by modifying the adsorbent or changing the adsorption conditions and studying the aluminium dissolution during the adsorption process. However, few studies examined the regeneration process, especially the problem of aluminium dissolution during regeneration19,17,24,26-28. In order to reduce the dissolution of adsorbent and remain the high adsorption capacity during multiple regeneration process, the dissolution rate of adsorbent under desorption agent with different pH value, the change of specific surface area and the isoelectric point (IEP)were specifically studied.
In this paper, the adsorption performance of activated alumina as well as the regeneration behavior were studied. The defluorination capacity of activated alumina calcined at three different temperatures and the effect of three different inlet F-concentrations were examined. The fluoride adsorption capacity of the activated alumina after five regeneration cycles was also investigated. The breakthrough curve of defluoridation, the specific surface area, the isoelectric point, and the amount dissolved aluminum from regenerated activated alumina (AA)were compared to virgin AA. The IR spectra were used for analyzing OH groups in virgin AA and regenerated AA
2 Experimental and computational section
2.1 Materials
The chemicals used in our research were as follows: boehmite(AlOOH, Beijing Peking University Pioneer Technology Co.,Ltd., China), sodium fluoride (NaF, ≥ 98.0% (w), West Long Chemical Co., Ltd.), sodium hydroxide (NaOH, ≥ 96.0% (w),Beijing Chemical Works), hydrochloric acid (HCl, 36%-38%(w), Beijing Chemical Works), 1,2-ethylenediamine tetraacetic acid (C14H22N2O8, 99% (w), Shan Dong Xiya Chemical Industry Co., Ltd.), sodium chloride (NaCl, ≥ 98.0% (w), Beijing Chemical Works), acetic acid (CH3COOH, ≥ 99.5% (w), Beijing Chemical Works), potassium hydroxide (KOH, ≥ 82.0% (w),Beijing Chemical Works), potassium nitrate (KNO3, ≥ 99.0%(w), West Long Chemical Co., Ltd.), nitric acid (HNO3, 65%-68% (w), Beijing Chemical Works), ethanol (C2H5OH, > 99.7%(w), Beijing Fine Chemicals Co., Ltd.), and deionized water.
2.2 Adsorbent characterizations
X-ray diffraction (XRD) patterns were collected on an X-pert pro diffractometer with graphite monochromatized Cu Kα radiation at 40 kV, 40 mA. All diffraction data were recorded in the range of 2θ = 5°-80° with a successive scanning step rate of 5 (°)·min-1. The standard material (alpha quartz) was X-Ray powder Diffraction Intensity Set from National Institute of Standards and Technology (NIST) (D8 advance, Bruke,Germany).
Scanning electron microscopy (SEM) was employed to observe the morphology of the alumina particles. SEM images were obtained with a ZEISS SUpER55 scanning electron microscope (3/30 kV) (Supra 55, Zeiss, Germany).
Infrared spectra (IR) were collected on a Bruker Vector 22 FTIR spectrometer (spectral resolution 0.5 cm-1). For trasmittance experiments at room temperature, the sample was diluted 1 : 100 with dried KBr (Vector 22, Bruker, Germany).
Nitrogen adsorption-desorption measurements for the samples were carried out using a Micromeritics Tristar II 3020 Surface Area Analyzer under an outgassing temperature of 573 K. Surface areas of the samples were calculated by Brunauer-Emmett-Teller (BET) method, and the pore size distributions were calculated by Barret-Joyner-Halender (BJH) method(Trista II 3020, Micromeritics Instrument Corporation, USA).
The zeta potential describes the nature of the electrostatic potential near the surface of a particle. The higher the positive Zeta potential, the more readily anion exchange occurs on the surface of the adsorbent, resulting in the greater anion (e.g., F-)adsorption. The adsorbent was dispersed in a 0.01 mol·L-1potassium nitrate solution, and then the pH was adjusted with 0.01 mol·L-1potassium hydroxide and 0.01 mol·L-1nitric acid.The zeta potential of the adsorbent was measured by a Zetasizer nano instrument nano (Nano ZS Zen3600, Malvern, UK) at room temperature. Finally, the non-linear relationship between the Zeta potential and pH was obtained (Zetasizer Nano ZS,Malvern, UK).
2.3 Measurement of F- and Al3+
2.3.1 Measurement of F
The measurement of fluoride ion concentration was conducted using a fluoride ion selective electrode from Mettler Toledo Instrument Co., equipped with a LE 407 pH electrode. Accurate fluoride concentrations were obtained using a calibration curve with a range of 0.005-20 mg·L-1. To maintain a sufficient ionic strength, total ionic strength adjustment buffer (TISAB) was included in the experiments.
2.3.2 Measurement of dissolved Al3+
The analysis of dissolved aluminum was carried out with Inductively Coupled plasma Atomic Emission Spectroscopy(ICP-AES) on a Perkin Elmer Optima 5300 V in neutral or acidic conditions.
2.4 Study of adsorption and regeneration
2.4.1 Fluoride adsorption experiment
Column treatment is an indispensable way for treating wastewater at industrial scales. To study the column adsorption of fluoride, several glass tubes with an inner diameter of 1.5 cm and a length of 45 cm were used in the experiment. Glass fiber was used at the top and bottom of the column to obtain a uniform in and out flow. A given quantity of adsorbent was packed in the adsorption column. The fluoride solution was pumped into the adsorption column by peristaltic flow with a known fluoride concentration in rang of 15-25 mg·L-1and a flow rate of 3 mL·min-1. The solution at the column outlet was collected at fixed time intervals for measuring the fluoride concentration,which was detected by the fluoride ion selective electrode.
Typically, the column adsorption behavior was evaluated using a breakthrough curve, which can be plotted as the outlet fluoride concentration (or the ratio of the outlet concentration to the initial concentration) versus contact time. For a given initial fluoride concentration and flow rate, the total column adsorption capacity qtotal(mg, F) was obtained by integrating the area under the breakthrough curve. The total column adsorption capacity qtotal can be calculated from the Eq. (1)29:

where Q and Cad(Cad= C0- Ct) represent the feed flow rate and concentration of fluoride adsorbed, respectively. C0and Ctrepresent the initial inlet fluoride concentration and outlet fluoride concentration, respectively.
The equilibrium adsorption capacity qeq (mg·g-1) of the column was calculated from the Eq. (2)29:

where the M corresponds to the amount of adsorbent.
2.4.2 Fluoride desorption and adsorbent regeneration
The process of defluoridation is reversible, indicating that fluoride desorption can be performed when the adsorbent is saturated with fluoride ions. NaOH solution is a commonly used desorption agent. In our experiments, the adsorption column was first saturated with F-with an adsorbent content of 20 g for 50 h. Then, the loaded F-was desorbed using aqueous NaOH. The desorbed solution was collected for further analysis of fluoride concentration and dissolved aluminum content.
Low-cost regeneration contributs towards making the adsorption F-an efficient and attractive approach, however nearly all the studies only study a very short length of regenerating the used adsorbent6. In this paper, we focused on several different aspects of regeneration. In our work, the complete regeneration process involved four steps. First, the adsorption column was washed with deionized water. Second,the dried adsorbent was soaked with NaOH solution for 24 h.Third, the adsorbent was washed several times with a fixed amount of deionized water and dried in the oven. The purpose of these steps was to release as much fluoride as possible from the adsorption column. Fourth, the alumina particles were activated with 0.1 mol·L-1HCl solution for 2 h, washed with water to increase the pH, and dried for the next adsorption cycle. For each regeneration operation, the desorption rate (R1) was expressed as follows:

where, maand mbdenote the mass of desorbed fluoride and the last adsorbed fluoride mass, respectively. The fluoride residual rate (R2) of adsorbent after desorption was calculated as follows:

where mc denotes the mass of fluoride remained in the regenerated adsorbent. The regeneration rate (R3) was calculated as follows:

where m1and m2denote the total adsorption capacity of regenerated activated alumina and virgin activated alumina,respectively30. The dissolution rate of alumina (R4) was calculated as follows:

where, m3and m4denote the mass of dissolved aluminum (Al3+)during the regeneration and the mass of initial aluminum (Al3+)containing in the adsorbent, respectively.
2.4.3 Removal of fluoride and regeneration principle
The process for removing fluoride using alumina involves ion exchange and surface adsorption19,31. The ion exchange can be represented by the following formulas:

F-has a greater affinity for OH groups on the surface of alumina. The OH groups are easily replaced by F-if the amount of F-is sufficient to exchange with the OH groups. Eq. (9) holds when a very high concentration of F-is loaded on a unit weight of alumina32. Here, Al corresponds to the alumina surface.
In this experiment, sodium hydroxide and hydrochloric acid were used as desorption and activation agent, respectively. The regeneration and activation processes of the adsorbent were as follows:

3 Results and discussion
3.1 Characterization of adsorbents
3.1.1 XRD analysis
The adsorbent used in this study were industrial samples. The XRD patterns of sample calcined at different temperatures (573,673, 773, 873, 973, 1073, 1173, 1273, 1373 and 1473 K) for two hours are presented in Fig. 1. For an uncalcined sample as well as a sample calcined at 573 and 673 K, the characteristic peaks at 14.56°, 28.22°, 38.54°, 49.20°, 65.06° and 72.44° were suggestive of the structure of the boehmite. The sample appeared with γ-Al2O3 peaks (2θ = 66.83°, 46.02°, 37.16°, 39.60°) by calcination from 773 to 1173 K. With the temperature rising to 1273 K, a mixed crystal consisting of α-Al2O3 (2θ = 43.34°,35.14°, 57.48°, 25.58°, 37.78°) and δ-Al2O3(45.60°, 46.53°,32.84°) was obtained. When the temperature was 1373 K or higher, the sample completely transformed into α-Al2O3. In addition, the diffraction peak of α-Al2O3 was higher and narrower than other forms of alumina, which indicated the α-Al2O3 had higher crystallinity and a more stable structure.
3.1.2 SEM analysis
The SEM images of adsorbent were revealed in Fig. 2. The morphology of virgin activated alumina calcined at 773 K is shown in Fig. 2a,b. The morphology of activated alumina after the first regeneration is shown in Fig. 2c,d. It was clear that the adsorbents before and after regeneration both had a diameter of about 0.9 mm without obvious changes (Fig. 2a,c). The surface of regenerated activated alumina was smoother than that of virgin alumina. The phenomenon may due to a small amount of alumina dissolved at the surface of the adsorbent.
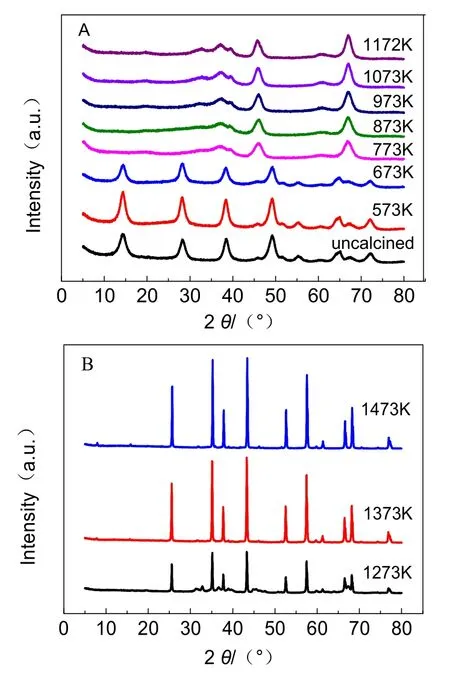
Fig. 1 XRD patterns of sample calcined at different temperatures.
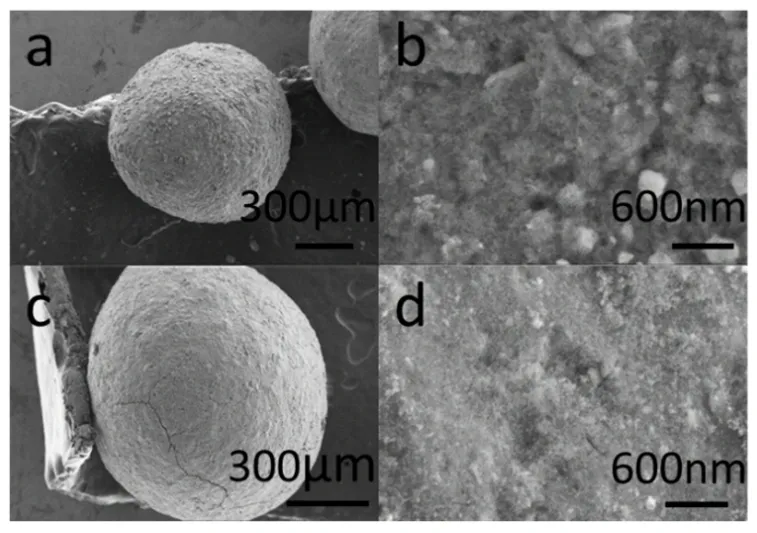
Fig. 2 SEM images of (a, b) virgin activated alumina and (c, d)first regenerated activated alumina.
3.1.3 BET analysis of samples
To study the effect of calcination temperature on sample, the samples were calcined at different temperatures from 573 K to 1273 K. The BET parameters of the sample after calcination at different temperatures are shown in Table 1. We found that the special surface area and pore volume of the sample were increased gradually from 573 to 773 K, and then decreased with further rising calcination temperatures. At lower calcination temperatures, the loss of water molecules on the alumina surface was attributed to the increase in surface area and pore volume.When the temperature went up to 773 K, the alumina was sintered, resulting in a decrease in surface area and pore volume.
3.2 Column adsorption experiments
In industrial wastewater treatment, dynamic adsorption is generally used for the removal of fluoride by loading the adsorbent into a packed column. The advantages of this method are that the operation is simple and the effect is stable. In our experiments, a granular adsorbent was used to defluoridation.Column adsorption studies were carried out at a constant adsorbent dose of 20 g, flow rate of 3 mL·min-1for 50 h, and pH of the initial F-solution without adjustment.
3.2.1 Removal of fluoride by activated alumina calcined at three different temperatures
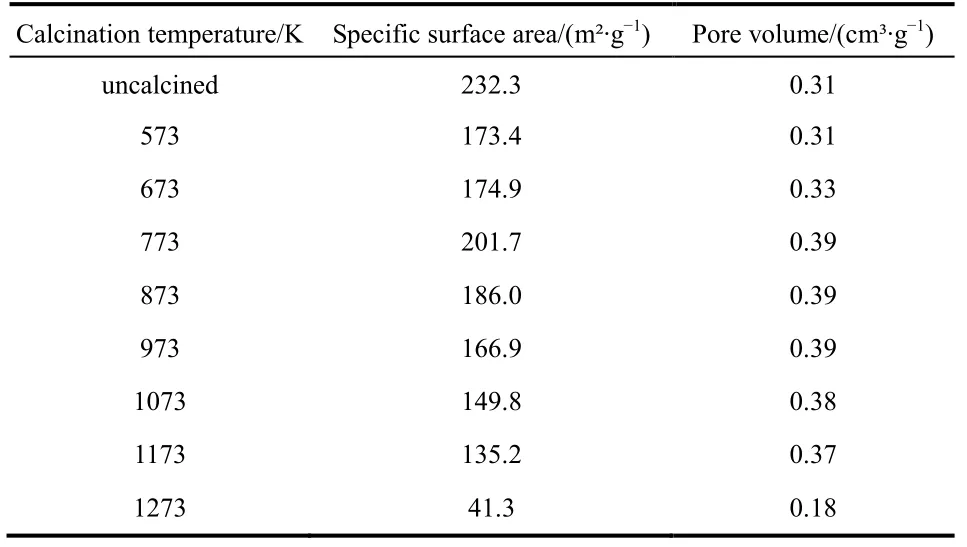
Table 1 The BET parameters of samples calcined at different temperatures.
Considering the influence of calcination temperature on the surface area and pore volume of adsorbent, samples calcined at 773, 873 and 973 K were selected as the adsorbent for the column adsorption study. The breakthrough curve of removal of fluoride using activated alumina with an initial F-concentration of 20 mg·L-1is shown in Fig. 3. In general, the breakthrough curve of defluoridation by activated alumina calcined at 773 K demonstrated the lowest outlet F-concentration, followed by that of AA calcined at 873 K. A non-linear three-parameter logarithmic function (Log3p1) was used to model the defluoridation process of these three kinds of aluminas. The analysis results are summarized in Table 2. The R2values of the equations are all more than 0.97, indicating that the breakthrough curves were well fitted by the model. It can be seen from Fig. 4 that adsorption capacity of adsorbents progressively decreased with increasing calcination temperature from 773 to 973 K.Table 1 shows that the surface area of the adsorbents decreased as the calcination temperature increased from 773 to 973 K.Thus, the change in fluoride adsorption capacity was similar to that of the surface area of the adsorbents. This is likely because more adsorption sites were available in higher surface area AA and more surface-exchange occurred between F-and OH groups. In addition, the molecular size of F-was so small that the pore size of the adsorbent had no effect on the adsorption of fluoride, indicating that F-freely entered the pores of the adsorbent. Based on this data, activated alumina calcined at 773 K was used in subsequent experiments.
3.2.2 Effect of initial fluoride concentration on defluoridation
Removal of fluoride at different initial F-concentrations of 15, 20 and 25 mg·L-1was investigated using activated alumina with a calcination temperature of 773 K. As shown in Fig. 5, at high initial F-concentrations, relatively sharper breakthrough curves and relative higher equilibrium concentration were obtained in the column adsorption process. The adsorption capacities were 2.18 mg·g-1, 2.53 mg·g-1, and 2.55 mg·g-1,respectively, and it increased with increased initial F-concentrations (Fig. 6). This can be explained by the increased driving force provided by the concentration gradient at higherinitial fluoride concentrations33. Compared with initial F-concentration of 20 mg·L-1, the adsorption capacity of 25 mg·L-1didn’t exhibit a significant increase. What’s more, higher concentrations fluoride corresponded to higher concentrations in wastewater, which was inconsistent with the concept of environmental protection. Therefore, an initial F-concentration of 20 mg·L-1was used in further experiments research.
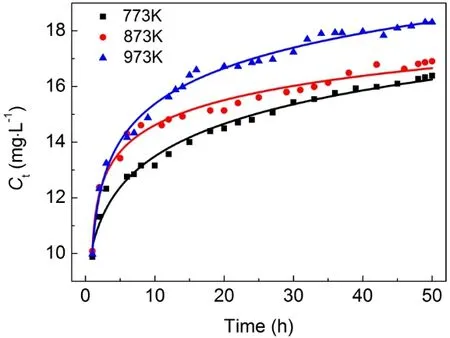
Fig. 3 Breakthrough curve of removal of fluoride using activated alumina calcined at 773, 873 and 973 K.
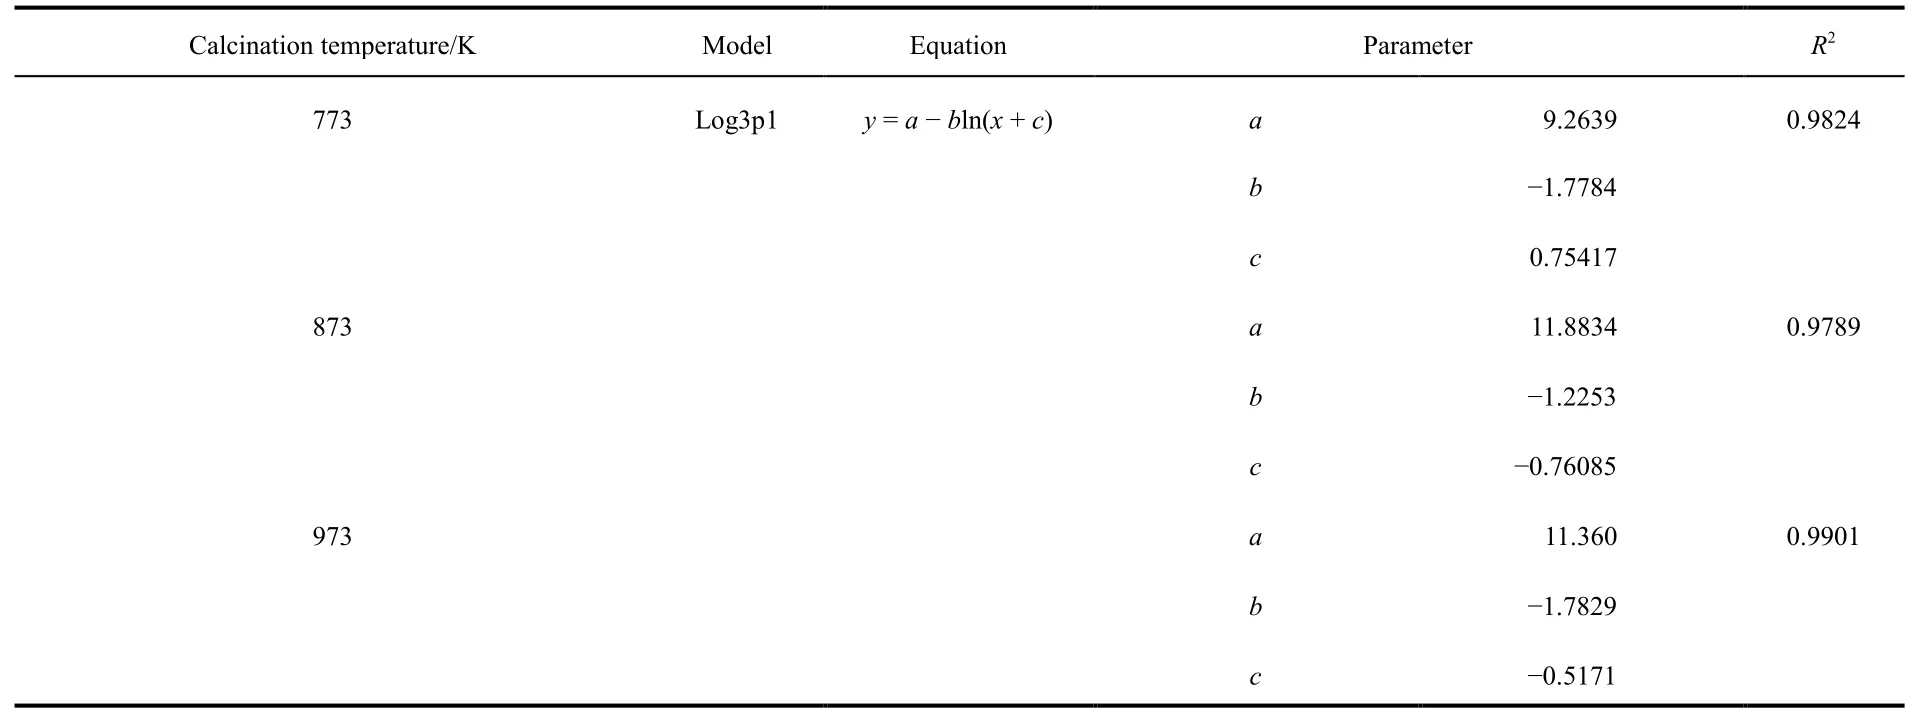
Table 2 Simulation equation parameters of breakthrough curve for defluoridation by adsorbents at three calcination temperatures.
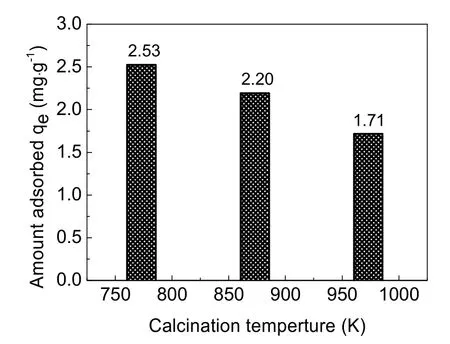
Fig. 4 Adsorption capacity of activated alumina calcined at different temperatures.
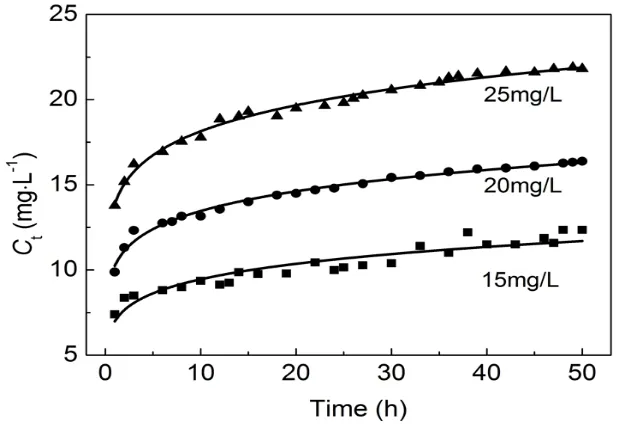
Fig. 5 Breakthrough curves of defluoridation by activated alumina at different initial F- concentrations.
3.3 Regeneration study
To maximize the efficiency of the adsorbent, lower operational costs, and reduce environmental pollution, adsorbent is regenerated and reused for any field applications in the treatment plant34. For detecting the adsorption capacity,regeneration rate, desorption rate, and dissolution rate of regenerated activated alumina, the spent adsorbent was subjected to five continuous adsorption-desorption cycles. In most studies, regenerating alumina with NaOH solution was the most effective and the most frequently used method. After desorption with NaOH solution, the adsorbent was activated with HCl solution. In order to determine amount of fluoride remaining in the regenerated adsorbent after each regeneration process, a given mass of adsorbent was first mixed with excess sodium hydroxide. Then, it was heated to 723 K to melt the sodium hydroxide. The melted sodium further melted the alumina for 1 h in a silver crucible. The melted mixture was washed with deionized water and prepared into 100 mL of solution. The F-concentration was measured with a fluoride ion selective electrode.
3.3.1 Study of desorption agent of different pH
In order to study the desorption rate and Al3+dissolution during the regeneration process, NaOH solution of different pH(pH = 13.0, 13.3, 13.5) was used as the desorption agent. The results of five desorption trials are showed in Fig. 7. Desorption rate increased with the increase in pH of NaOH solution. When the pH of NaOH solution was increased to 13.5, the first desorption rate reached 90.85% and the second desorption rate reached 100%. At all three pH levels, the desorption rate gradually increased from the first regeneration to the fifth regeneration.
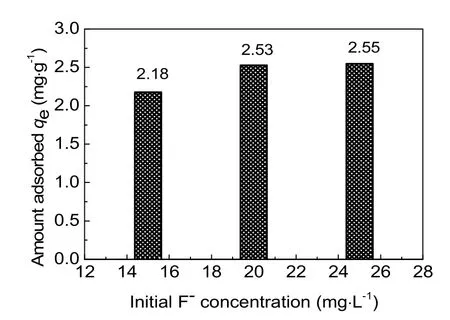
Fig. 6 Effect of initial F- concentration on the removal of fluoride by activated alumina.
Activated alumina could be dissolved in the process of desorption with sodium hydroxide and activation with hydrochloric acid. The dissolution of aluminum during the five desorption processes is shown in Fig. 8. The Al3+dissolution rates were greatly increased with the increase in pH of NaOH solution. When the pH of desorption solution was increased to 13.3, the dissolution rate was 3-4 times that of NaOH solution with a pH of 13.0. When the pH of desorption solution was increased to 13.5, the dissolution rate was up to 5-6 times that of the NaOH solution with a pH of 13.0. As the pH of NaOH solution increased from 13.0 to 13.5, the Al3+dissolution rates were 0.5%, 1.7%, and 2.5%, respectively. In addition, as shown in Table 3, after regenerating the adsorbent with sodium hydroxide solution of all three pH levels, the Al3+dissolution rates in the activation process with 0.1 mol·L-1HCl solution were all between 0.08%-0.09%. Together, Fig. 7 and Fig. 8 demonstrate that the desorption rate of NaOH solution at pH of 13.0 and 13.3 had no clear difference, whereas the Al3+dissolution rate of the desorption solution with a pH of 13.3 showed a sharp increase. When the pH of the NaOH solution reached 13.5, although the adsorbed fluoride was nearly completely released, the Al3+dissolution rate was unacceptably high. Therefore, a NaOH solution with a pH of 13.0 was most suitable as the desorption agent.
3.3.2 Analysis of nitrogen adsorption-desorption isotherm
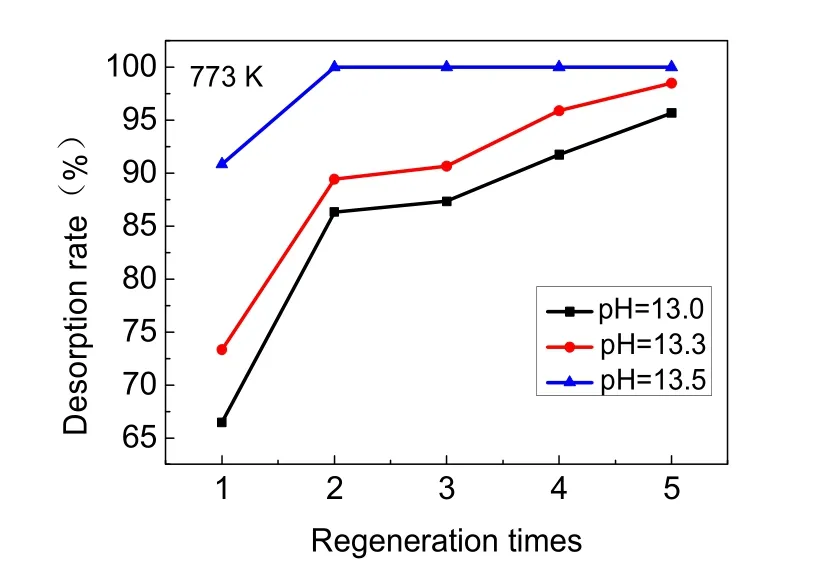
Fig. 7 Effect of NaOH solution of different pH on desorption rate.
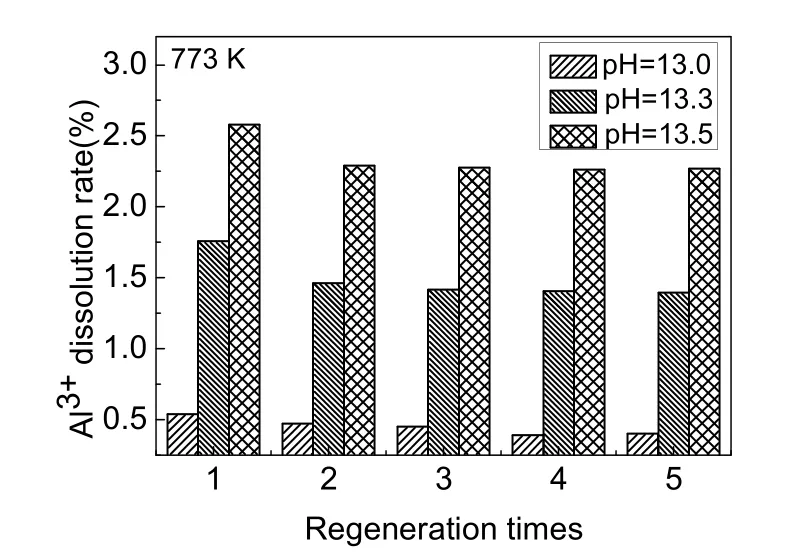
Fig. 8 Al3+ dissolution rate of adsorbent during five desorption.
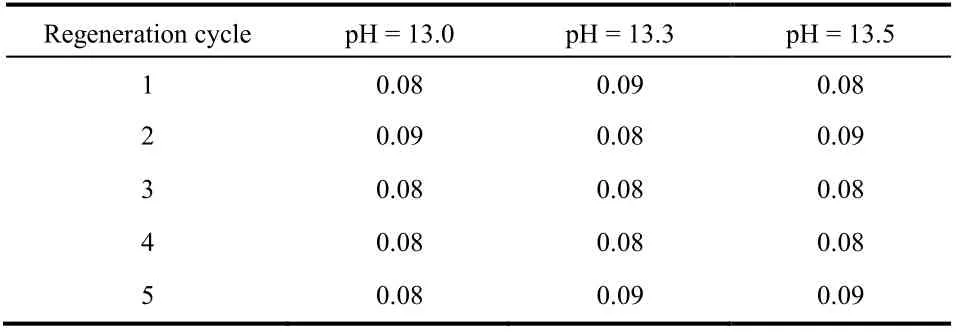
Table 3 Al3+ dissolution rate (%) in the activation process with 0.1 mol·L-1 HCl solution after desorption with NaOH solution atdifferent pH.
The adsorption-desorption isotherms of virgin AA and regenerated AA are shown in Fig. 9. The isotherms of regenerated activated alumina were in accordance with that of virgin AA. Both had the characteristics of a Type isotherm,which indicated that the pore structure of the adsorbent was not destroyed during the regeneration process. It can be seen that the adsorption curve and desorption curve did not completely coincide, forming a hysteresis loop, which presented a range of multilayer isotherms. The hysteresis loop was usually associated with capillary condensation, which took place in the filling and emptying of the mesopores. The results are consistent with the pore diameter of adsorbents (Table 4). The beginning of the Type isotherm was due to the monolayer-multilayer adsorption. In addition, this hysteresis loop exhibited a H3 shape, suggesting the existence of many mesopores35,36.
In regeneration process, the three parameters of BET, surface area, pore volume, and pore diameter were changed compared to the virgin AA. As seen in Table 4, the surface area, pore volume,and pore diameter increased after regeneration. After the first regeneration, the surface area was increased from 201.7 m²·g-1to 243.3 m²·g-1. The pore volume increased from 0.39 cm³·g-1to0.42 cm³·g-1. The pore diameter increased from 3.8 nm to 4.6 nm. This was mainly due to the shaping technology. During the shaping process, part of pores in the alumina were blocked,resulting in a decrease in these parameters. After regeneration,the blocked pores were opened again, and the parameters of alumina particles were increased.
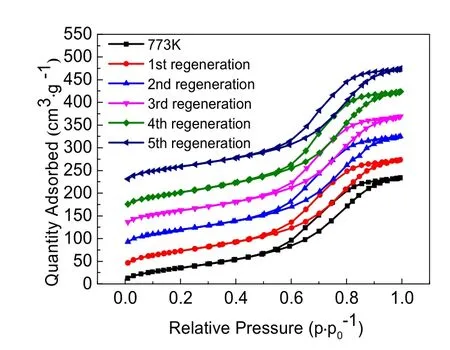
Fig. 9 Nitrogen adsorption-desorption isotherms of virgin AA and regenerated AA.
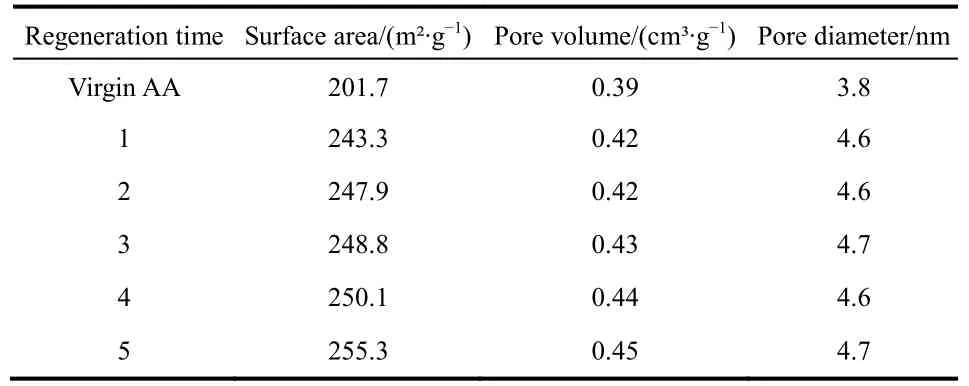
Table 4 Surface area and pore volume of five regenerated adsorbents.
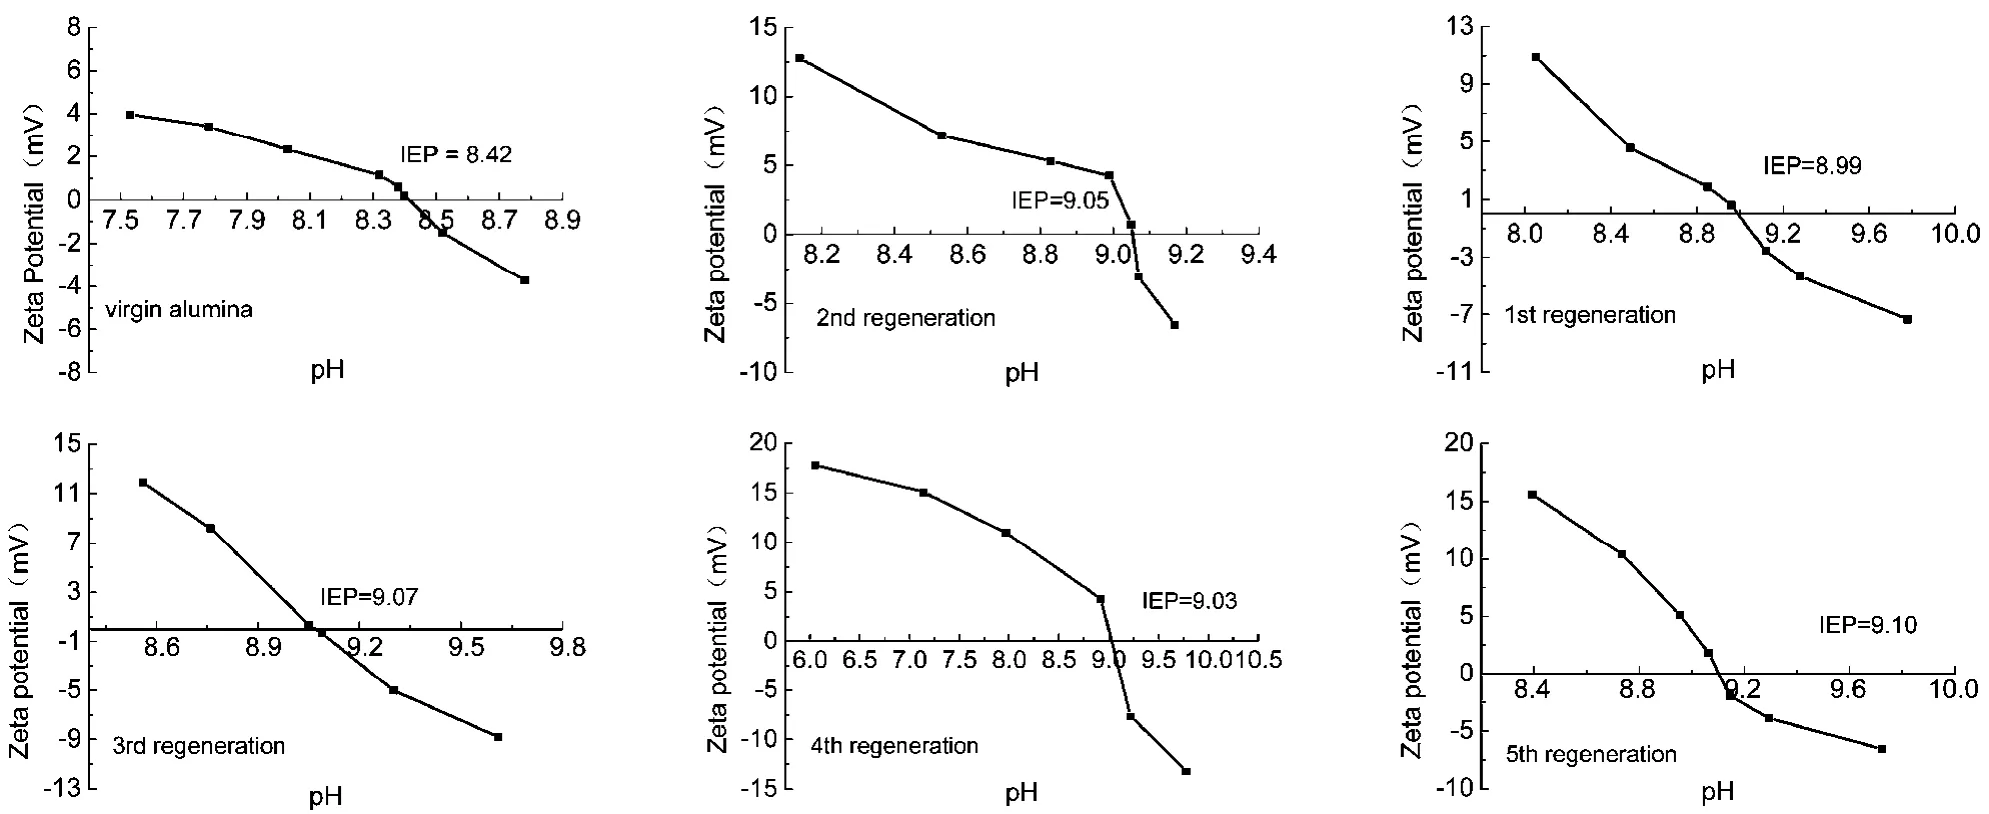
Fig. 10 Zeta potential of AA before and after regeneration as a function of pH.
3.3.3 Study of Zeta potential of regenerated alumina
In order to investigate the surface potential of the regenerated adsorbent, Zeta potential was measured. The plot of the Zeta potential of the adsorbent surface as a function of pH is shown in Fig. 10. The Zeta potential exhibited a decreasing trend with increasing pH of the homogeneous dispersion. When the Zeta potential value dropped to zero, the pH value represented the isoelectric point (IEP) at which the amount of positive ions equaled the amount of negative ions in solution. Furthermore,when the pH value of the solution was higher than the IEP, the surface charge of the alumina particles was negative. Although the pH value of the solution was lower than IEP, the surface of the alumina particles, owing to its positive charge, was well suited to the adsorption of anions, such as fluoride ions37. As shown in Fig. 10, the IEP of the virgin AA was located at pH 8.42. The IEP of adsorbents after regeneration were higher than that of the initial activated alumina, indicating more positive charge on the alumina surface. This is because the adsorbent surface was protonated by regeneration with NaOH and activation with HCl24.
3.3.4 Breakthrough curves of removal of fluoride by regenerated AA and its regeneration rate
Breakthrough curves of the removal of fluoride by regenerated aluminas at a dosage of 20 g with an initial F-concentration of 20 mg·L-1and flow rate of 3 mL·min-1for 50 h are shown in Fig. 11. Upon comparison with virgin alumina for the removal of fluoride in 10 h, the regenerated activated alumina exhibited a more rapid adsorption rate. In the following hours, the regenerated AA saturated at about 14 h, whereas the virgin AA gradually approached the similar condition until the end of the run. During the shaping process, part of pores in the alumina were blocked, resulting in the specific surface area decreasing. So the adsorption rate was very slow. After regeneration, the blocked pores were opened again, and the specific surface area were increased. Therefore, the adsorption rate was sharply increased after regeneration.
The adsorption capacities of regenerated adsorbents obtained from breakthrough curve are listed in Table 5. For the initial adsorption capacity of 2.53 mg·g-1, the total amount of adsorbed F-from the first regeneration to the third regeneration was increased, and that of the fourth and fifth time regeneration was slightly decreased. As shown in Fig. 12, the corresponding regeneration rates of the five regenerated AA were 118.2%,117.8%, 103.2%, 94.1%, and 91.70%, respectively. According to previous reports, the adsorption capacity of the regenerated adsorbent was decreased relative to the initial adsorption capacity32,38, but the trend in this experiment was different,indicating that the regeneration of adsorbent was more attractive for the defluoridation field because of its cost-effectiveness and high removal efficiency.

Table 5 The adsorption capacity of five regenerated adsorbents.
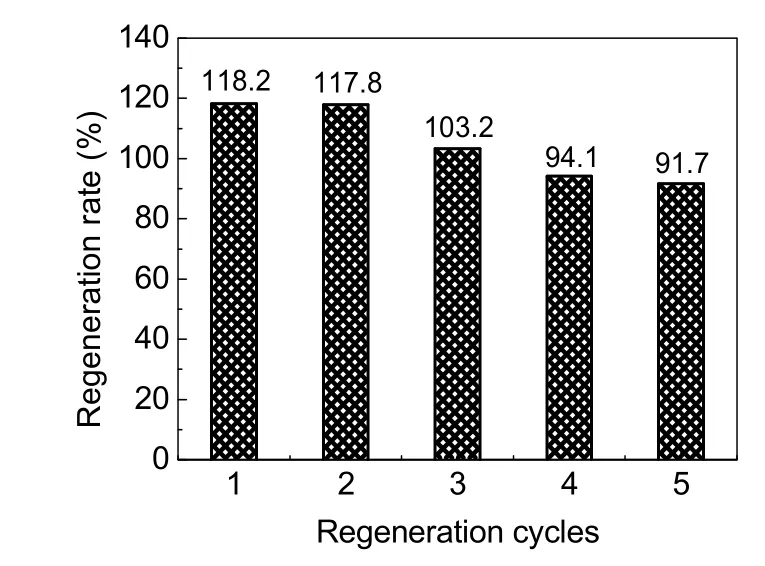
Fig. 12 Regeneration rate of five regeneration cycles.
The increase in adsorption capacity can be explained as follows. The surface areas of regenerated adsorbents increased from 20.61% to 26.53% as compared to the initial activated alumina (Table 4). Thus, more hydroxyl groups on the surface of the adsorbent was exchanged with F-. In addition, the IEP values of regenerated adsorbents were higher than that of virgin alumina (Fig. 10). This indicated a strong affinity for F-adsorption via electrostatic attraction because of more positive charges on the adsorbent surface.
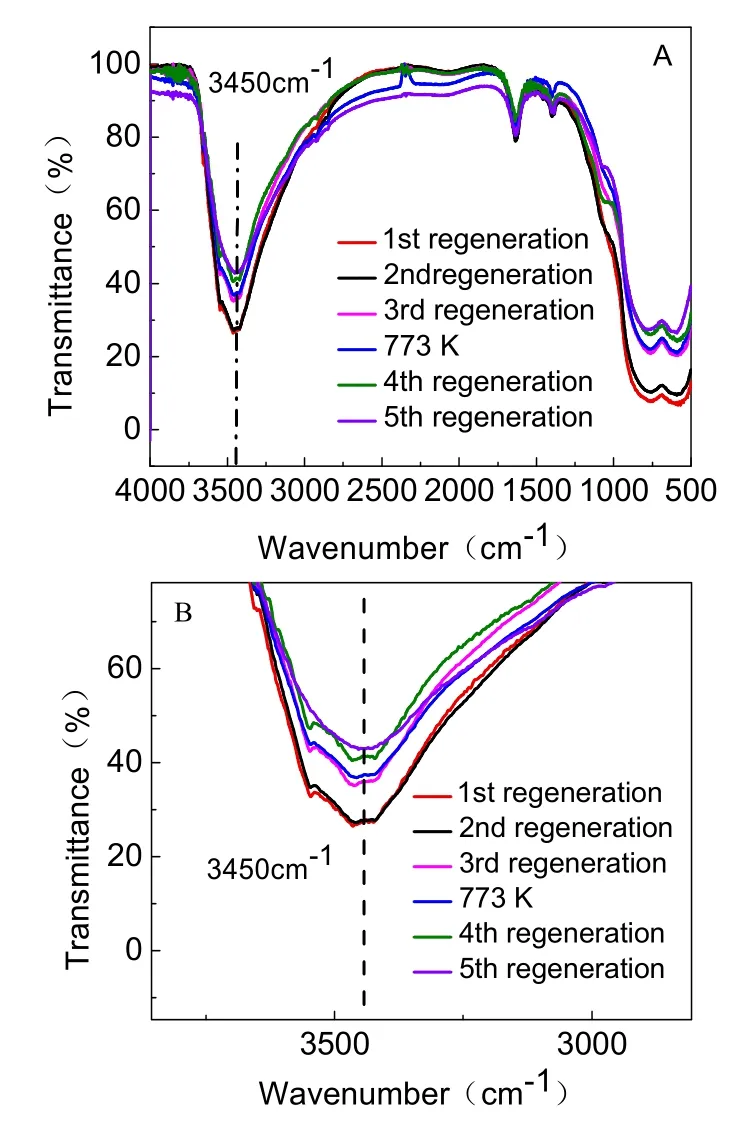
Fig. 13 IR spectra of five regenerated adsorbents.
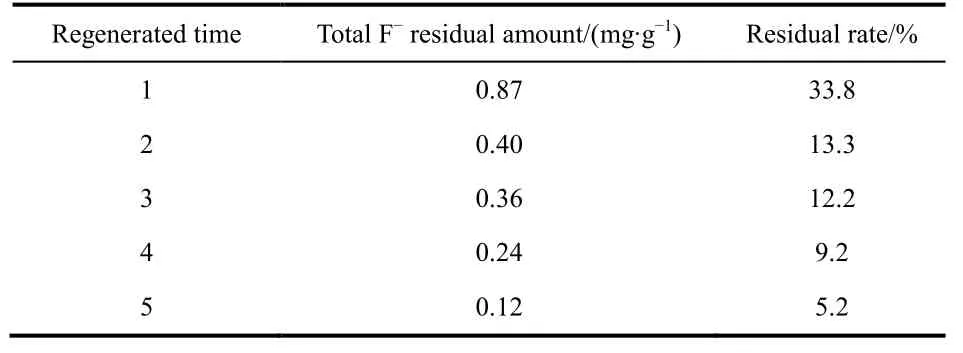
Table 6 Total fluoride amount remained in the regenerated adsorbents.
Irrespective of the initial activated alumina, the fluoride removal amount by alumina after five regeneration cycles was gradually decreased (Table 5). The loss of adsorbent in the process of adsorption and regeneration was one of the reasons for the weakened adsorption capacity. Although AA adsorbent was mainly composed of Al―O―H and Al―O, the Al attached to O―H was easier to dissolve than the Al―O. Furthermore,Al―O―H played an important role in the removal of fluoride.The IR spectrum (Fig. 13) is used for characterizing the O―H band. A prominent peak was located at 3450 cm-1, corresponding to the O―H stretching vibration absorption band. Moreover, the absorption peak gradually weakened with increasing regeneration time. The partial enlarged detail Fig .13B showed that absorption peak intensity of the five regenerated adsorbents were about 73.4%, 73.1%, 64.2%, 58.7%, and 57.0%,respectively. Thus, the amount of O―H nearly corresponded to adsorption capacity. The increase in dissolution of Al―O―H from the first regeneration to fifth regeneration lead to the subsequent decrease in adsorption capacity. Incomplete desorption is also an important factor. As shown in Fig. 8, the five desorption rates were 66.6%, 86.3%, 87.3%, 91.8%, and 95.7%, respectively. After each regeneration, the amount of F-remaining in the regenerated adsorbents is shown in Table 6. It can been seen that the F-residual rates were 33.8%, 13.3%,12.2%, 9.2%, and 5.2%, respectively. It may be because some fluoride was stuck in the pores of the adsorbent so that the fluoride was not completely released during each regeneration cycle, resulting in fewer adsorption sites and exchanged OH groups. The overall result is that the adsorption capacity gradually decreased with each regeneration cycle.
4 Conclusions
The study is meaningful for removal of fluoride from wastewater by activated alumina in industry and provides the basis for appropriate regeneration of adsorbent. In the study, we successfully regenerated the activated alumina calcined at 773 K, which was cost-effective and environmental. The conclusion in our study is as followed.
(1) The fluoride removal capacity of AA calcined at different temperatures and the effects of different input F-concentrations were studied. An adsorption capacity of 2.53 mg·g-1by AA was obtained with the optimal calcination temperature of 500 °C and an initial F-concentration of 20 mg·L-1.
(2) The desorption rates and Al3+dissolution rates increased with increasing pH of desorption agent from 13.0 to 13.5. The NaOH solution with pH of 13.0 was the best desorption agent.
(3) The regenerated AA exhibited promising results for removing fluoride from aqueous solution. After regeneration, the surface area and IEP of the adsorbent were increased compared to the virgin AA, which lead to an increase in adsorption capacity.
(4) The five regeneration rates were all more than 90%, which indicated that the regeneration of activated alumina calcined at 500 was successful.
(5) By IR spectra, the decrease of Al―O―H in the adsorbent after five regeneration process largely accounted for the decrease in fluoride removal capacities.
- 物理化学学报的其它文章
- Preparation and Sensing Properties of Organic Gel Fluorescence Films Based on ZnS Nanoparticles
- ZnO@ZIF-8 Core-Shell Structure as Host for Highly Selective and Stable Pd/ZnO Catalysts for Hydrogenation of CO2 to Methanol
- Application of Ag Nanoparticle-Modified Fiber Probe for Plasmonic Catalysis Reaction
- Removal of Methyl Orange from Aqueous Solutions by a Novel Hyper-Cross-Linked Aromatic Triazine Porous Polymer
- In Situ Study of the Conversion Reaction of CO2 and CO2-H2 Mixtures in Radio Frequency Discharge Plasma
- Effect of Oxygen Partial Pressure on Solid Oxide Electrolysis Cells

