
Increase in medium-size rainfall events will enhance the C-sequestration capacity of biological soil crusts
2019-03-14 01:50:16CuiHuaHuangFeiPengItaruShibataJunLuoXianXueKinyaAkashi2AtsushiTsunekawa2TaoWang
CuiHua Huang,Fei Peng,2,*,Itaru Shibata,Jun Luo,Xian Xue,Kinya Akashi2,,Atsushi Tsunekawa2,,Tao Wang
1.Minqin Salinization Research Station,Key Laboratory of Desert and Desertification,Northwest Institute of Eco-Environment and Resources,Chinese Academy of Science,Lanzhou,Gansu 730000,China
2.International Platform for Dryland Research and Education,Tottori University,Koyama-Minami,Tottori 680-8550,Japan
3.Arid Land Research Center,Tottori University,Hamasaka,Tottori 680-0001,Japan
ABSTRACT Biological soil crusts(BSCs)play important roles in the carbon(C)balance in arid regions.Net C balance of BSCs is strongly dependent on rainfall and consequent activation of microbes in the BSCs.The compensation-rainfall size for BSCs(the minimum rainfall amount for a positive net C balance)is assumed to be different with BSCs of different developmental stages.A field experiment with simulated rainfall amount(SRA)of 0,1,5,10,20,and 40 mm was conducted to examine the C fluxes and compensation-rainfall size of BSCs in different parts of fixed dunes in the ecotone between the Badain Jaran Desert and the Minqin Oasis.We found algae-lichen crust on the interdunes and crest,algae crust on the leeward side,and lichen-moss crust on the windward.Even a small rainfall(1 mm)can activate both photosynthesis and respiration of all types of BSCs.The gross ecosystem production,ecosystem respiration,and net ecosystem exchange were significantly affected by SRA,hours after the simulated rainfall,position on a dune,and their interactions.The rapid activation of photosynthesis provides a C source and therefore could be responsible for the increase of C efflux after each rewetting.C-uptake and-emission capacity of all the BSCs positively correlated with rainfall size,with the lowest C fluxes on the leeward side.The compensation rainfall for a net C uptake was 3.80,15.54,8.62,and 1.88 mm for BSCs on the interdunes,the leeward side,the crest,and the windward side,respectively.The whole dune started to show a net C uptake with an SRA of 5 mm and maximized with an SRA of about 30 mm.The compensation-rainfall size is negatively correlated with chlorophyll content.Our results suggest that BSCs will be favored in terms of C balance,and sand dune stabilization could be sustained with an increasing frequency of 5-10 mm rainfall events in the desert-oasis transitional zone.
Keywords:biological soil crust;rainfall size;desert-oasis ecotone;C balance;arid region
1 Introduction
Biological soil crusts(BSCs)—composed primarily of photosynthetic cyanobacteria,algae,lichen,mosses,and heterotrophic respiratory organisms in deserts—play important roles in desert ecosystems,such as the stabilization of sand dunes(Huang et al.,2014),fixation of carbon(C)and nitrogen(N)(Liu et al.,2017),plant colonization,promotion of increased soil microbial diversity(Darby et al.,2010;Bowker et al.,2013),capturing dust deposition,and improving the fertility of surface soil(Lange et al.,1998;Lin et al.,2010;Funk et al.,2014).Although no exact quantitative assessment of the coverage and distribution of BSCs has been conducted,the presence of BSCs(about 1 km in width)in the transitional zone between the Badain Jaran Desert and the Minqin Oasis is widely visible,serving as a very important ecological shelter for the oasis.The presence of BSCs enhances the friction threshold velocity and strengthens the ability of sand dunes to resist wind erosion and thus is able to protect the soil surface from wind erosion and to stabilize moving sand dunes(Belnap and Gillette,1997),hence lessening the occurrence of dust storms.
The development and community composition of BSCs are strongly influenced by the heterogeneity of wind-profile and soil physiochemical properties resulting from small-scale variation in microgeomorphology(Lin et al.,2010;Jia et al.,2012;Wu et al.,2013).In sand dunes,the cyanobacteria and algae generally dominate on the interdunes and the leeward side,while lichen and moss dominate on the crest and the windward side(Lin et al.,2010;Wu et al.,2013).The biological activity of all kinds of BSCs is primarily affected by water availability because crust organisms are metabolically active only when wet(Noy-Meir,1973).Although any water reaching the soil surface in arid and semiarid ecosystems would intuitively be considered to be beneficial to dry-land organisms(Lange et al.,1994;Jia et al.,2014),the size of the individual event is of great importance(Huxman et al.,2004;Bowling et al.,2011;Reed et al.,2012;Zhao et al.,2014).Small rainfall events(<5 mm)wet the surface soil(0-5 cm),where microbes and labile soil carbon are abundant,therefore promoting CO2efflux,while larger precipitation events(≥5 mm)cause microorganisms to enter and remain in the photosynthetic phase for a longer time(Thomas and Hoon,2010;Coe et al.,2012).The different water requirements for photosynthesis and respiration of various BSCs make them respond differently to changing rainfall amount(Su et al.,2012,2013;Zhao et al.,2014,2016).For example,moss crust shows the largest C gain when rainfall is about 5 mm(Coe et al.,2012;Wu et al.,2015),while cyanobacteria/lichen still show a net C loss even when rainfall amount is higher than 5 mm(Su et al.,2013).Thus,changes in the frequency of rainfall of different sizes are expected to have profound consequences on the development,maintenance,succession,and physiological functions of different types of BSCs(Belnap et al.,2004).
Rainfall less than 5 mm is ineffective and cannot be used by crops,while rainfall events with rainfall above 10 mm are rare in arid regions;and so in the study,we regarded rainfall of 5-10 mm as a mediumsize rainfall.Medium and large rainfall events can bring the microorganisms to activity in both photosynthesis and respiration.But the net C balance of different BSCs in a sand dune remains unclear,which might influence the BSCs'survival and therefore sand dune stabilization.In different sections of a sand dune,BSCs might be distinct.Moss and lichen dominating BSCs on the windward side and the crest tend to gain C in a large rainfall,as compared to algae-dominated BSCs on the leeward side and the interdunes.Thus,we hypothesize a net C gain with a large rainfall;therefore,an increase in medium-size rainfall events in this area would be beneficial for the BSCs'subsistence and sand dune stabilization.A field study to test our hypothesis was carried out with three one-week campaigns in June,August,and September 2015 in the transitional zone between the Badain Jaran Desert and the Minqin Oasis.
2 Materials and methods
2.1 Study area
An in situ field experiment was conducted in the ecotone between the Badain Jaran Desert and the Minqin Oasis,near the Gansu Desertification Control Station(38°35'N,103°03'E).Mean annual temperature in the study area is 7.8°C,and mean annual potential evapotranspiration is 2,664 mm.The annual precipitation is 110.7 mm,with most(88.5%)occurring in the growing season(May to September).The mean annual wind speed is 2.4 m/s,with a maximum of 23.0 m/s;and the main wind direction is northwest.Small rainfall events(<5 mm)account for 82.3%.The annual precipitation and rainy days with rainfall size of 5-10 mm show an increasing trend from 1953 to 2007(Du et al.,2011).The transitional area used to be colonized by xeric shrubs in the beginning of the 20th century but was taken over by moving sand dunes,due to extensive agricultural exploitation and the cutting of shrubs for fuel,starting in the 1950s(Xie et al.,2009).The Minqin area is recognized as a major source of the dust storms that frequent northern China,and the Minqin Oasis is endangered by moving sand dunes(Dong et al.,2010).The moving sand dunes were gradually settled down due to strict local environmental and agricultural management since the last decade of the 20th century,and the area is now inhabited by fixed dunes(Du et al.,2009).BSCs are essential bioindicators of the desertification process(Bowker et al.,2006;Jia et al.,2008).On the surface of the fixed dunes,there is a 2-cm-thick BSC layer.The dark-colored BSCs are generally on the interdunes and the crest,with the light-colored on the leeward side and moss on the windward;dead shrubs sporadically dot the dunes.
2.2 Experimental procedure
2.2.1 Soil texture,organic carbon,and nitrogen
Three neighboring fixed dunes(height 1.2-1.6 m)about 1 km away from the Minqin Integrated Desert Control Experimental Station were randomly selected as experimentaltargets.Naturalvegetation had formed on these sand dunes,including BSCs of unknown generation.Four research sites were set up on the respective sand dunes,and designated as interdune,leeward,crest,and windward.These four sites stretched from northwest to southeast.Soil samples on the interdunes,the leeward side,the crest,and the windward side of the three dunes were collected at the depths of 0-2 and 2-5 cm on June 12,2015,to analyze the soil's chemical and physical characteristics.In total,there were 24 soil samples.Soil organic carbon(SOC)was measured by the Walkley-Black method,and total nitrogen(TN)was measured by the Kjeldahl method.The determination of ammonia nitrogen(NH+4)and nitrate-nitrogen(NO-3)was done by the ammonium reagent colorimetric method and ultraviolet spectrophotometry(Ultraviolet spectrophotometry,MAPADA,UV-3300,Shanghai,China),respectively.Soil texture was measured by a laser particle analyzer(Mastersizer 2000,Marven,UK)in the laboratory at Lanzhou University.
2.2.2 Soil moisture
For each soil sample,the same amount of water was added to the soil surface near the collar which used for measurement of soil respiration.Soil samples were taken at the same time that CO2fluxes were measured.The collected samples were put into aluminum boxes and dried at 105°C for 24 hours to obtain the soil moisture.
2.2.3 Rainfall-intensity simulation and CO2-flux measurement
Twelve stainless steel collars(14.5 cm in diameter,and surface area was 154 cm2)were inserted into the soil at interdune,leeward,crest,and windward sites of the three dunes,respectively,1 month prior to the first rainfall simulation.The collar maintained close contact with the measurement chamber and prevented gas leaks during measurement.
Based on the annual precipitation,rainy days with a rainfall size of 5-10 mm,and some research work in the study area,the researchers selected the simulation-rainfall sizes as 1,5,10,20,and 40 mm.In June,August,and September,tap water from a nearby research station was applied to BSCs in different parts of the dunes to simulate rainfall amount(SRA)of 1,5,10,20 and 40 mm,respectively.To simulate rainfall of 1,5,10,20,and 40 mm,then 15.4,76.9,153.9,307.8,and 615.7 mL of water,respectively,were applied to the soil surface.The rainfall simulation was carried out by a hand-made sprayer.The water was carefully poured into the collar,periodically allowing the water to infiltrate.Although this procedure led to some disruption of the surface crust,it reflects what would happen naturally during the high-intensity rainfall events recorded for the study area.
From June 12 to 16,water of 15.4,76.9,153.9,and 307.8 mL was added to the soil surface at 08:00 a.m.everyday to simulate rainfall of 1,5,10,and 20 mm,respectively.From August 14 to 21,the same SRA was conducted,with an additional rainfall amount of 40 mm.In September,water equivalent to 1 mm and 5 mm was added to the soil surface.Before each simulation campaign,the soil surface had not received rainfall for at least one week.
In the measurement of CO2fluxes,net ecosystem exchange(NEE)was measured by a self-made transparent chamber(14 cm in diameter,2,000 cm3in volume)attached to the LiCor-6400(Li-Cor 6400,Lincoln,NE,USA);and ecosystem respiration(ER)was measured by covering an opaque,which can prevent the radiation and photosynthesis.CO2concentrations were taken at 10-second intervals during a 90-second period.NEE and ER were determined from the time course of the CO2concentrations.Calculation of NEE and ER is based on the changing rate of CO2during the period,the volume of the chamber,and the air pressure(Peng et al.,2015).

Gross ecosystem productivity(GEP)was calculated as the sum of NEE and ER.Although CO2fluxes on the soil surface were about 0µmol(m2/s)in the dry condition,ER and NEE were still measured with a transparent chamber(14 cm in diameter,2,000 cm3in volume)attached to an infrared gas analyzer(Li-Cor 6400,Lincoln,NE,USA)before each rainfall simulation.And the times in the dry condition were set as references to determine how long the measurement lasted.The results of test measurements showed that CO2fluxes with a 40-mm rainfall simulation were similar to those in the dry condition 10 hours af-ter rainfall simulation.Thus,measurements of CO2fluxes under all SRA lasted for 10 hours after rainfall(HAF).After adding water to the soil surface,CO2fluxes were first measured about 10 minutes later;and the values were considered as the 0 HAF simulation.For the measurement 10 minutes later,two people worked together.For example,one person simulated the rainfall on the windward side and then,after about 5-6 minutes,continued to water the crest.The other person began to measure the CO2fluxes 10 minutes after the rainfall simulation on the windward side and then continued to the crest.The whole process was to be finished in one hour for all twelve crusts.Then,the measurements were carried out over a one-hour interval within the first two hours,and then over a two-hour interval for the following measurements.The crust-surface layer was sampled on each site and pretreated with a sufficient amount of water to revive the crust.Subsequently,these crust samples were cut into squares of 1cm×1cm,then ground completely with mortar and pestle in the presence of ethanol.The homogenate was placed in the dark for 10 minutes,then centrifuged at 12,000 g for 30 minutes.The supernatant was transferred to a new tube.More ethanol was added,and this process was twice repeated.Finally,the solution was diluted to 25 mL with ethanol,and the absorbance of this solution was measured at the wave lengths 649 nm and 665 nm by ultraviolet spectrophotometry(Ultraviolet spectrophotometry,MAPADA,UV-3300,Shanghai,China).Chlorophyll content was calculated following the formula;

where OD665is the absorbance at wave length 665 nm,and OD649is the absorbance at wave length 649 nm.
2.3 Coverage measurement
One plot of 1m×1m was selected to measure the coverage of algae,lichen,and moss on the interdunes,the leeward side,the crest,and the windward side of each sand dune.The coverage of algae,lichen,and moss was measured at five points on each plot,using a wire netting(12cm×12cm).The interval for the netting was 6 mm,which made 400 small quadrats for each point.Before being measured,the crust surface was wetted by a water sprayer for easy identification of algae,lichen,and moss.
2.4 Data analysis
One-way ANOVA was employed to test the difference of SOC,TN,,clay,silt,and sand content,and the pH of soil between the surface and subsurface on the windward side,the crest,the leeward side,and the interdunes.Four-way ANOVA was used to test the effects of month,position on a dune,HAF,SRA,and their interactions on NEE,ER,and GEP.The cumulated NEE and ER for each rainfall simulation were estimated by summing the products of the average NEE/ER and the number of hours between measurements.Linear fitting was used to explore the relationship between SRA and the cumulated C fluxes on the windward side,the crest,the leeward side,and the interdunes;and polynomial fitting was used to examine the relationship between SRA and cumulated NEE of all crusts for a whole dune.Post hoc analysis was conducted to make multiple comparisons of C fluxes between HAF,SRA,and position on a dune.
3 Results
3.1 Soil physiochemical features and moisture
3.2 Algae,lichen,and moss coverage and chloro‐phyll content of crusts on different parts of a dune
At nearly 95%,algae coverage was significantly higher on the leeward side than on the other three parts of a dune(Figure 2).Algae coverage on the crest and interdunes had no significant difference,but they were significantly higher than that on the windward side,which was only 1.7%(Figure 2).Lichen coverage showed no difference among interdune,crest,and windward sites,at 50%-60%;and it was much lower on the leeward side(Figure 2).Moss was observed only on the crest and the windward side,with a significantly higher percentage of coverage on the windward side(Figure 2).In short,it was algae-lichen BSCs on the interdunes and crest,algae BSCs on the leeward side,and lichen-moss BSCs on the windward side.The chlorophyll content of moss on the windward side was the highest,about 55µg/cm2,followed by 30,28,and 22µg/cm2of lichen on the windward side,interdunes,and crest,respectively.Algae on the leeward side had the lowest chlorophyll content,about 12µg/cm2(Figure 3).
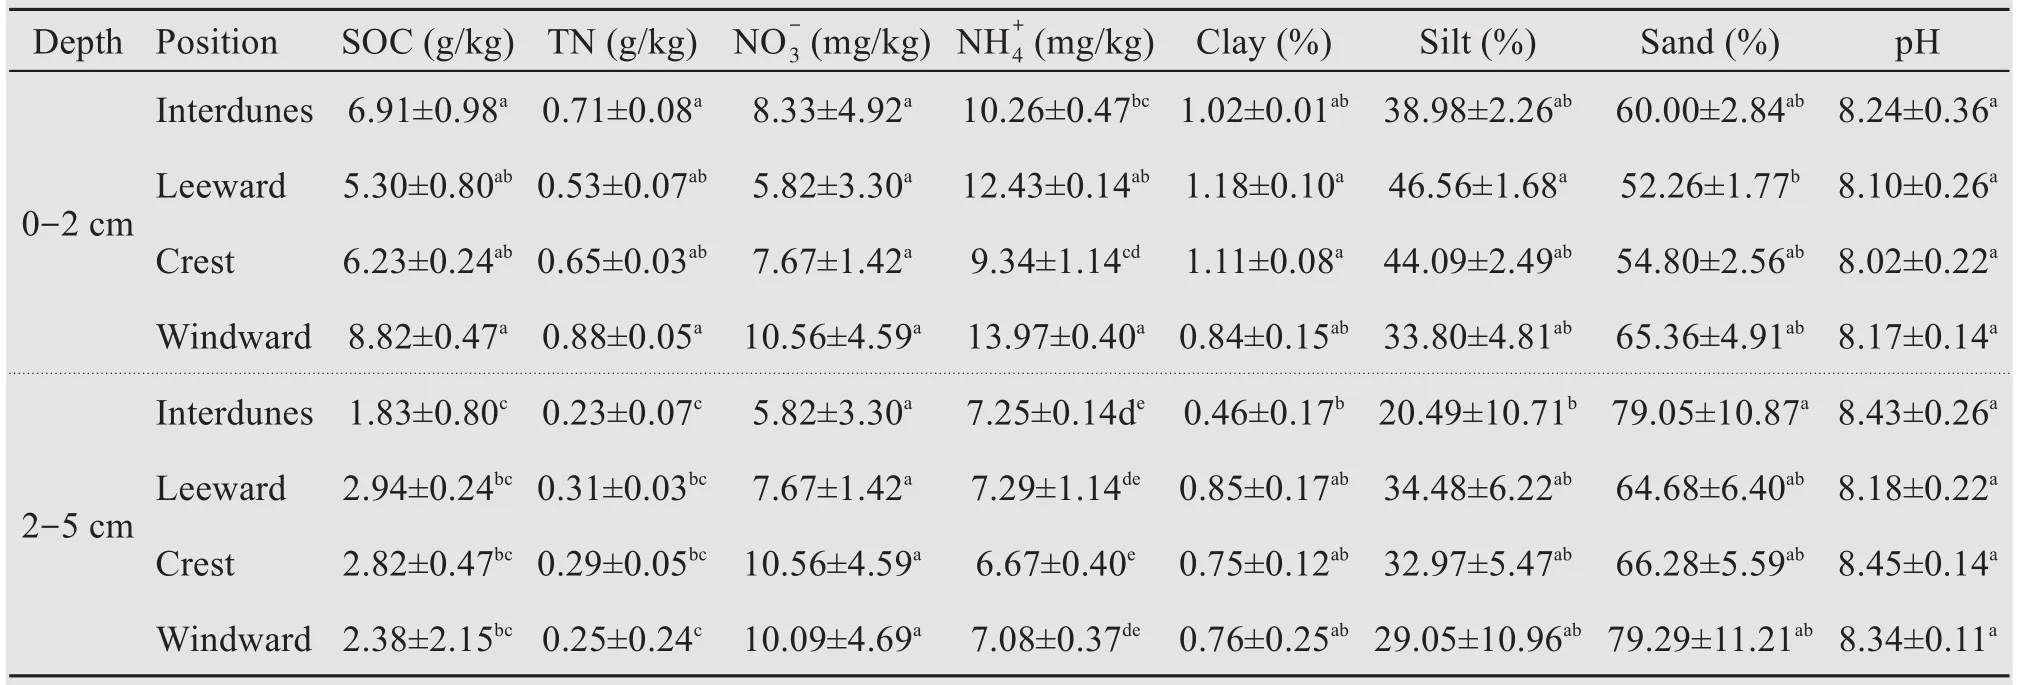
Table 1 Soil texture and chemical characteristics for different parts of the dune at the surface(0-2 cm)and subsurface(2-5 cm)layers

Figure 1 Soil moisture after each rainfall simulation of 0,1,5,10,20,and 40 mm.Error bars are the standard error of three replicates
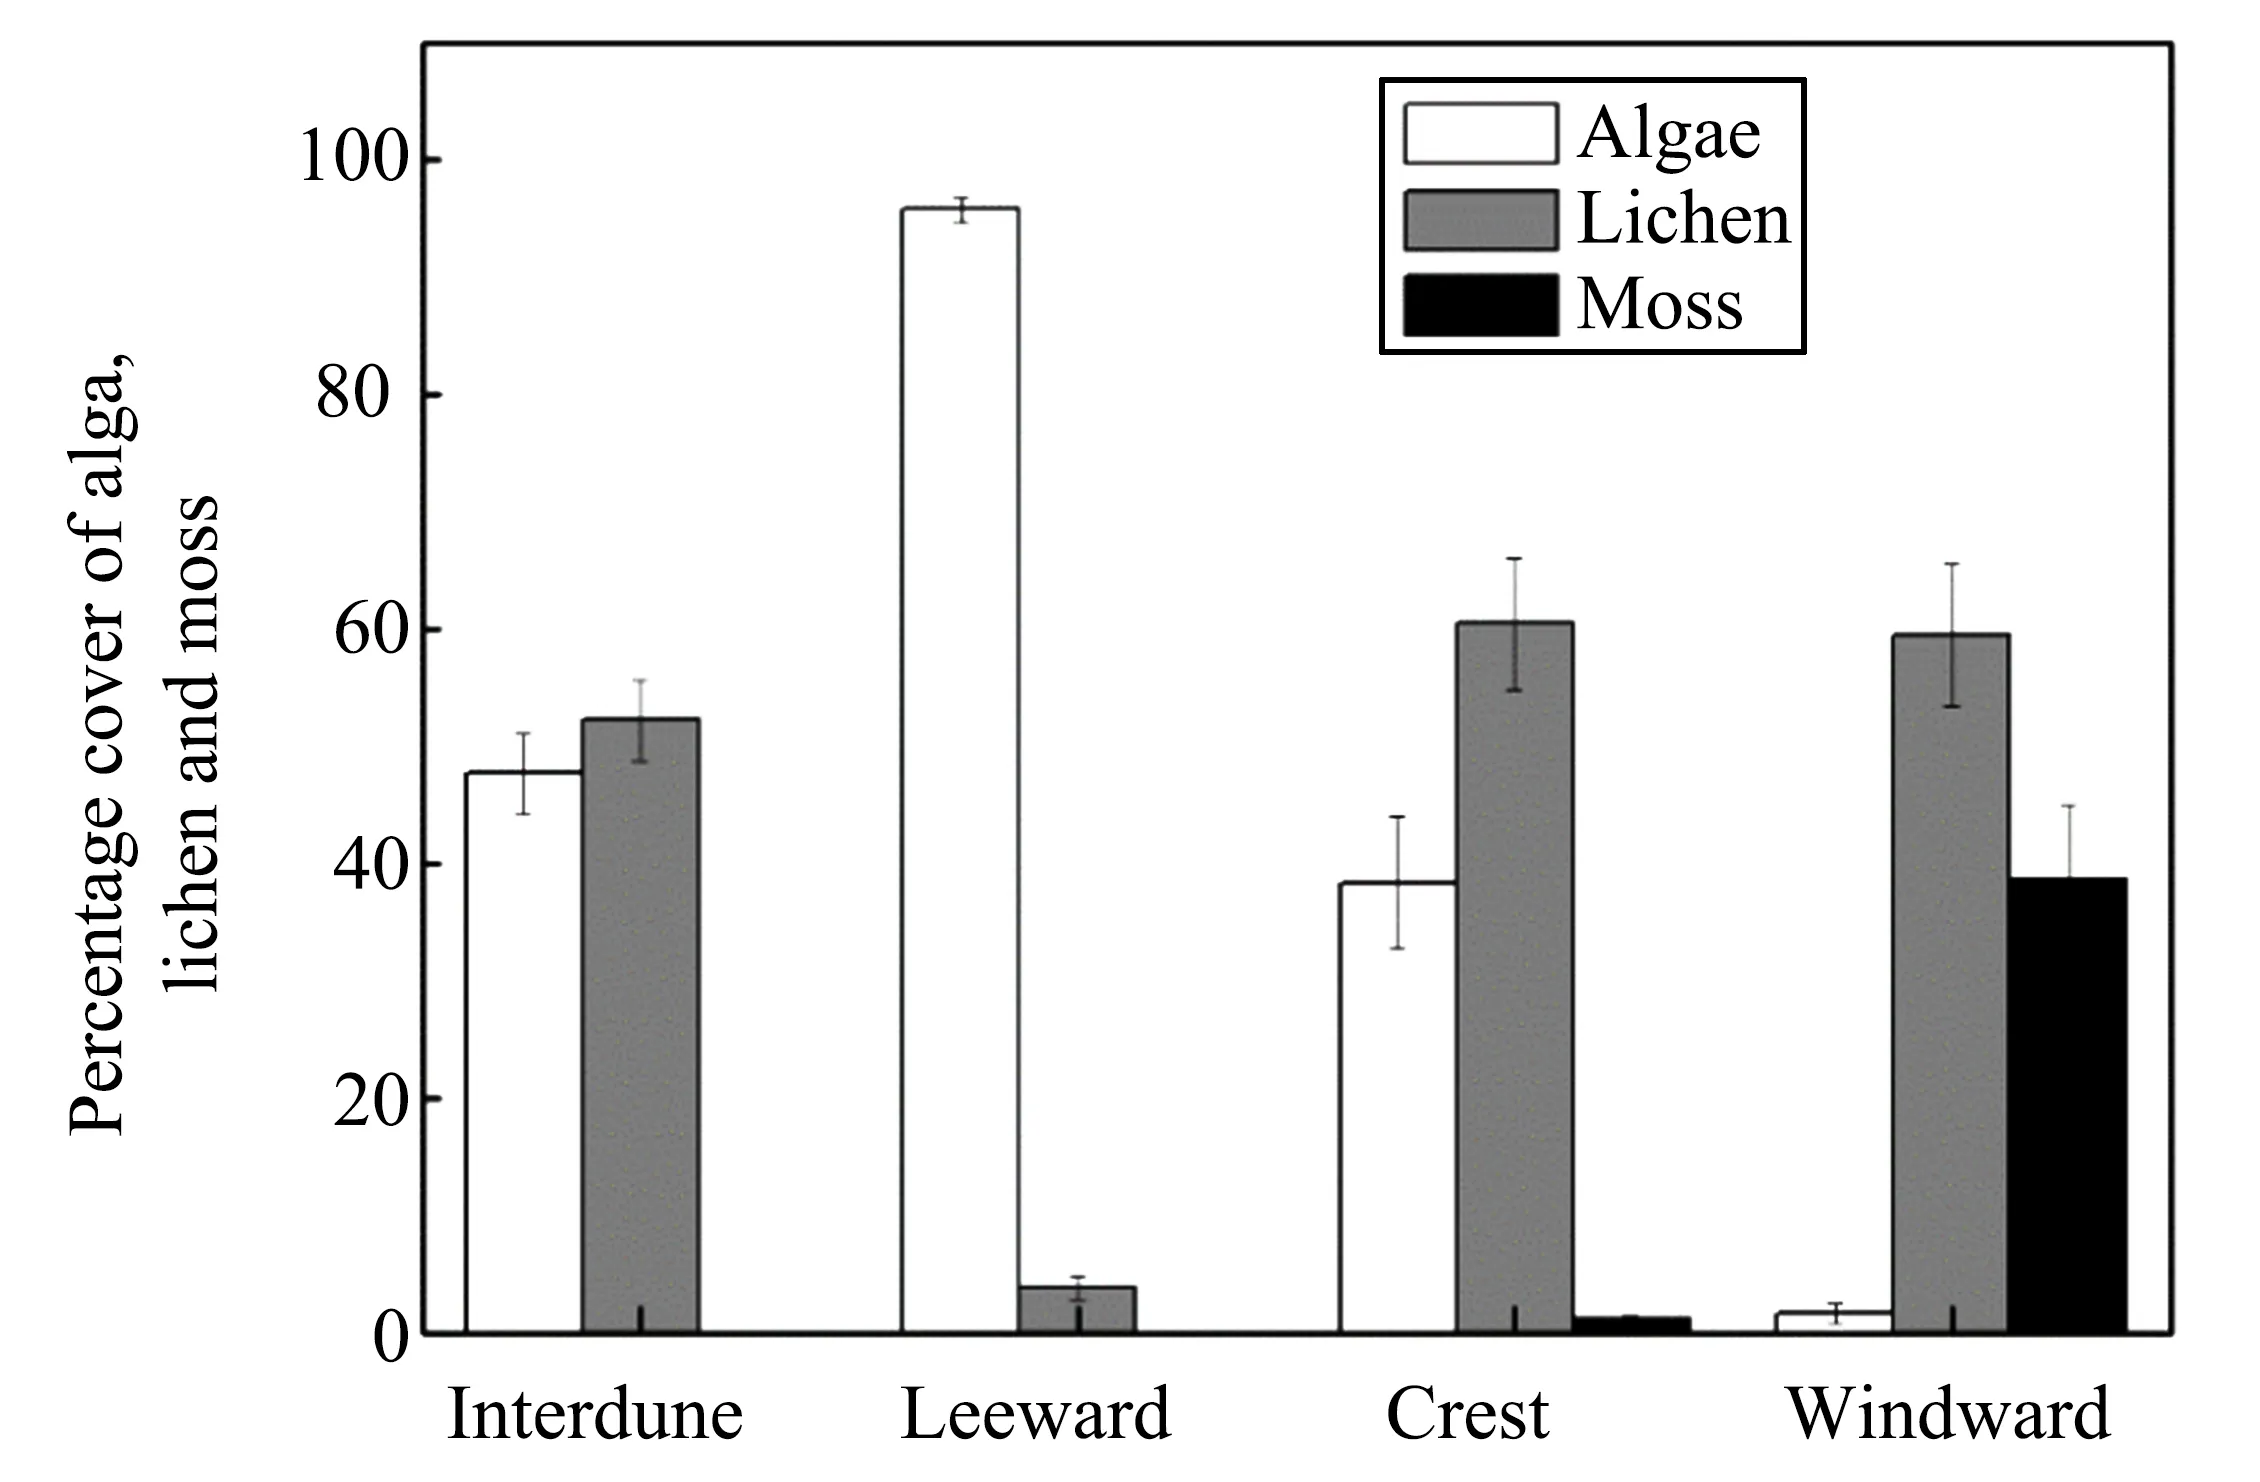
Figure 2 Percentage of algae,lichen,and moss on the interdune,leeward,crest,and windward parts of the stabilized dunes with BSCs.Error bars are the standard error of threereplicates
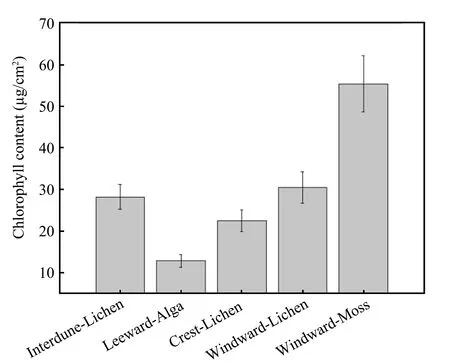
Figure 3 Chlorophyll content of algae,lichen,and moss on interdune,leeward,crest,and windward parts of the stabilized dunes with BSCs.Error bars are the standard error of three replicates
3.3 Responses of ecosystem C fluxes and cumu‐lated C balance to simulated rainfall
Month,HAF,SRA,and position on a dune significantly affected the measured NEE,ER,and GEP rates(Table 2).GEP and NEE were more negative(Figures 4a,4b);and ER was more positive,with increasing SRA(Figure 4c).The responses of average CO2fluxes to SRA on all parts of the dune could be divided into three levels.GEP and NEE were significantly lower,with 20 and 40 mm,followed by 5 and 10 mm,and then 0 and 1 mm;and ER showed an opposite trend.Within each of the three levels,GEP,NEE,and ER showed no significant difference.The absolute values of CO2fluxes were smaller on the leeward side than on the other three parts under all SRA.Photosyn-thesis and respiration of organisms in BSCs on different parts of a dune were all activated immediately after the rainfall simulation(Figure 5).GEP and NEE were the lowest at 0 HAF and gradually increased with HAF(Figure 5).GEP was almost 0 on the leeward side and remained stable at about-0.5 µmol/(m2⋅s)on the other three parts,while NEE was about 0 µmol/(m2⋅s)on all parts of a dune from 4 HAF(Figure 5).ER was highest immediately after rainfall simulation and gradually declined to about 0 µmol/(m2⋅s)at 10 HAF(Figure 5).
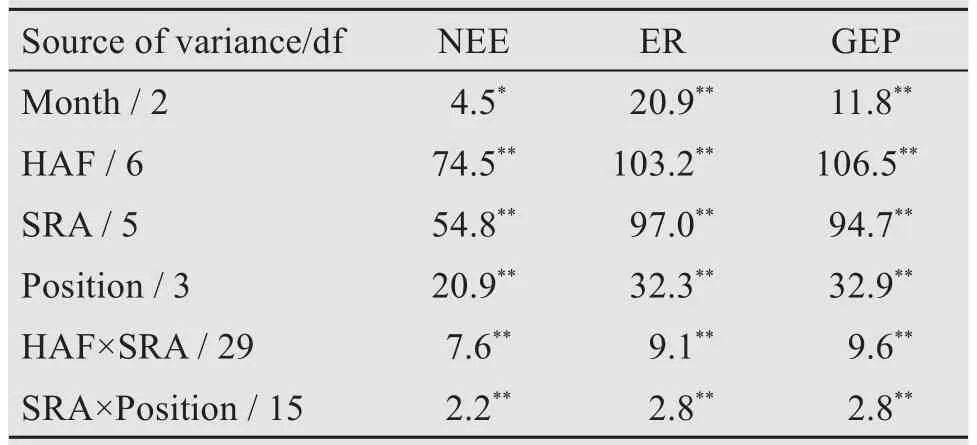
Table 2 Results(Fvalue)of four-way ANOVA analysis about the effect of month,hours after simulated rainfall(HAF),position of the dunes(Position),simulated rainfall amount(SRA),interaction of position and SRA,and interaction of HAF and SRA on ecosystem respiration(ER),net ecosystem exchange(NEE),and gross ecosystem production(GEP)
The interaction between HAF and SRA,and between SRA and position on a dune significantly affected all the C fluxes(Table 2).GEP had no significant difference among interdune,crest,and windward sites;but it was significantly higher than that on the leeward side,with 20,10,5,and 1 mm SRA(Figure 4a).The NEE and ER differences among different parts with changing SRA were similar to that of the GEP(Figures 4b,4c).GEP was higher on the windward side than on the crest and interdunes immediately after rainfall simulation;and it had no difference among the windward,crest,and interdune sites;but they were higher than that on the leeward side from 1 to 4 HAF(Figure 5a).The temporal differences of NEE and ER among the four parts of the dune were similar to that of the GEP(Figures 5b,5c).The results show that the maximum GEP,ER,and NEE of all BSCs on different parts of a dune with the same SRA in August were smaller than those in June and September.
3.4 Cumulated NEE after each rainfall simulation
After the rainfall addition,the BSC had a net C sequestration in June and September only when the SRA was higher than 5 mm,and in the August only when higher than 10 mm(Figure 6).The cumulated NEE under each rainfall simulation showed linearly cumulated NEE of the three months together.NEE reached a 0 balance when rainfall size(compensation point)was 3.80 mm,15.54 mm,8.62 mm,and 1.88 mm for BSCs on the interdune,leeward,crest,and windward parts,respectively(Figure 7).BSCs began to be a net C emission when SRA was lower than the compensation point.The compensation rainfall was marginally negatively correlated with chlorophyll content(R2=0.93,P=0.074,n=4;chlorophyll content,Figure 3).
The NEE showed polynomial relationships with the SRA when combining the data of the four parts(Figure 8).The whole dune started to show a net C gain when SRA was higher than 5 mm(Figure 8),and the C-sequestration capacity was enhanced with an increase in SRA up to 30 mm.
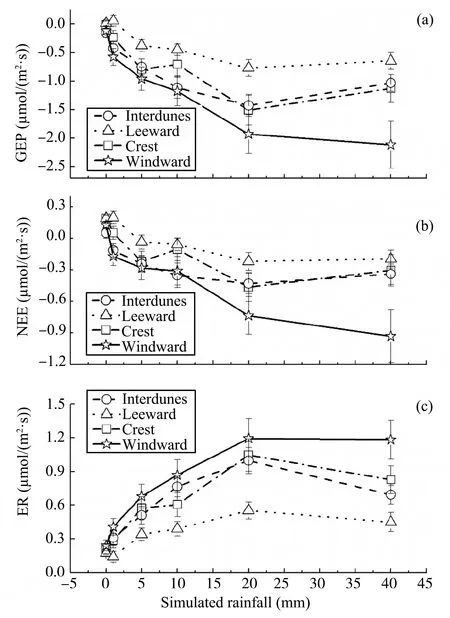
Figure 4 Average gross ecosystem production(GEP),net ecosystem exchange(NEE),and ecosystem respiration(ER)of organisms in biological soil crusts with different amounts of simulated rainfall on the interdune,leeward,crest,and windward parts of a sand dune.Values in each rainfall simulation are the average of 0,1,2,4,6,8,and 10 hours after rainfall simulation of the three replicates.Error bars are the standard error of three replicates
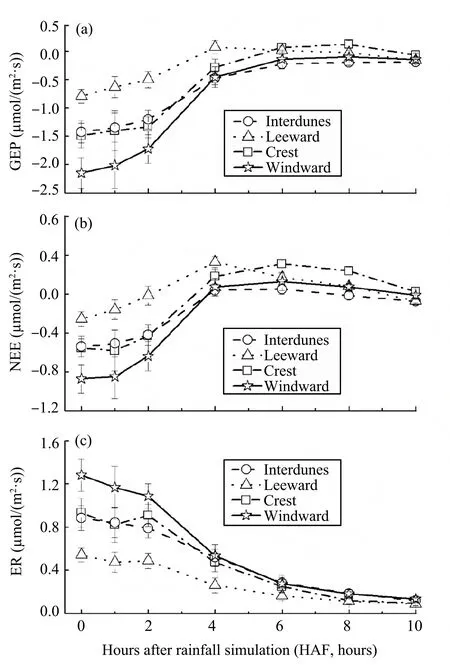
Figure 5 GEP,NEE,and ER of organisms in biological soil crust at 10 minutes;0,1,2,4,6,8,and 10 hours after rainfall simulation on the interdune,leeward,crest,and windward parts of a dune.Values for each time are the average of C fluxes with 0,1,5,10,20,and 40 mm of rainfall simulation in three replicates.Error bars are the standard error of the three replicates
4 Discussion
4.1 Microtopographic effectson the typesof BSCs
Our categorizing of algae-lichen crust on the interdunes and crest,and moss-lichen crust on the windward side is similar to the findings that most BSCs are mixed,with two or three combinations of cyanobacteria,green algae,lichen,and moss in deserts in northwestern China(Li et al.,2010).The distribution and development of BSCs on different parts of a dune are mainly due to the geomorphologic-variation-induced differences in airflow,dust deposition,and soil moisture(Li et al.,2010;Wu et al.,2013;Fischer and Veste,2018).The nutrition-enriched,high dust deposition onto the topsoil(Li et al.,2010)enhances the development of lichen and mosses on the windward side,and the proportion of lichen and moss increases with soil moisture in a BSC(Li et al.,2010).The mismatch between low soil moisture on the windward side relative to the leeward and higher lichen-moss percentage on windward BSCs(Figures 1,2)are probably due to vertical differentiation of soil moisture in response of different BSCs to rainfall pulse.In the surface layer(3 cm),soil moisture is generally higher in lichen and moss than in cyanobacterial BSCs following a rainfall,due to the intensified interception of rainfall by moss and lichen.The higher interception by moss and lichen(Chamizo et al.,2013)could lead to lower soil moisture at the 10-cm depth on the windward side.Therefore,the apparent mismatch between BSCs'distribution and soil moisture is probably due to the vertical difference of soil moisture at 0-10 cm in response to rainfall pulse.
4.2 Effect of rainfall size on the CO2fluxes and C balance of BSCs
Autotrophic organisms in BSCs have the potential to fix atmospheric C from photosynthesis,at rates ranging from 0.1 to 11.5 µmol/(m2⋅s)(Lange et al.,1998),thus making them the main pathway of C input to the soil and the major source for soil's C efflux in desert ecosystems(Büdel et al.,2018).The CO2fluxes in desert BSCs are ultimately water-limited.The ability of BSCs to uptake and release C is affected by magnitude and duration of each rainfall event(Huxman et al.,2004;Grote et al.,2010;Bowling et al.,2011;Reed et al.,2012;Su et al.,2012;Zhao et al.,2014).Most of the rainfall events in Minqin are in a pulse pattern and seldom last for several hours(Du et al.,2011).In Kalahari sand land,ER is higher for light wetting treatment(1.4 mm)in the morning but almost identical to that of dry soil in the late afternoon.Even with a 120-mm rainfall,the respiration rate of the wet soil is similar to dry soil after two days(Thomas and Hoon,2010).The larger the size of a rainfall event,the longer the duration of the soil-surface wetness(Belnap and Lange,2003;Bowling et al.,2011),thus resulting in a higher absolute value of average GEP,NEE,and ER rates(Figure 4)regardless of BSC type.Small rainfall events cause the BSC organisms to stay active for a short period.In contrast,large rainfall events could cause them to enter and remain in the photosynthetic phase for a longer time(Coe et al.,2012),thus causing the higher cumulated NEE with increasing rainfall(Figure 6).A significant difference of CO2fluxes was found in just three levels of rainfall,along with a nonsignificant difference within each level,similar to the findings that NEE and ER show no difference between 2 and 5 mm but are much lower as compared with 15-mm rainfall in the Gurbantunggute Desert(Su et al.,2013),which suggests the cascading response of CO2fluxes to changing rainfall size.But the underlying mechanism of the cascading pattern of the C-flux response to rainfall size is not clear and needs to be further studied in the future.
Lower microbial biomass(Yu et al.,2012)and measured chlorophyll content of algae as compared with moss and lichen could probably be the main reasons for the lower CO2-flux rates on the leeward side for all SRA,given that the inorganic nitrogen concentration for the four dune parts had no significant difference(Table 1,Figure 3),and soil moisture was even higher on the leeward side(Figure 1).After rewetting of dry BSCs,a common phenomenon is the initial CO2release due to a physical-process-driven CO2burst from the soil(Huxman et al.,2004)and then a probable C uptake,depending on the water availability and species composition of the BSCs(Lange,2001).The negative NEE immediately after water addition(Figure 5b)implies the higher ER(Figure 5c)in all the BSCs at this moment is due not only to the CO2burst from soil pores but also to respiratory C emission of BSC organisms because both photosynthesis and respiration of BSCs can be activated in minutes(Lange et al.,1993;Lange,2001).The rapid activation of photosynthesis and respiration is similar to the findings of others in a variety of ecosystems.In our study,however,the rate of CO2fluxes quickly returned to near-background levels about 10 HAF even in the 40-mm rewetting treatment(Figure 5).In the Sonoran Desert,CO2efflux returns to background levels within 5 hours of wetting with a 2-mm rainfallequivalent water addition(Sponseller,2007);and in the Kalahari Desert,CO2efflux declines to a low value 7 hours after a torrent(120 mm rainfall;Thomas and Hoon,2010).Thus,10 HAF could be long enough to capture the short-term response of CO2fluxes to rainfall simulation at the study site.The negative GEP at 10 minutes after rainfall(Figure 5a)consolidates the quick activation of photosynthesis of BSC organisms after rainfall.Reduction of NEE 4 HAF(Figure 5b)even with 40-mm rainfall supports the intermittent C uptake of the biological crust,given the larger rainfall events in Northwest China(Su et al.,2013).Although only the average soil moisture at 0-10 cm was measured,BSCs surface is visibly dry 4 HAF due to intensified evapotranspiration,which could probably cause the decline of NEE and GEP 4 HAF.Although the decline in ER 4 HAF(Figure 5c)could mainly stem from the substrate limitation,as soil moisture in the deep layer is still higher than in the dry treatment(Figure 1),substrate limitation following rewetting constrains the duration of microbial respiration,hence the total CO2efflux(Sponseller,2007).The nonsignificant difference of ER among all parts of the dune from 6 HAF(Figure 5c)further indicates the substrate limitation on CO2efflux.Moreover,the slightly lower CO2efflux at 40 mm than at 20 mm also suggests the substrate limitation.In the beginning of each simulation,the quick activation of photosynthesis could supply fresh C to the soil and ease the substrate limitation,thus explaining the increase of ER in each rewetting(Figure 4).The rainfall storm can inhibit both respiration and photosynthesis,due to blockage of CO2-diffusion pathways in soil pores or in thalli(Lange et al.,1998;Lange 2001).At our study site,the coarse texture of the soil(Table 1)allows the quick water percolation to deep layers and excludes the possibility of supersaturation.
The compensation-rainfall point for the BSCs on interdunes(3.8 mm)and the windward side(1.88 mm)is comparable to a mixed crust(2.6 mm)of cyanobacteria,lichen,and mosses in a 1:1:1 proportion on the Colorado Plateau(Wilske et al.,2008).The difference in compensation point among the four parts of the dune(Figure 6)follows the same pattern among different successional stages of BSCs,in which compensation rainfall is higher for cyanobacteria than for mosses(Bowling et al.,2011;Li et al.,2012).Cyanobionts generally need considerably more water for the onset of net photosynthesis than do phycobionts(Lange et al.,1993).In the Namib Desert,positive net photosynthesis is achieved only when the compensation point is 0.13 or 0.26 mm(Lange et al.,1998).The low moisture requirement for lichen in the Namib Desert is probably due to their surprisingly high chlorophyll content,which is similar to the chlorophyll content of typical higher-plant leaves(Lange et al.,1998).The different compensation-rainfall size in the BSCs of the four dune parts,therefore,can be attributed to the effect of chlorophyll content,as they negatively correlated(Figure 3).Another possible explanation for the difference in compensation point of BSCs in different parts of a dune is the"inverse texture hypothesis"(Noy-Meir,1973),in which coarse-textured soils have higher net photosynthesis than fine-textured soils in very arid zones,due to reduced evaporative losses(Austin et al.,2004).
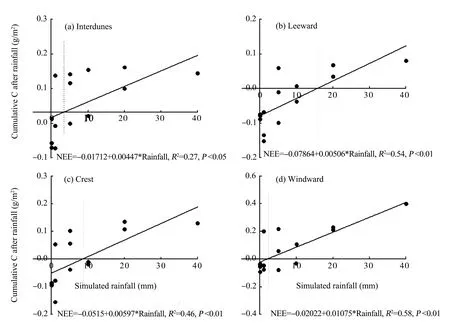
Figure 7 Linear fitting between the cumulated NEE and SRA on the interdune,leeward,crest,and windward parts of fixed sand dunes.Negative values represent net C loss,and positive represent net C gain
Responses of C balance in BSCs to rainfall size are modulated by season(Coe et al.,2012).Occasional heavy summer rainstorms accompanied by cooler temperatures would probably allow the crusts to experience a net C gain yet a small amount of C loss near the end of the drying processes(Jeffries et al.,1993).Larger rainfall size for the net cumulated C gain in BSCs in our study is consistent with former studies.Such a re-sult may be due to the high temperatures'and evaporation rates'elevating the effective size of rainfall events in summer,while climate conditions of increased humidity and reduced evaporation in June and September likely let water from precipitation remain available in the environment longer(Coe et al.,2012).

Figure 8 Polynomial fitting between cumulated NEE and SRA,combining the interdune,leeward,crest,and windward parts of a dune.Negative values represent net C loss,and positive represent net C gain
The alteration of the regional rainfall regime under global climate change will induce changes in the C balance in desert ecosystems(Belnap and Lange,2003;Li et al.,2012).Crust pigments likely dry more quickly with frequent,small precipitation events than with large,infrequent events.The frequent and small rainfall events reduce the activity time of BSCs(Belnap et al.,2004).In arid regions,the majority of precipitation events occur as small(<5 mm),short-duration events.As observed in other water-limited ecosystems,most of the rainfall pulse recorded in Minqin is small-or medium-sized precipitation events.With respect to different compensation rainfalls(Figure 7)and the increasing trend of rainy days of 0-5 and 5-10 mm(Du et al.,2011),BSCs on the leeward side and the interdunes would be favored in terms of C gain.
5 Conclusion
Both photosynthesis and respiration were rapidly activated after rainfall,even with a 1-mm rainfall.The CO2burst after rainfall stems from the physicaldriven process and metabolism of organisms in BSCs.C-flux responses to rainfall size show a cascading pattern.The responses can be sorted into three levels(0 and 1,5 and 10,20 and 40 mm),but they had no significance within each level.All the BSCs on different parts of a dune show a net C gain at 4 HAF.The short duration of C fluxes results from surface-soil dry-up and substrate limitation,as deep-layer soil moisture is still relatively high.The rapid activation of photosynthesis provides a C source,and therefore could be responsible for the increase of C efflux after each rewetting.The compensation point for BSCs to get a net C gain on the windward side is 1.88 mm,followed by BSCs on the interdunes(3.8 mm)and crest(8.62 mm),with the highest on the leeward side(15.54 mm).The compensation-rainfall size is negatively correlated with chlorophyll content.When combining all the BSCs on a dune,net C balance demonstrates a polynomial relationship with rainfall size,with the optimum rainfall about 30 mm.The BSCs on the dunes in the transitional zone between desert and oasis could be favored,in terms of C sequestration and dune stability,with the increasing frequency of 5-10 mm rainfall events.
Acknowledgments:
This work was supported by funds from the National Key R&D Program of China(2016YFC0500909),the TU-ITP and the MRA programs from Tottori University,and SAKURA Exchange Program in Science from the Japan Science and Technology Agency.
 Sciences in Cold and Arid Regions2019年1期
- Sciences in Cold and Arid Regions的其它文章
- How changes of groundwater level affect the desert riparian forest ecosystem in the Ejina Oasis,Northwest China
- Accumulation and geochemical evidence for the Little Ice Age episode in eastern Antarctica
- Primary investigation of statistical correlation between changes in ice volume and area of glaciers
- Vulnerability and adaptation of an oasis social–ecological system affected by glacier change in an arid region of northwestern China
- The analysis of heat and water fluxes in frozen silty soil
- The changing process and trend of ground temperature around tower foundations of Qinghai-Tibet Power Transmission line