
The analysis of heat and water fluxes in frozen silty soil
2019-03-14 01:49:54DaHuRuiMingLuKunioWatanabeJunZhang
DaHu Rui,Ming Lu,Kunio Watanabe,Jun Zhang
1.School of Civil Engineering,Henan Polytechnic University,Jiaozuo,Henan 454000,China
2.State Key Laboratory of Frozen Soil Engineering,Cold and Arid Regions Environmental and Engineering Research Institute,Chinese Academy of Sciences,Lanzhou,Gansu 730000,China
3.Graduate School of Bioresources,Mie University.Mie 514-8507,Japan
4.University of Chinese Academy of Sciences,Beijing 100049,China
ABSTRACT In this paper,based on the basic equations of water flow and heat transfer,the hydrothermal coupling model is established.The numerical model was realized in COMSOL Multiphysics software,and simulation results are compared with the experimental results of Watanabe and Wake(2008)to verify the effectiveness of the model.Through the calculation,we can obtain the dynamic changes of heat and water fluxes,thermal and hydrological properties,matric potential and temperature gradient in unsaturated freezing soil;and these variables are unmeasurable in practice.
Keywords:unsaturated freezing soil;hydrothermal coupling;heat and water fluxes;COMSOL
1 Introduction
Soil freezing is an intricate,multiphasic coupling process.In the soil-freezing process,part of the water generates phase changes in the soil;and the soil is divided into frozen and unfrozen zones.The resulting temperature gradient and matric potential are significantly different for frozen and unfrozen zones.During the soil-freezing process,the change in heat and water fluxes can reflect temperature and water-content redistribution.Therefore,the forecast of water and temperature redistribution of frozen soil has great significance in the engineering field.
In the 1970s,Harlan(1973)presented a model for coupled heat transport and water flow in partially frozen soils.This model was widely used to solve the problem of heat transport and water flow in the freezing process.Later scholars established a better hydrothermal coupling model(Hansson et al.,2004;Liu and Yu,2011;Tan et al.,2011).The driving force of water flow is one of the core problems in numerical simulation.Williams(1964)used the same soil under freezing and drying conditions to measure the soilfreezing characteristic curve(SFCC)and the soil-water characteristic curve(SWCC).There is a unique relationship in the negative temperature conditions for the suction of a given amount of unfrozen water,corresponding to a similar water content at room temperature(Koopmans and Miller,1966;Spaans and Baker,1996).It is important to know the unfrozen-water content and hydraulic conductivity of frozen soils when assessing water,heat,and solute transport in freezing and thawing soils(Watanabe and Osada,2017).Watanabe and Osada(2016)conjectured the hydraulic conductivity of frozen soil should be estimated from that of unfrozen soil,based on the liquid-(unfrozen)water content instead of the temperature.Harlan(1973)first proposed the role of ice as a blocking effect for liquidwater flow.To account for this blocking,the hydraulic conductivity is often reduced by means of an imped-ance factor,Ω(Lundin,1990),which may underestimate the hydraulic conductivity as the ice-water content increases.However,Watanabe and Flury(2008)proposed that the impedance factor is unnecessary if the SWCC is accurate enough.Thermal conductivity of frozen soil is complicated,and ice content has a great influence on it(Karra et al.,2014).Many scholars have proposed different equations to achieve numerical simulation(Hansson et al.,2004;Tan et al.,2011),which improved the accuracy of calculations.
The water-heat coupling process of frozen soil is complicated.The freezing process indicates that many variables change.Heat and water fluxes are the two main variables during the freezing process.However,they change under microconditions;and it is hard to realise synchronous measurement due to a lack of technology.Obtaining the dynamic process of heat and water fluxes could provide us a clear and transparent process of hydraulic and thermal fields.It is impossible to obtain the long-term process of the thermal conductivity and heat capacity of the freezing soil,due to its complicated physical characteristics.Investigating the details of the water-heat coupling of freezing soil is an important endeavor with practical applications.In this paper,we obtain through calculation the heat and water fluxes,which are unmeasurable in practice,and show the advantage of numerical calculation.
2 Hydraulic field
2.1 Mass-conservation equation
For a variably unsaturated porous medium,fluid movement is complicated;and for research convenience,we chose a unit body of volumeVas a representation in a porous medium.Then,the change of fluid in the unit bodyVin a unit of time is as follows:
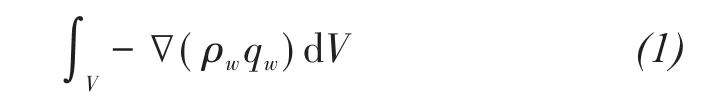
whereρwis the density of liquid water(kg/m3)andqwis the liquid-water flux(m/s).In addition,the unit quantities of liquid water and ice in the unit body are ρwθwand ρiθi,where ρiis the density of ice(kg/m3);and θwand θiare volumetric liquid-and ice-water content(cm3/cm3),respectively;t is time(s).Ignoring frost heave,the mass increment per unit volume of water in a unit time is
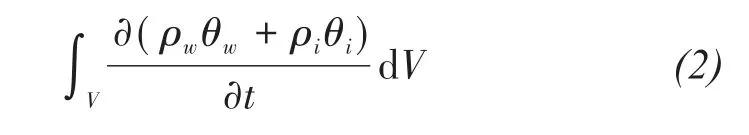
According to the law of conservation of mass,
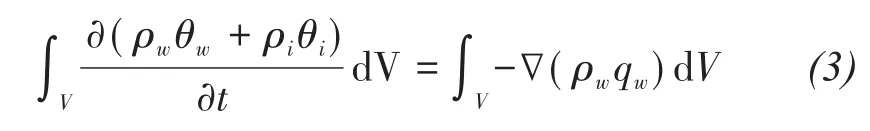
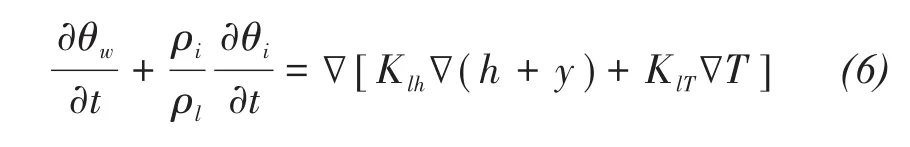
Integrating Equation(3),the partial differential equation for liquid-water flow is as follows:
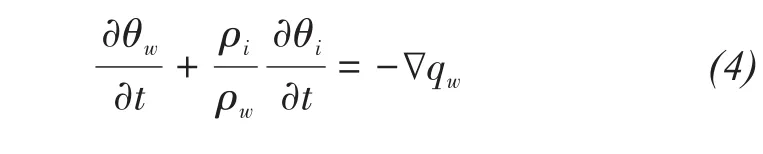
In the Harlan model(Harlan,1973),liquid-water flow in unfrozen,unsaturated soil is similar to that in partially frozen soils.The water flow is described by the modified Richards equation;therefore,the governing equation for liquid-water flow is as follows:
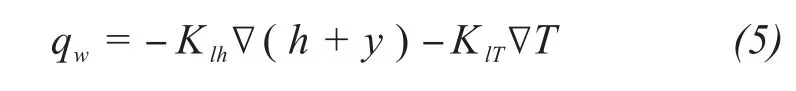
whereKlh(m/s)andKlT(m2/(K·s))are hydraulic conductivities of the liquid-water flow due to a pressurehead gradient and a temperature gradient,respectively;y is the vertical coordinate positive upward(m);h is the pressure head(m);and T is soil temperature(K).
Inserting Equation(4)into Equation(5)produces the water-flow equation as follows(Fayer,2000):
2.2 Hydraulic properties
Based on the analogy of drying and freezing processes,the soil-water characteristic curve(SWCC)can be extended to describe the relationship between the unfrozen-water content and the matric potential(Koopmans and Miller,1966).The matric potential should be a function of liquid water,and the Van Genuchten equation(Van Genuchten,1980)is used to predict the unsaturated freezing-soil matric potential:

whereSeis the effective saturation;θsis saturated water content and the porosity of soil(cm3/cm3);θris residual water content(cm3/cm3);h is the pressure head(m);and m,n,andαare empirical parameters.
The hydraulic conductivity of variably saturated soil varies with liquid-water content and matric potential.The Van Genuchten-Mualem model(Van Genuchten,1980)is used to predict hydraulic conductivity based on the soil-water characteristic curve(SWCC),the relationship between the liquid-water content and the matric potential.
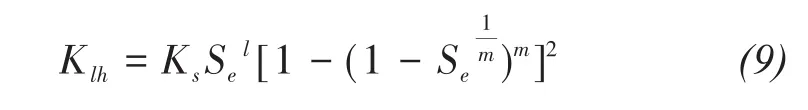
whereKsis the saturated hydraulic conductivity(m/s),and l is the pore-connectivity parameter.
The hydraulic conductivity of flow due to the temperature gradient is defined as follows(Saito et al.,2006):
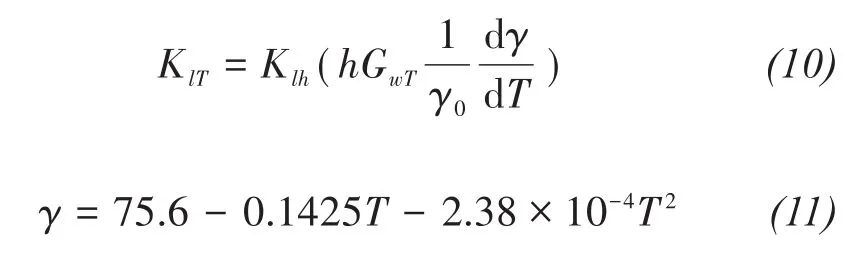
where T is temperature(K),GwTis a gain factor,γis soil-water surface tension,andγ0is the surface tension at 25°C.
Soil-freezing models sometimes use an impedance factor to reduce hydraulic conductivity(e.g.,Hansson et al.,2004).However,recent research proposed that the impedance factor is unnecessary as long as the SWCC is precisely determined(Newman and Wilson,1997;Watanabe and Flury,2008).Therefore,in this paper,the impedance factor is not discussed.
The unfrozen-water content was calculated by the empirical formula(Xu et al.,2001):

whereWuis mass water content(%),T is temperature(°C),a and b are empirical parameters.
3 Thermal field
3.1 Energy-conservation equation
For research convenience,we chose a unit body of volumeVas a representation in porous medium.The heating up in a unit time with the unit bodyVis as follows:

where the first term is conduction,the second term is convection,λis thermal conductivity(W/(m⋅K)),Cwis the heat capacity of liquid water(J/(m3·K)),T is temperature(K),and t is time(s).
With the development of freezing in soil pores,icewater phase change and latent-heat release cause temperature change in the unit body as follows:
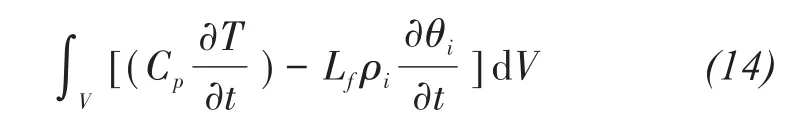
where CPis the volumetric heat capacity of bulk soil(J/(m3·K)),andLfis latent heat(J/kg).According to the law of conservation of energy,we can obtain
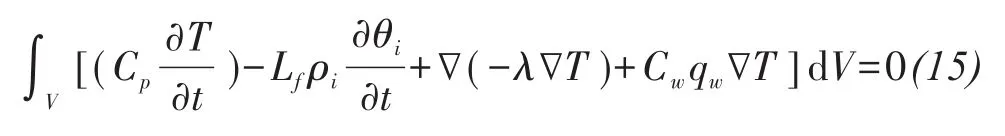
The unit bodyVis chosen at random,therefore the energy-balance equation can be written as follows(Nassar and Horton,1989):
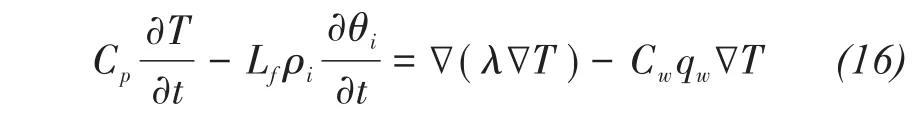
The left-hand side of Equation(16)can be rewritten as follow:

where Cais the apparent volumetric heat capacity(J/(m3·K)).
3.2 Thermal properties
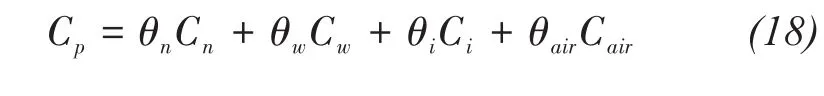
The volumetric heat capacity of the soil,Cp,is defined as the sum of the volumetric heat capacities of the soil particles Cn,liquid water Cw,ice Ci,and air Cair(J/(m3·K)),multiplied by their volumetric fractions(Campbell,1985;Williams et al.,1989):
The thermal conductivity of frozen soil depends on the thermal conductivity of its components(ice,unfrozen water or liquid water,and soil matrix).In this paper,the thermal conductivity is defined as follows(Tan XJ et al.,2011):

where λi,λn,and λware the thermal conductivity(W/(m⋅K))of ice,soil particles,and water,respectively.
4 Basic assumptions
(1)The density of liquid water is constant as temperature changes.
(2)The soil is homogeneous and isotropicly porous.
(3)The pore ice does not move and cause any frost heave.
(4)The unfrozen-water content and temperature have a functional relationship under thermal equilibrium conditions.
5 Model validation
Figure 1 shows the temperature profiles observed in the laboratory experiment(a)and calculated by the numerical simulation(b).In the laboratory experiment,the 0°C isotherm moves downward gradually at the speed of 1.52 cm/h,0.43 cm/h,and 0.18 cm/h,corresponding to 0-6 h,6-28 h,and 28-50 h,respectively.It is not difficult to see that the numerical simulation result is highly congruent with the profiles measured in the laboratory.The 0°C isotherm indicates the position of the freezing front.With the develop-ment of freezing,the soil column is divided into two parts:the frozen zone and the unfrozen zone.It is worthwhile to point out that there is an obvious difference of temperature gradient between the frozen zone and the unfrozen zone.The reason for this difference is the different thermal conductivity and volumetric heat capacity between the frozen zone and the unfrozen zone.
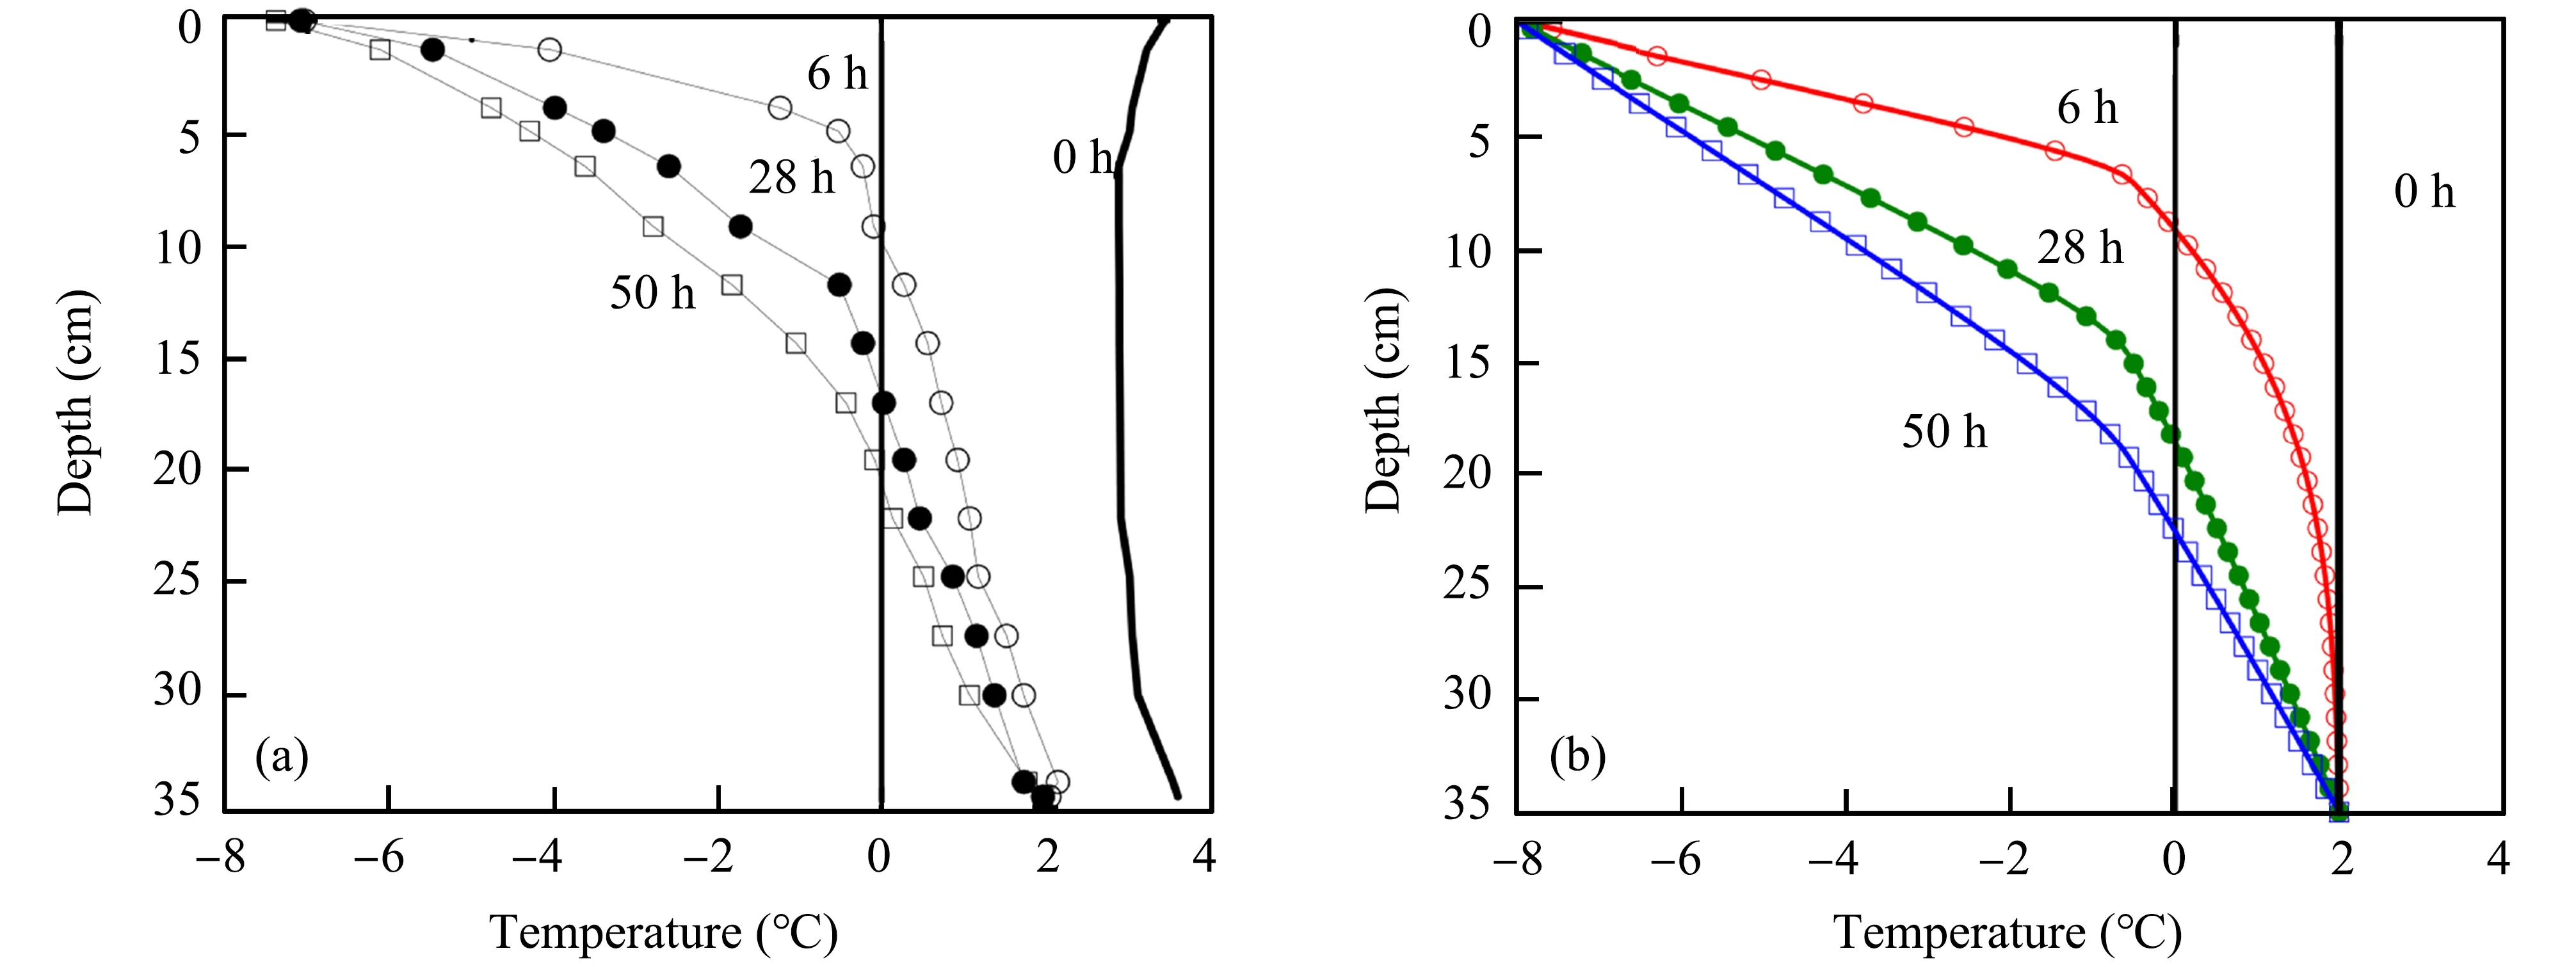
Figure 1 Plots(a)and(b)indicate the experimental results(Watanabe and Wake,2008)and simulation results of the distribution of the temperature profile,respectively
Figure 2 shows profiles of liquid-(unfrozen)and total-(liquid water plus ice)water content observed in the laboratory experiment(a)and calculated by the simulation(b).The results of the hydraulic field are generally consistent.The freezing process can be divided into two phases:a rapid-freezing phase and a stabilisation phase.In the rapid-freezing phase,the temperature of the soil decreases sharply;and the freezing front moves rapidly.In the stabilisation phase,the temperature declines slowly;the freezing front moves slowly;and the water curve tends to be steady.In the freezing process,the negative temperature changes the hydraulic and thermal properties of the soil,resulting in the change of the matric potential,and produces a steep pressure-head gradient near the frozen front,which drives the liquid water to migrate towards the freezing front.Meanwhile,the driving effect of the temperature gradient on the liquidwater flow cannot be ignored.Under the influence of the pressure-head gradient and the temperature gradient,the liquid water flows to the cold end and finally reaches a steady state.
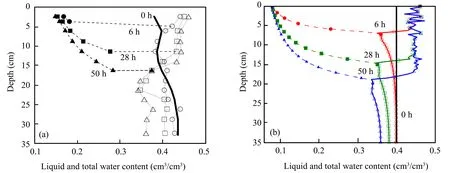
Figure 2 Plots(a)and(b)indicate the experimental results and simulation results of the distribution of the liquid-water content and total-water content in the unidirectional freezing experiment,respectively
The comparisons seen in Figure 1 and Figure 2 illustrate that the proposed model can describe the unsaturated frozen soil's water and temperature fields under freezing conditions.
6 Thermal field analysis
Figure 3 shows the profiles of the temperature gradient at different times,as in Figure 3.As the 6-h curve shows in Figure 3,because of the contrast between the cold-end temperature and the initial temperature,the temperature gradient is steeper at the initial stage of the freezing process upon the soil column.The decrease of the temperature gradient is steeper in 6-28 h than in 28-50 h,and steeper in the frozen zone than in the unfrozen zone.It is worthwhile to point out that the difference of temperature gradient between the frozen zone and the unfrozen zone decreases gradually.In addition,the temperature gradient drops rapidly at the position of the freezing front(above the inflection point is the frozen zone;below the inflection point is the unfrozen zone),this is because the formation of ice releases latent heat in soil pores,which decelerates the freezing process near the freezing front.
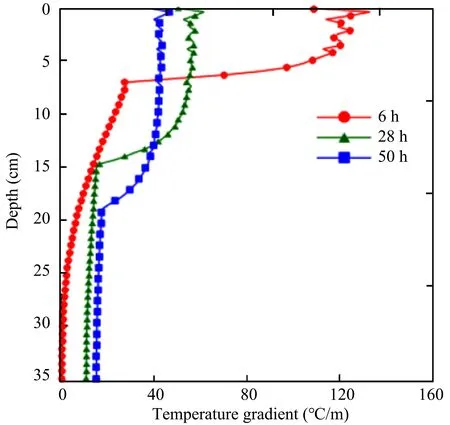
Figure 3 Profile of the temperature gradient at different times
Figure 4 shows the change in temperature at different depths.As shown in Figure 4,the changes at 3 cm and at 34 cm tend to stabilise quickly because they are both close to the ends of the column,where constant temperature-boundary conditions are maintained.At the beginning of freezing,the temperature at the 3-cm point decreased rapidly to-6°C;and afterwards,the velocity of the temperature drop tended to slow down.The velocities of temperature drop obviously differed;this distinction also shows the difference of the heatconduction process between the frozen soil and common solid materials,this is because the heat-conduction process of the frozen soil is influenced by many factors.The water in the soil pores turns into ice,which results in the increase of thermal conduction and the loss of heat flux due to the latent heat,this also shows that the frozen soil has different thermal properties as compared with common solid materials.
Figures 5a and 5b show the distribution of the ice content and thermal conductivity respectively.In the early period of the freezing process,the ice content increased rapidly;and the process is determined by both the temperature and the water flow.As shown in Figure 5,the geometric shape of the distribution curve of the ice content is similar to that of the curve of the thermal conductivity.If the ice content increases,the thermal conductivity also increases.In the unfrozen zone,the ice content is zero;therefore,the thermal conductivity substantially remains a constant value.It can be seen that the ice content has an important effect on thermal conductivity.
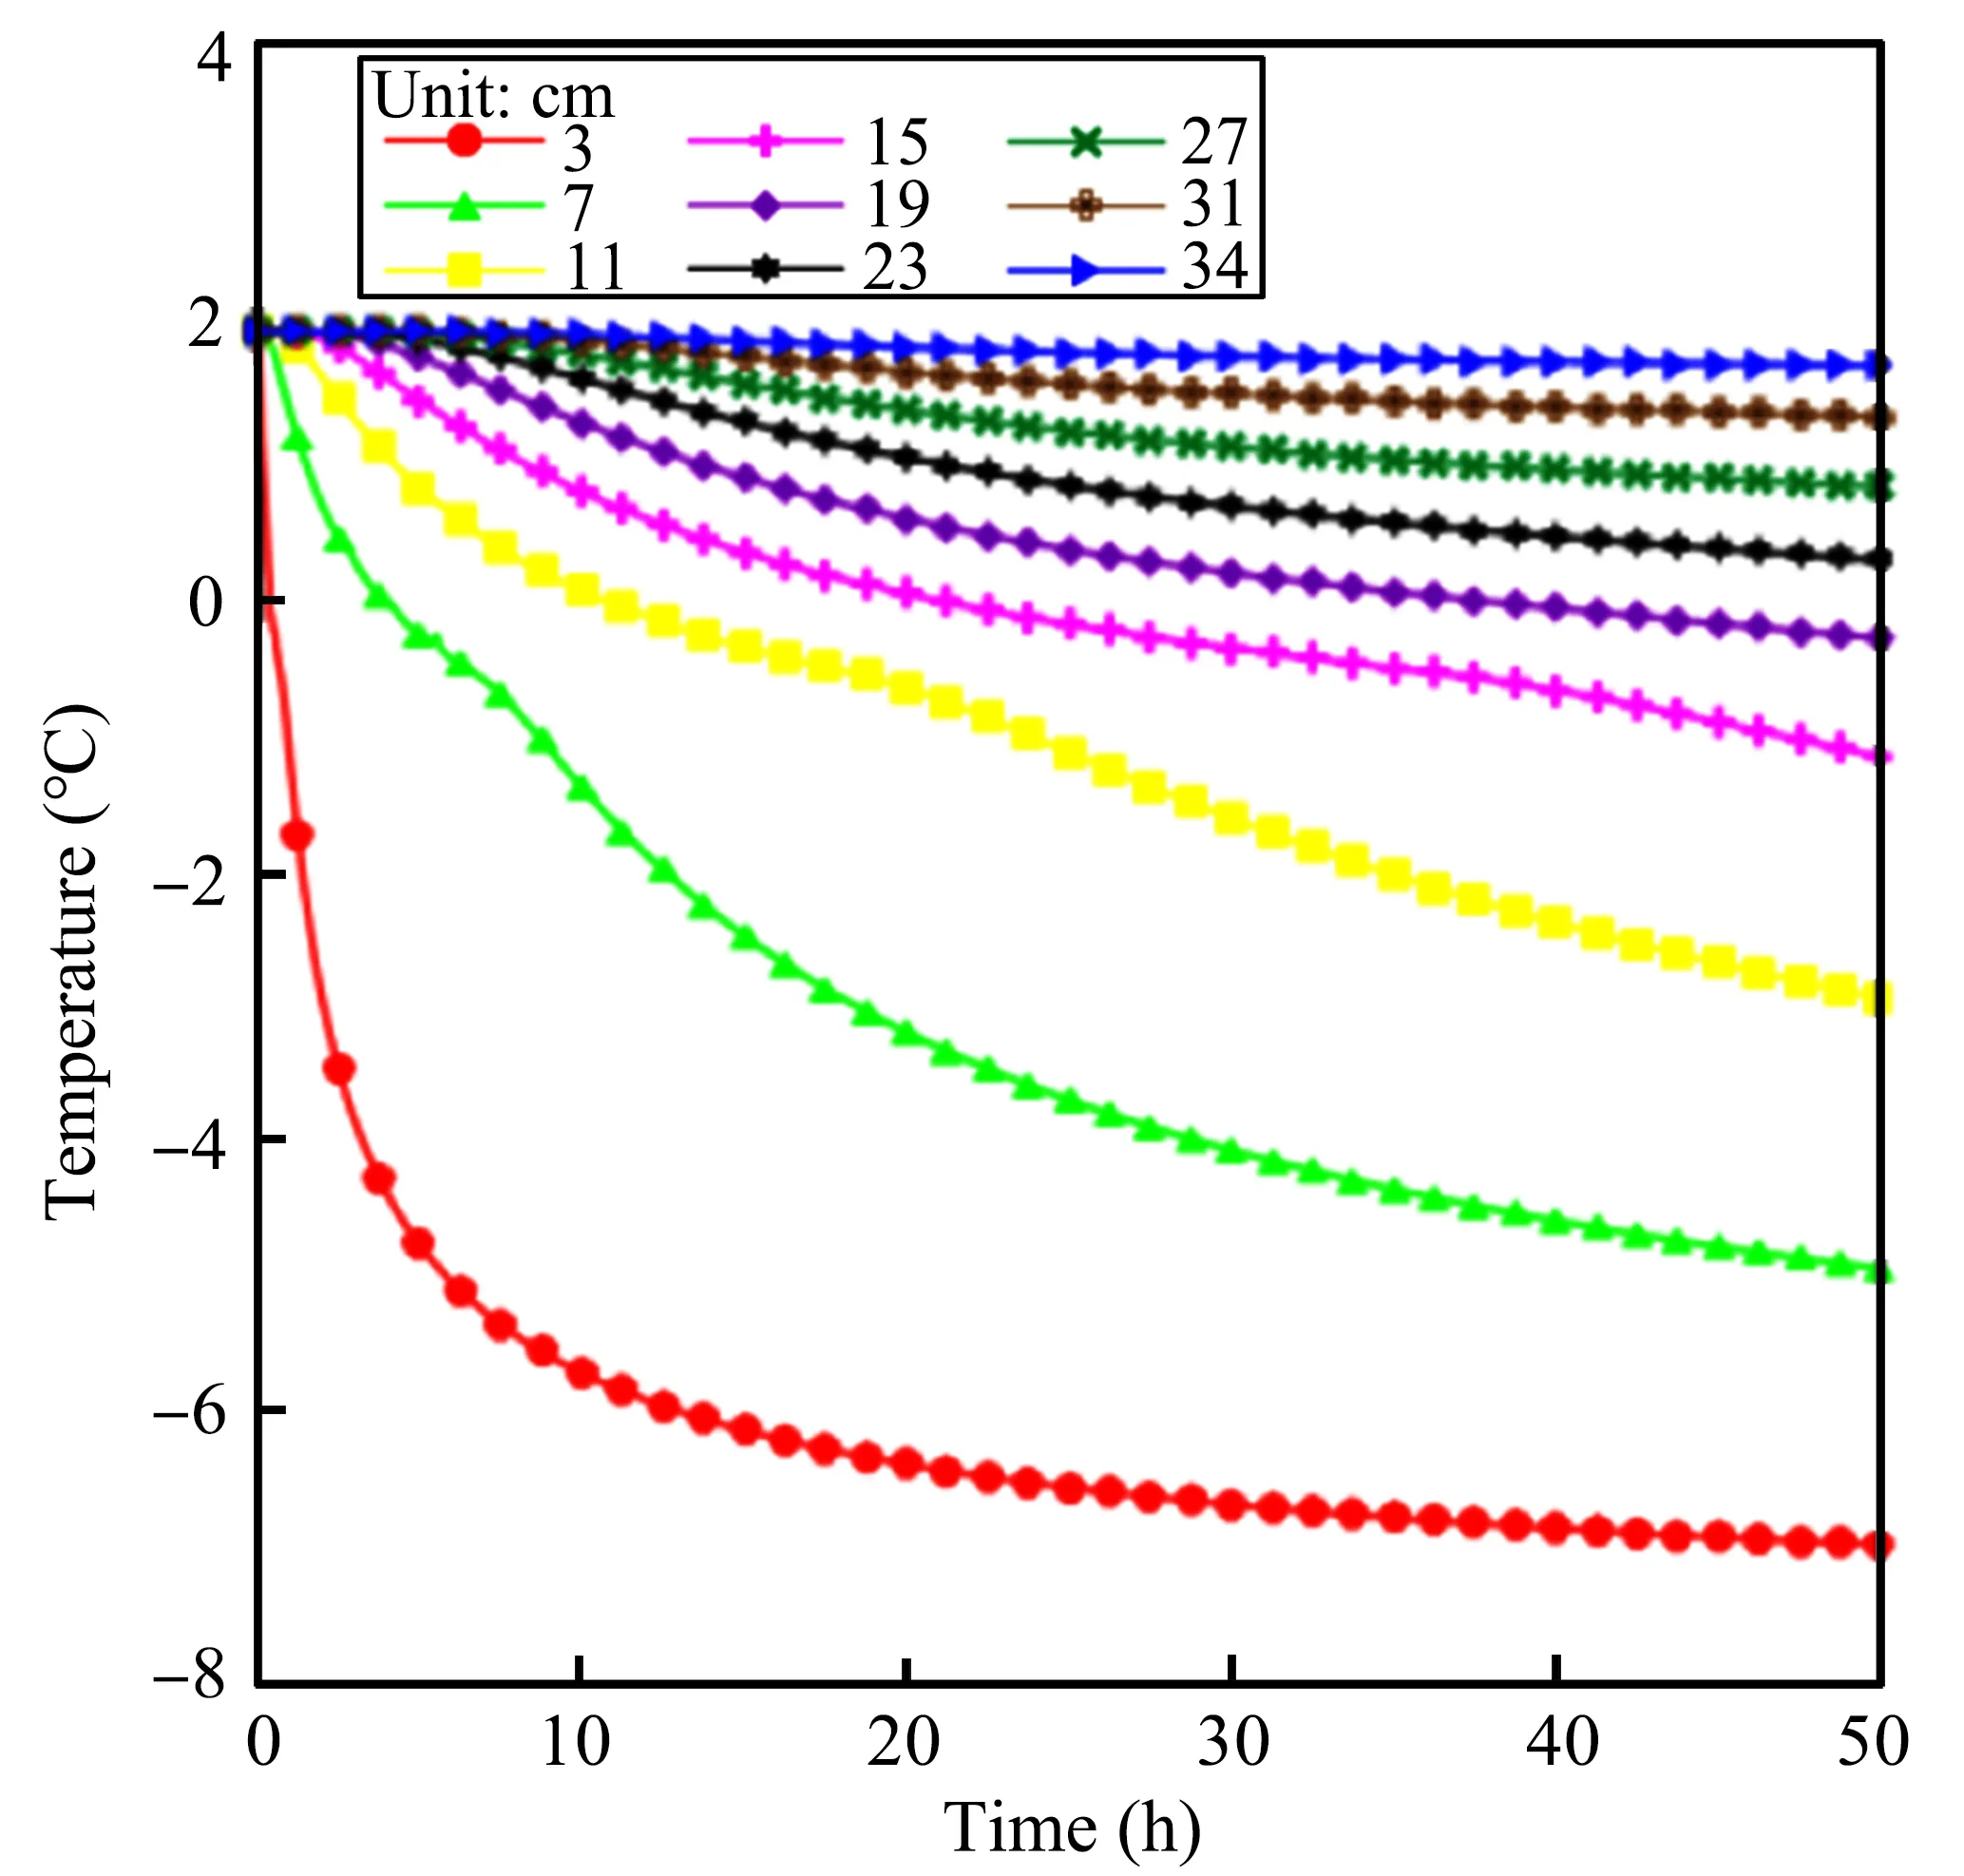
Figure 4 Curves of temperature vs.time at different depths
Figure 6 is the variation of the apparent volumetric heat capacity with time at depths of 5,10,15,and 20 cm.Before the freezing,the apparent heat capacity reduces slightly because the liquid-water content decreases due to upward soil-water migration.After freezing begins,the liquid water turns into ice,releasing a considerable amount of latent heat,which results in an obvious increase in the volumetric apparent heat capacity.As the soil freezes,the latent heat decreases,so that the apparent volumetric heat capacity starts to reduce slowly.After reaching thermal equilibrium,due to the ice-content increase,the apparent heat capacity become greater than in the initial state.
Figure 7 shows heat flux at different times.The heat-transfer process includes conduction and convection.Latent-heat release also plays a role in the process of temperature change.However,the water vapour is not taken into consideration,as we take water content as 0.4 cm3/cm3in the study.In the frozen zone,temperature and phase change little;the temperature gradient keeps a nearly constant value;and heat transfer is mainly based on conduction.In the unfrozen zone,both the temperature gradient and thermal conductivity become lower than those of the frozen zone,while there is non-negligible water flow,so that convection becomes greater than conduction.The freezing front is always the most active position of water flux,where water flux and convection flux reach their peaks at the same time.Convection drastically changes with water content and freezing rate,which changes the water flux.
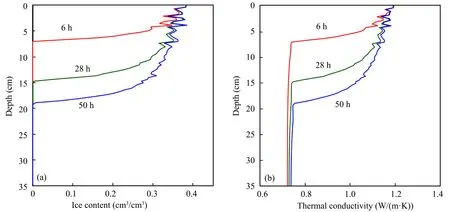
Figure 5 Distribution of ice content and thermal conductivity during soil freezing
7 Hydraulic field analysis
Figure 8 shows the matric potential head at different times.The matric potential head values at the cold end reach peaks,then rapidly gain and reach stability when below the freezing front.When the content of unfrozen water(liquid water)is constant,the matric potential head maintains an almost constant value.The minimum value appears at the cold end,where the unfrozen water is minimal.The maximum value of the pressure gradient is located at the freezing front and drives the water near the unfrozen zone to migrate to the freezing front.

Figure 6 Distribution of the volumetric apparent heat capacity vs.time at different depths
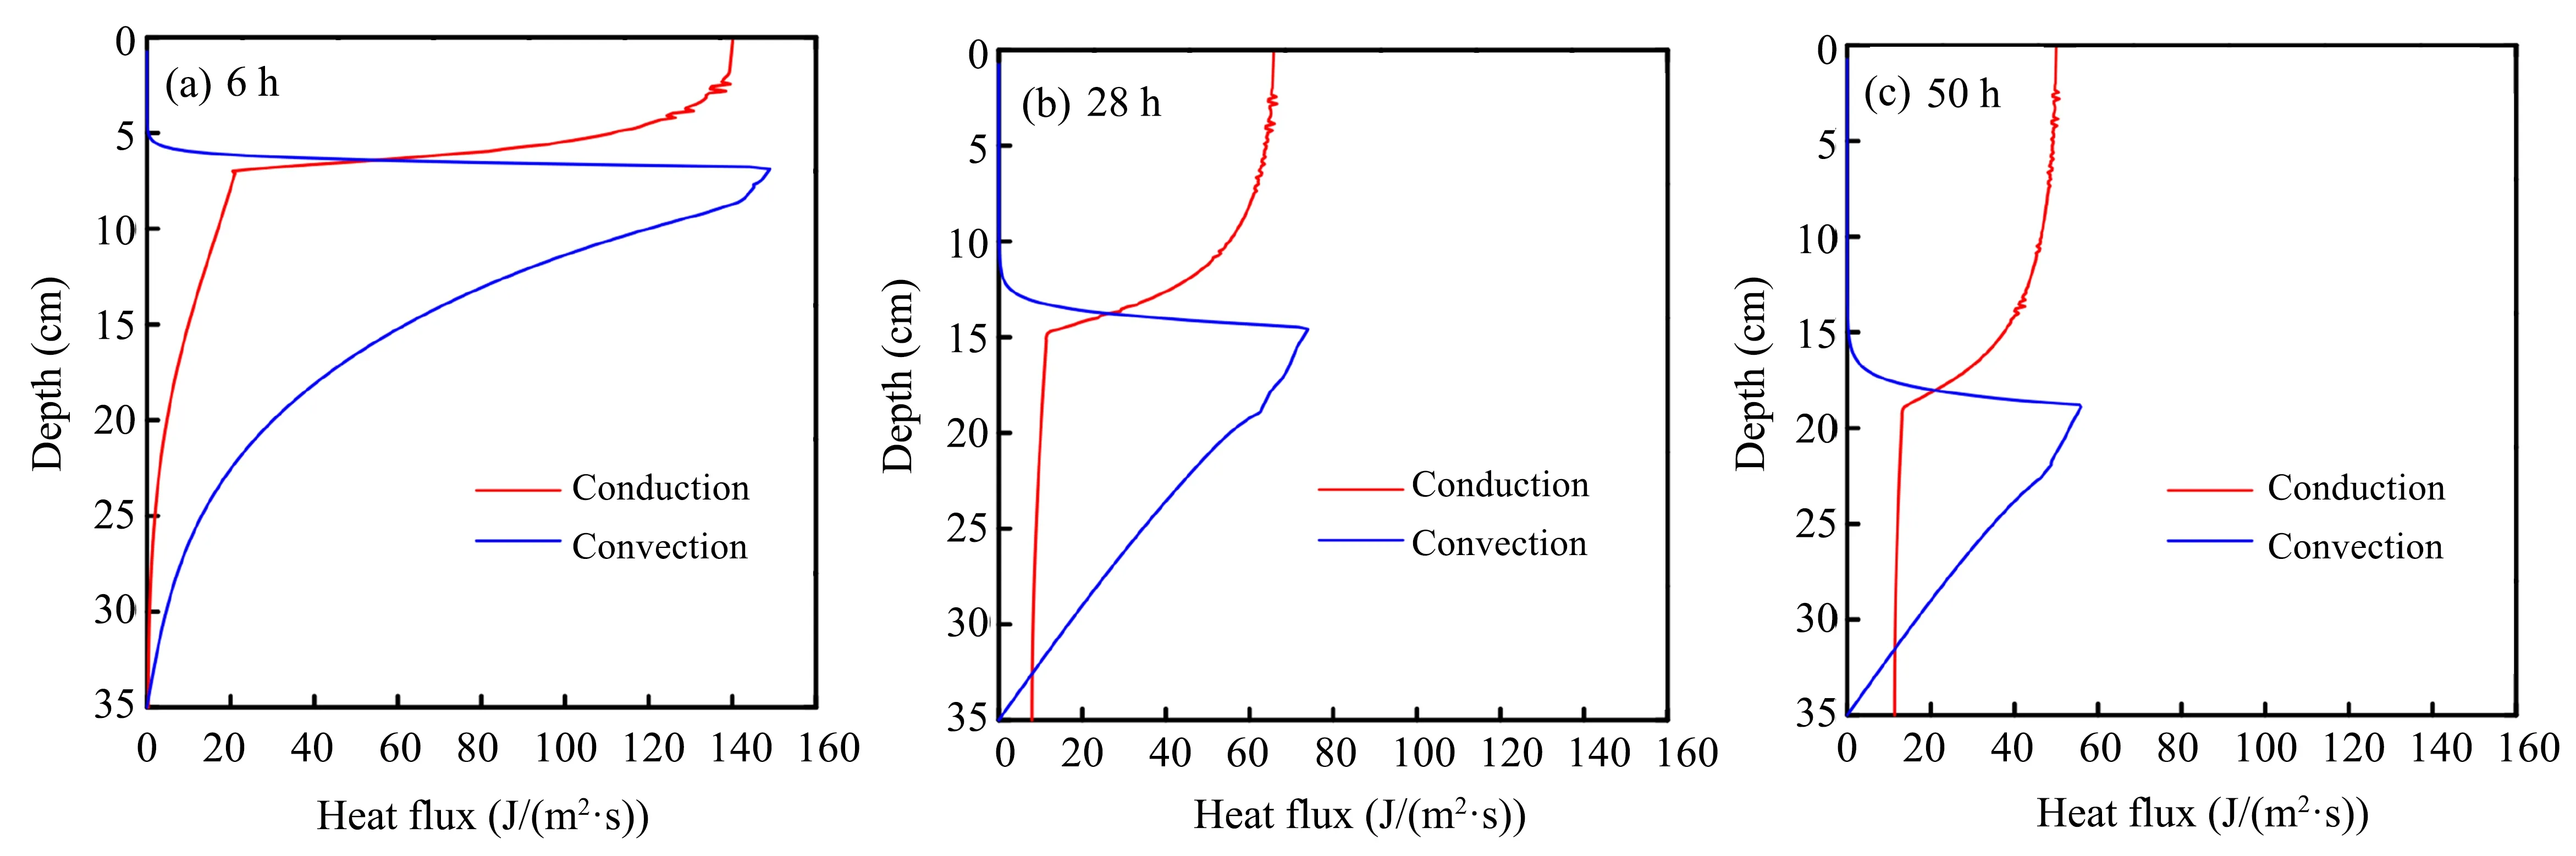
Figure 7 Distribution of the heat flux at different times
Figure 9a shows the distribution of water flux at different times,and Figure 9b shows the distribution of the water flux vs.time at different depths.The dynamic changes of water flux at different times also reflect the law of water flow.In the frozen zone,because of the small amount of liquid-water content in the soil pores,the water-flow phenomenon being negligible,the value of water flux is zero.A lot of water flows to the freezing front,so that the water-flux value reaches its peak.In the unfrozen zone,water flux gradually decreases with depth.However,as the freezing front moves from top to bottom,the peaks decrease gradually.The heat flux decreases with the freezing progress,which makes the freezing-front movement slower,and it takes a longer time for the same travel distance.When the system reaches equilibrium,the temperature profile holds a steady curve;and the freezing front does not move any more.As shown in Figure 9b,with the increase of depth and the progression of time,the active time of water flux is getting longer and longer,from another perspective,this also reflects that the movement velocity of the freezing front gradually reduces.However,the sustained time has a close relationship with the movement velocity of the freezing front.Although the water-flux peaks decrease gradually with the increase of depth,the active time of water flow increases constantly.It results that the total-water content in the frozen zone changes little.

Figure 8 Distribution of the pressure head at different times
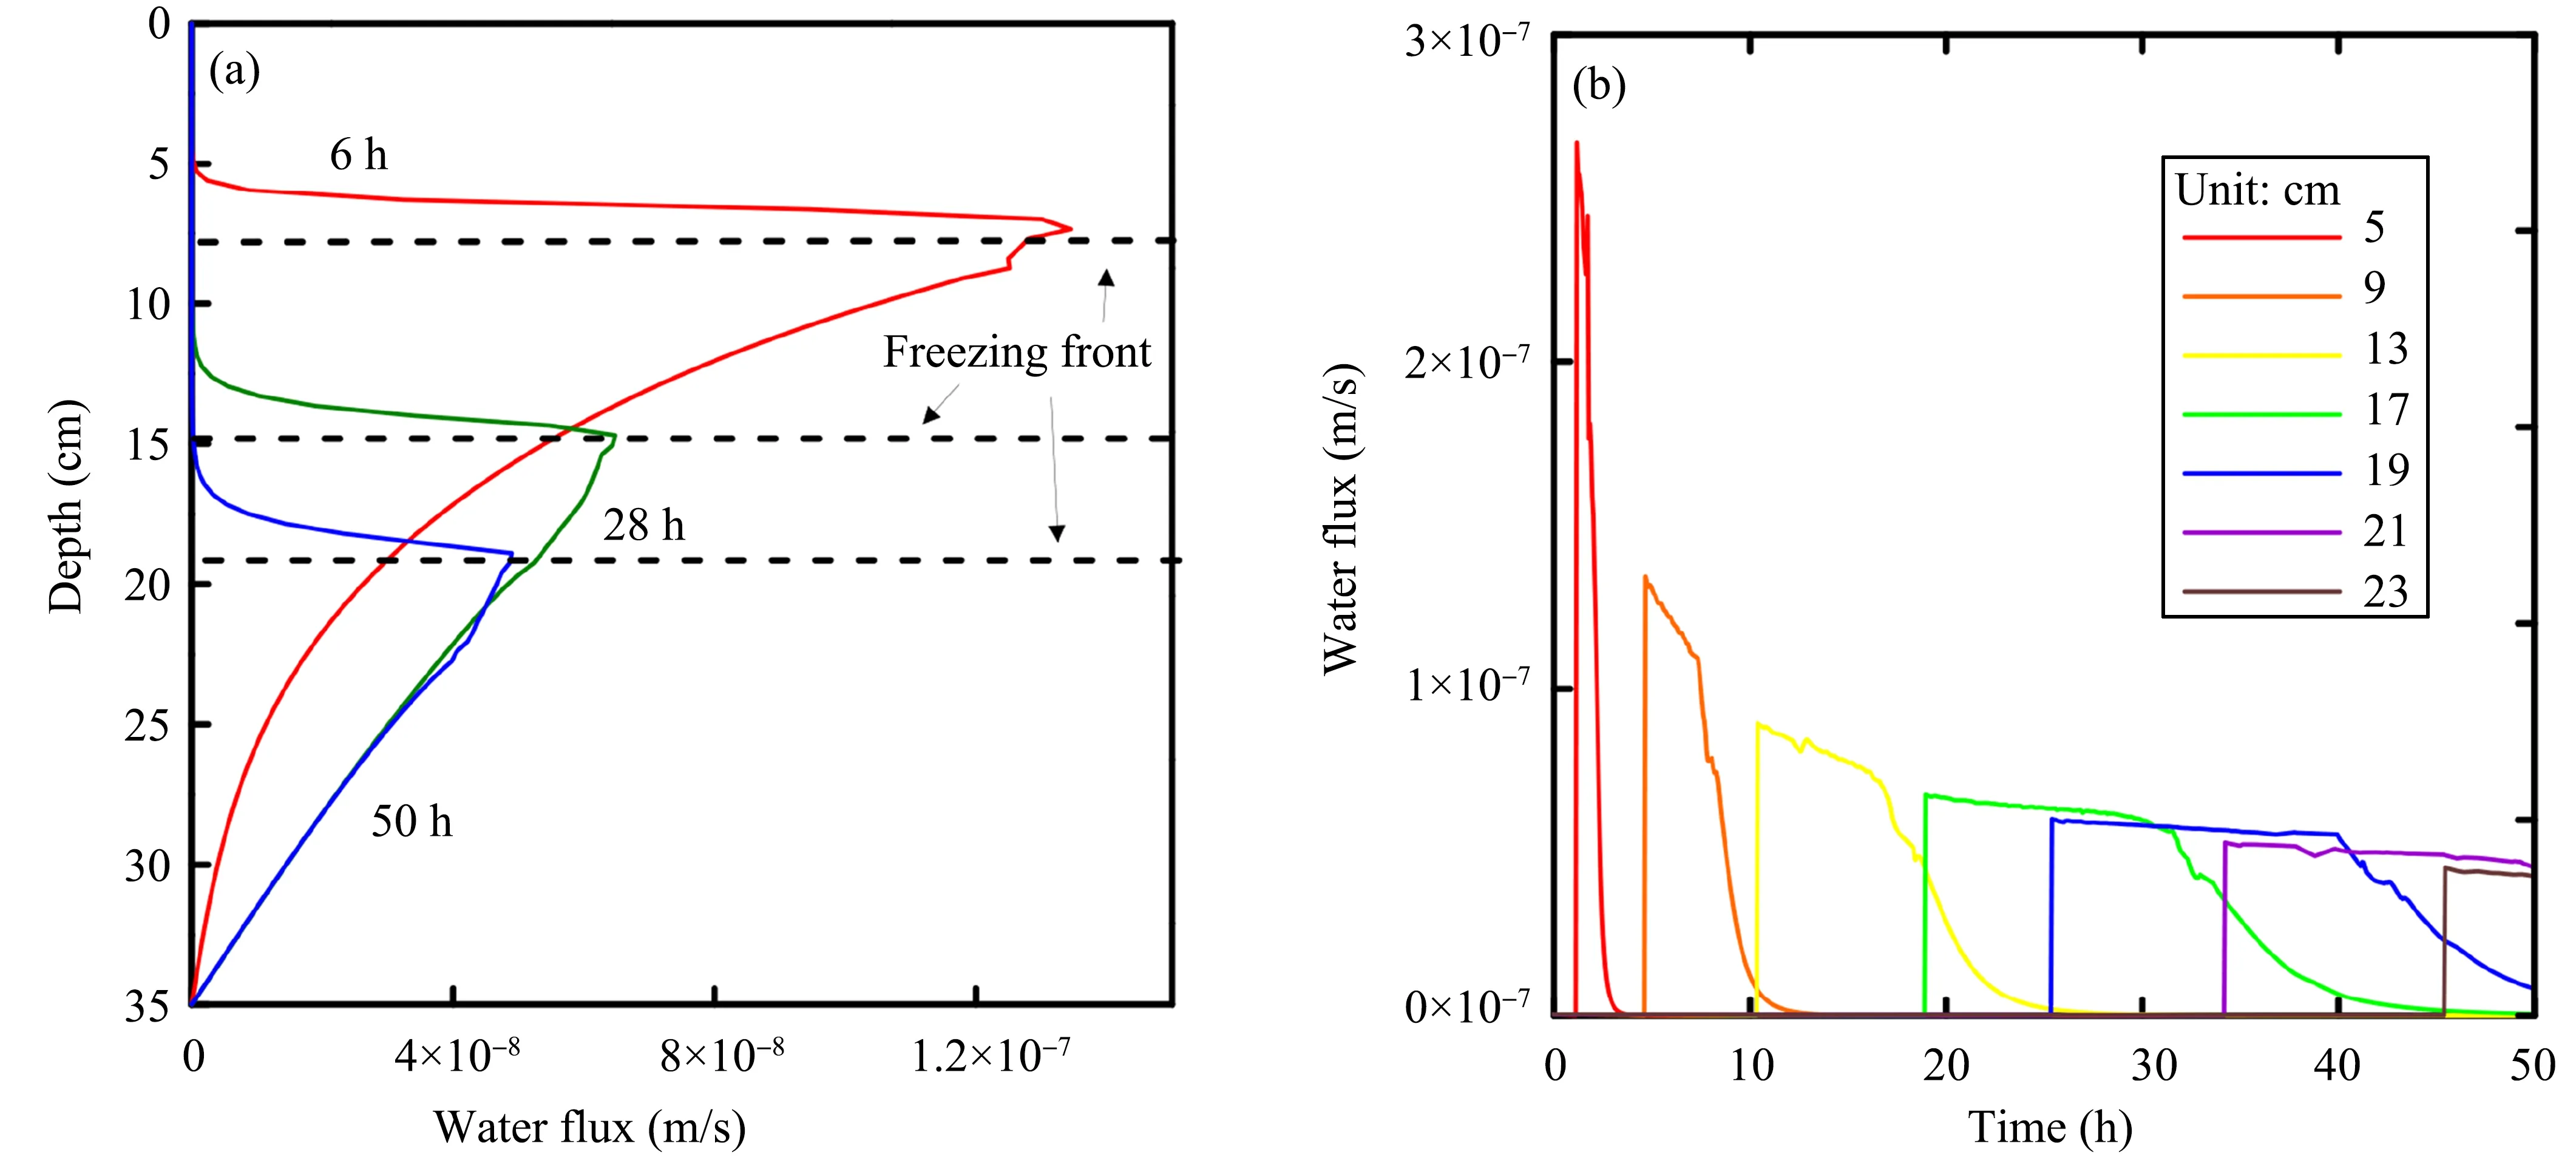
Figure 9 (a)Distribution of the water flux at different times and(b)distribution of the water flux vs.time at different depths
8 Conclusions
To understand the complicated changes in hydro and thermal fluxes and properties during soil freezing,we developed the numerical model using COMSOL and found the following:
(1)In the frozen zone,temperature change and phase change are slight,so that heat apparently flows as per Fourier's law.In the unfrozen zone,both temperature gradient and thermal conductivity become much less than those of the frozen zone,while there is non-negligible water flow,so that convection becomes greater than conduction.
(2)Convection is sensitive to the water content and drastically changes with water content and freezing rate,which changes the water flux.
(3)The change of water flux can reflect the migration velocity of the freezing front and the amount of water flow,so that the process of water-heat coupling can be shown more clearly.
Acknowledgments:
The authors acknowledge financial support from the National Natural Science Foundation of China(Grant No.41371092).This research was partially supported by the Scientific Research Starting Foundation for Returned Overseas Chinese Scholars,Ministry of Education(Grant No.20100528),China;the State Key Laboratory of Frozen Soil Engineering(SKLFSE201402);the National Key Scientific and Technological Project of Henan Province Office of Education,China(Grant No.14B170007);and the Doctoral Scientific Fund Project of Henan Polytechnic University(Grant No.648347).
 Sciences in Cold and Arid Regions2019年1期
- Sciences in Cold and Arid Regions的其它文章
- Increase in medium-size rainfall events will enhance the C-sequestration capacity of biological soil crusts
- How changes of groundwater level affect the desert riparian forest ecosystem in the Ejina Oasis,Northwest China
- Accumulation and geochemical evidence for the Little Ice Age episode in eastern Antarctica
- Primary investigation of statistical correlation between changes in ice volume and area of glaciers
- Vulnerability and adaptation of an oasis social–ecological system affected by glacier change in an arid region of northwestern China
- The changing process and trend of ground temperature around tower foundations of Qinghai-Tibet Power Transmission line