
How changes of groundwater level affect the desert riparian forest ecosystem in the Ejina Oasis,Northwest China
2019-03-14 01:50:08HaiYangXiJingTianZhangQiFengLuZhangJianHuaSiTengFeiYu
HaiYang Xi,JingTian Zhang,Qi Feng,Lu Zhang,JianHua Si,TengFei Yu
1.Key Laboratory of Ecohydrology of Inland River Basin,Institute of Eco-Environment and Resources,Chinese Academy of Sciences,Lanzhou,Gansu 730000,China
2.Alashan Desert Eco-hydrology Experimental Research Station,Ejina,Inner Mongolia 735400,China
3.CSIRO Land and Water Flagship,Canberra,ACT 2601,Australia
4.University of Chinese Academy of Sciences,Beijing 100049,China
ABSTRACT Groundwater is a key factor controlling the growth of vegetation in desert riparian systems.It is important to recognise how groundwater changes affect the riparian forest ecosystem.This information will not only help us to understand the ecological and hydrological process of the riparian forest but also provide support for ecological recovery of riparian forests and water-resources management of arid inland river basins.This study aims to estimate the suitability of the Water Vegetation Energy and Solute Modelling(WAVES)model to simulate the Ejina Desert riparian forest ecosystem changes,China,to assess effects of groundwater-depth change on the canopy leaf area index(LAI)and water budgets,and to ascertain the suitable groundwater depth for preserving the stability and structure of desert riparian forest.Results demonstrated that the WAVES model can simulate changes to ecological and hydrological processes.The annual mean water consumption of a Tamarix chinensis riparian forest was less than that of a Populus euphratica riparian forest,and the canopy LAI of the desert riparian forest should increase as groundwater depth decreases.Groundwater changes could significantly influence water budgets for T.chinensis and P.euphratica riparian forests and show the positive and negative effects on vegetation growth and water budgets of riparian forests.Maintaining the annual mean groundwater depth at around 1.7-2.7 m is critical for healthy riparian forest growth.This study highlights the importance of considering groundwater-change impacts on desert riparian vegetation and water-balance applications in ecological restoration and efficient water-resource management in the Heihe River Basin.
Keywords:groundwater changes;desert riparian forest;Ejina Oasis;WAVES;leaf area index(LAI);water budgets
1 Introduction
In arid regions,riparian forest is a vital vegetation type that dominates the riparian ecosystems and the landscape types(Yang et al.,2009).It is also a core component of arid inland river basin ecosystems and maintains the material cycle and energy flow in desert regions(Li et al.,2013).Desert riparian forest provides important habitats for plants and animals and maintains the biodiversity of the local ecosystem,especially in arid and semiarid regions(Sabo et al.,2005;Perry et al.,2012).Desert riparian forest zones are important locations for various ecological and hy-drological processes,including the water cycle,biogeochemical(or nutrient)cycling,energy flow,and community dynamics.These processes mainly manifest in the effects of hydrological changes on biological activities and the responses of hydrological factors to biological activities.In addition,the exchanges between river and groundwater determine the biogeochemical and ecological processes at the river-groundwater interface(Vogt et al.,2012).Water resources,including rainfall,groundwater,and surface runoff,are the main limiting factors for survival and growth of riparian vegetation,especially in arid zones.Furthermore,because precipitation is limited and vegetation is correspondingly sparse,the desert riparian forest environment is very vulnerable,with desert plants usually experiencing water scarcity(Fu et al.,2014).
In riparian forests,surface flow,groundwater,and precipitation are important natural sources of water for plants(Lamontagne et al.,2005).The surface flow is generally very limited both spatially and temporally;most arid vegetation relies on precipitation,groundwater,or a combination of the two(Hao et al.,2010).Under low precipitation conditions,groundwater becomes the most immediate and important source of water for plants in inland river basins(Pang et al.,2010).However,any changes of groundwater level change the current water gradients in the ecosystem and alter the water balance(Doody et al.,2009);and further influence the amount,development and composition of vegetation(Jansson et al.,2007;Kuglerová et al.,2014;Fu and Burgher,2015)and plant communities(Chen et al.,2006;Fan et al.,2011).Groundwater changes bring about a tremendous impact on the fragile ecosystem(Chen et al.,2015).For example,Scott et al.(2008)quantified the relationship between riparian evapotranspiration(ET)and groundwater use,discussing the relationship between ET and groundwater.Changes in LAI can effectively reflect the riparian plant-community conditions(Smettem et al.,2013).Jia et al.(2009)estimated the leaf area index(LAI)using remote-sensing data and found values changing from 0.004 to 3.753 in the Ejina Oasis.These studies showed that it is important to recognize the effects of groundwater changes on riparian forests.
Groundwater decline has a strong impact on many riparian ecosystems in arid and semiarid regions of the world.However,either groundwater-level declines or rises can cause vegetation degeneration;the former disturbs the balance between plants and water(owing to reduced water availability),the latter reduces the oxygen levels of root respiration(e.g.,Stromberg et al.,1996;Hao et al.,2010).Maintaining an appropriate groundwater level is necessary to preserve ecosystem stability.Groundwater-level decline could cause vegetation degeneration.Sommer and Froend(2014)concluded that small changes in groundwater depth could lead to transitions between states,with ongoing drying of the landscape.Hose et al.(2014)showed that vegetation varied with median groundwater depth.Groundwater-level decline mainly changes the plant-water balance by reducing the available water,affecting transpiration,height,leaf number,leaf area,and plant health.Such decreases with increasing rates of groundwater-level decline cause drought stress of the vegetation and promote root elongation in all substrates(Mahoney and Rood,1992).In longterm decline of the groundwater level,the vegetation changes toward a more xerophytic community(Muñoz-Reinoso,2001).Hao et al.(2010)revealed that groundwater depth(GWD)and soil moisture affect the distribution of plants;the water level should be maintained at 2-4 m for restoring the vegetation and ecosystem of the lower reaches of the Tarim River.Over the past 40 years,the agroecosystems on the middle and lower reaches of the Heihe River have been rapidly deteriorating because of anthropogenic factors such as large-scale exploitation of surface-and groundwater resources.This overexploitation of water resources in the midstream of the river has led to the lowering of groundwater-level depths,drying up of lakes,wilting of plants,degradation of oases,and exacerbation of dust storms(Feng et al.,2012).From 1960 to 2001,the area of Populus euphratica forest decreased from 2.94×10⁴km2to 2.06×10⁴km2and the area of Tamarix chinensis forest declined from 1,500 km2to 837 km2in the Ejina region.Degradation of the vegetation has exacerbated the regional desertification(Feng et al.,2012).Understanding the relationship between groundwater depth and vegetation has therefore become a high priority in this area.For the past several decades,considerable research has been carried out on the relationship between groundwater and vegetation in the Heihe River Basin(Jia et al.,2009;Zhao et al.,2012;Fu et al.,2014).Zhao et al.(2007)built the relationship between vegetation coverage and groundwater level and estimated the spatiotemporal distribution of potential vegetation.These studies provide a basis for understanding the effects of groundwater depth on riparian forest vegetation in the lower reaches of Heihe River Basin.However,previous studies have put little emphasis on ecological and hydrological processes for understanding the relationship between groundwater depth and the desert riparian forest ecological system.
The process-based model WAVES(Water Vegetation Energy and Solute Modeling)is designed to simulate energy,water,carbon,and solute balances of a one-dimensional soil-canopy-atmosphere system(Dawes and Short,1993,Zhang et al.,1996).It integrates soil-canopy-atmosphere interactions with a considerable level of process detail and predicts the dynamic interactions and feedbacks between the processes(Zhang et al.,1996).For example,the WAVES model can reliably predict the hydrological responses(e.g.,Silberstein et al.,2013;Cheng et al.,2014a,b);however,the particular response of desert riparian vegetation to groundwater change has never before been studied using this approach.
In this study,WAVES was applied in four scenarios to investigate the effects of groundwater-depth changes on canopy LAI and the water budget and their potentialvariations under currentclimate change.Two representative experimental sites in the Ejina Desert riparian forest were selected with contrasting vegetation classes(i.e.,forest versus shrub)and groundwater depths.The two selected experimental sites included the Populus euphratica forest and the Tamarix chinensis forest.The statistical relational model between stream flow through the Langxin Mountain section and groundwater depth of the experimental sites was established based on historical observation data.This statistical model would be used to estimate four scenarios of groundwater depths of experimental sites under different guaranteed rates of stream flow through Langxin Mountain section from the upstream reservoir of the Heihe River.This study has four objectives:(1)to assess effects of groundwater-depth change on canopy LAI under different vegetation patterns,(2)to investigate whether groundwater changes can cause changes in water budgets at two experimental sites;and(3)to identify the appropriate groundwater depth for preserving the stability and structure of plant communities in the P.euphratica and T.chinensis riparian forests.
2 Materials and methods
2.1 Study area
This study was conducted in the Ejina Desert riparian forest,located in Ejina County of the Inner Mongolia Autonomous Region,Northwest China.The study area is located on the lower reaches of the Heihe River Basin(99°00′E-102°00′E,39°49′N-42°30′N)(Figure 1).The average annual streamflow volume was approximately 531×106m3passing through the Langxin Mountain Hydrological Station from 1999 to 2013 on the lower reaches of the Heihe River Basin.The Heihe River is divided into the East River and the West River below the Langxin Mountain Station(100°19.4′E,41°2.2′N),whose annual mean runoff time is 214 days for the period 1999-2013,with most flow events occurring from August to October of one year and December to April of the next.The study area is representative of an extreme drought region with sparse precipitation and intense evaporation.It is dry and cold in winter and spring.Annual average precipitation was approximately 34 mm.The average annual pan evaporation is 3,218 mm(Xi et al.,2016).The Heihe River is an important source of water resources for the Ejina Desert oasis.The river channels are wide and shallow,with mostly Quaternary unconsolidated sediments,combined with an intensive network of tributaries;therefore,the river seepage directly recharges the groundwater of the desert riparian forest.
The groundwater level in the desert riparian forest is usually located 1-4 m below the surface,so the river has a direct hydrological connection with the aquifer.Vegetation along the stream is predominantly desert riparian forest and riparian shrubbery:for example,P.euphratica forest,P.euphratica and T.chinensis mixed forest,and T.chinensis forest.Therefore,we selected the P.euphratica forest and the T.chinensis forest as sites to study the relationship between hydrology and ecosystem of desert riparian forest(Figure 1).The experimental sites of T.chinensis forest and P.euphratica forest are located at 101.050°E,42.033°N and 101.238°E,42.020°N,respectively.
2.2 Research data
The daily meteorological data of the Ejina Weather Station(No.52267)from 2000 to 2014 were obtained from the China Meteorological Data Sharing Service System(http://data.cma.gov.cn/);and the data included precipitation,maximum and minimum temperature,vapour-pressure deficit,rainfall duration,and solar radiation.The runoff data from 2000 to 2013(Langxin Mountain Hydrological Station)were obtained from the Management Bureau of the Heihe River Basin(http://www.hhglj.org/).Groundwater depth was obtained by observation from 2000 to 2014.For the automatic observation of groundwater,automatic pressure transducers(HOBO U20-001-04,Onset Computer Corporation,USA)were installed into observation wells to monitor the water head.Physical properties of the soil and distribution of plant roots were obtained through digging a soil-section survey in field experimental sites of the T.chinensis forest and the P.euphratica forest.The soil section was divided into three layers by soil types,with a depth to 3 m overall.The soil parameters,including saturated hydraulic conductivity,were measured by DIK-4012 Permeameter;volumetric soil-moisture content at saturation and air-dry volumetric water content were measured by the oven-drying method;soil mechanical component of samples was measured by the Mastersizer-2000 laser particle-size analyser,which has the measurement range of 0.02-2,000 μm and a relative error of less than 3%.
An eddy-covariance system was installed in the T.chinensis forest site from 2011 to 2012 and reinstalled at the site of the P.euphratica forest on a 10 m tower above the canopy from 2013 to 2014 at the Alashan Desert Eco-hydrology Experimental Research Station(Figure 1).The eddy-covariance system was produced by Campbell Scientific,Inc..The wind speed and concentration measurements were measured using a CSAT3 Three Dimensional Sonic Anemometer by CR3000 and CR1000 data-loggers.Air temperature and humidity were measured on the towers with Vaisala HMP45C probes.CO2and H2O were measured with an LI-7500.Net radiation was measured with CNR4.Soil-water content was measured using Enviro SMART.The ET was calculated daily;for the method and process,see the details in Scott(2010),Williams et al.(2004),and Wilson et al.(2001).
The LAI was obtained from MODIS Land Product Subsets(MOD15A2,Collection 5)(ORNL DAAC,2018),with a quadrate of 7 km×7 km(resolution 1 km×1 km)and a time period of 2000 to 2014.The raw LAI was smoothed by the Savitzky-Golay filtering method,and quality control of data was implemented using TIMESET 3.1(Jönsson and Eklundh,2004;Eklundh and Jönsson,2011).
2.3 Methods
2.3.1 WAVES models
The WAVES models were established using one canopy layer and three soil layers,according to the results of the vegetation-and soil-profile survey at the T.chinensis forest experimental site and the P.euphratica forest experimental site,respectively.The canopy layer reflects the vegetation type of species composition in WAVES model;the one canopy layer in this study means the T.chinensis forest or the P.euphratica forest.The groundwater depth observed at the two experimental sites was set as the lower boundary condition in the WAVES models.The simulated periods were 2000-2013 and 2000-2014 for the T.chinensis forest and P.euphratica forest,respectively.
2.3.2 Groundwater-depth estimates under different scenarios of runoff
The groundwater changes of the two experimental sites under different runoff scenarios from 2000 to 2014 were calculated by the statistical relational model between stream flow through the Langxin Mountain section and groundwater depth of the experimental sites.The daily groundwater depths were imported into the WAVES models to represent the ecohydrological change of the two experimental sites,so as to analyse the effect of groundwater-depth change on the vegetation of the ecosystem.Based on the"Administrative measures of water dispatch for main stream of Heihe"plan by China's Ministry of Water Resources in May 2009,each year,the authority of the Heihe River Basin determines different guaranteed rates of water supply to dispatch water through the Langxin Mountain Station from upstream of the Heihe River to the lower stream,based on the runoff volume through Zhengyixia Station.Therefore,this study assumed four scenarios of runoff under 25%,50%,75%,and 90%guaranteed rates(Frequency)of water supply through the Langxin Mountain section.
2.3.3 Parameter estimation
Only one vegetation layer was considered for each of experimental desert riparian forest sites.The vegetation was set as Populuseuphratica and Tamarixchinensis at the two sites,as appropriate.For each vegetation type of the riparian forest,26 vegetation parameters were used to represent the physiological and phenological processes of plant growth in the WAVES model(Cheng et al.,2014a).The vegetation-growth module of WAVES aims to capture the most important rate-based processes within plants that control growth,death,and water use.The vegetation parameters are shown in Table 1.Most of the parameters listed above were measured directly or taken from the literature on plant physiology,with only a few remaining that required simple model fitting or adaptation to local conditions(Zhang and Dawes,1998).
The depth of the simulated soil profile was set to 3 m,according to the depth of a typical soil column from the surveys at the experimental sites.The maximum depths of the roots of the T.chinensis forest and the P.euphratica forest experimental sites were set as 1.8 and 2.0 m,respectively,based on the soil-profile surveys.In addition,the soil profiles were divided into three layers with 23 unequally spaced nodes at the two sites;the soil-water content and root growth also were estimated.
Some vegetation and soil parameters needed to be optimized.Optimized vegetation parameters included the rainfall-interception coefficient,the light-extinction coefficient,the maximum carbon-assimilation rate,and so on(Cheng et al.,2014b).Optimized soil parameters include the soil-capillary length scale(λ),and the soil-structure parameter(C).These optimized vegetation and soil parameters were determined by minimizing the percent bias(PBIAS)and root mean square error(RMSE);maximizing the Nash-Sutcliffe coefficient(NSE)and coefficient of determination(R2)between simulated ET,soil-water content,and LAI with observed ET and soil-water content,and MODIS LAI at experimental sites.The parameter-optimization processes was completed by hydroGOF R package(Zambrano-Bigiarini,2011).
2.3.4 Scenario modelling
Five simulation experiments were designed to estimate the ecohydrological responses to change of groundwater depths at the two experimental sites.In the first simulation experiment,labelled"Reference",all vegetation and soil parameters were kept the same as the optimized values;and the model was run with observed daily meteorological and groundwater depths.The results of"Reference"represent the water balance under current climatic and groundwater-depth conditions."Reference"thus provided the reference for assessing the impact of groundwater-depth change on the water balance and vegetation ecosystem.Experimental Scenarios 1,2,3,and 4 were designed to estimate the impact of groundwater-depth change under current climatic conditions and different groundwater depths under the aforementioned four scenarios of runoff.The simulated periods were from 2000 to 2013(5,110 days)and from 2000 to 2014(5,475 days)for the T.chinensis forest and the P.euphratica forest experimental sites,respectively.
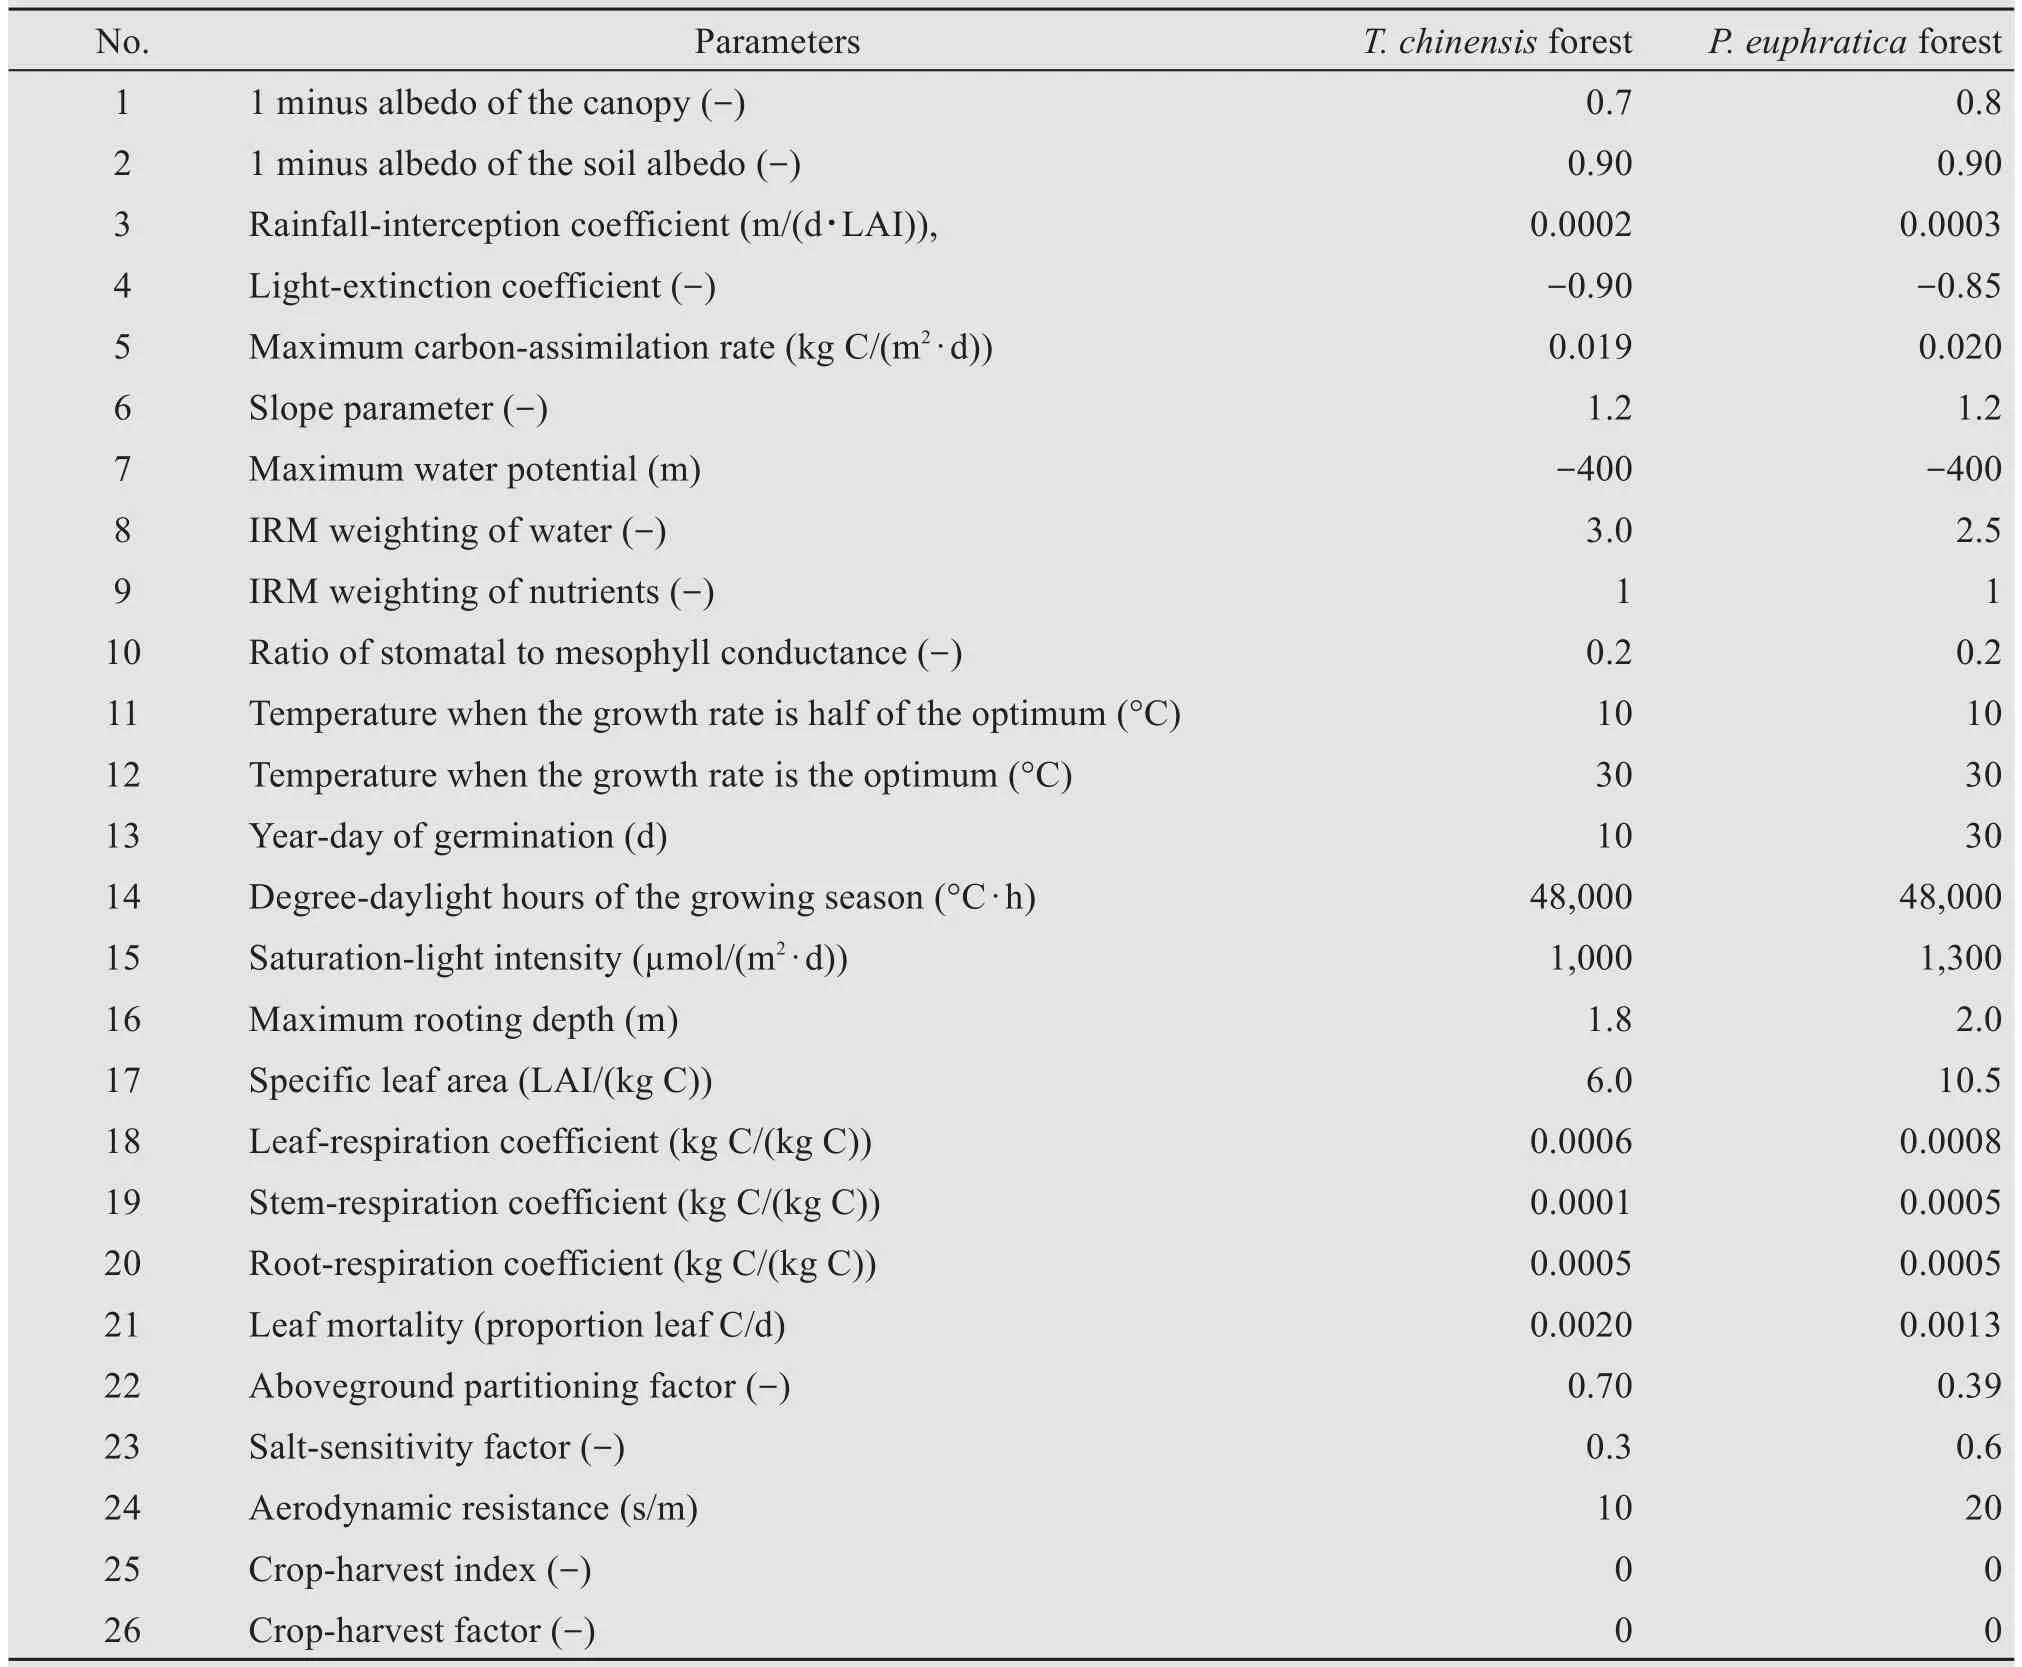
Table 1 Names,units,and parameter value of key physiological parameters of the WAVES model
3 Results
3.1 Simulation results for validation of the WAVES Model
Comparison of observation data with simulated data is a very important step for calibrating the model,as it can determine whether the model can simulate the reality of the situation precisely.The WAVES model was calibrated using daily ET calculated from the eddy-covariance observation system,observed daily soil-water content,and the 8-day MODIS LAI.The model simulated changes in the ecological and hydrological processes of the T.chinensis forest(2000-2013)and the P.euphratica forest(2000-2014)experimental sites under current climate and groundwater conditions.Optimized vegetation parameters are listed in Table 1.Simulated LAI,ET,and soil-water content in the T.chinensis and the P.euphratica forest experimental sites were compared with observations(Figure 2,Figure 3,and Figure 4,respectively).Figure 2 shows that the simulated ET was in accordance with the observed ET.The peak value of simulated ET was slightly higher than the observed ET in the P.euphratica and the T.chinensis forest experimental sites.The simulated LAI values had almost the same changes as those of the observed LAI at the two experimental sites,but the peak values simulated were slightly higher than those of the MODIS LAI at both experimental sites,mainly because the resolution of MODIS LAI values is 8-day and the resolution of simulated LAI values is daily,so that the MODIS LAI values cannot effectively reflect the peak-value changes and a too-large grid smooths out peaks.
The goodness-of-fit measures to compare observed and simulated ET,LAI,and soil-water content values are shown in Table 2.The PBIAS,R2,NSE,and RMSE were calculated to calibrate and validate the WAVES model.The PBIAS of simulated ET,LAI,and mean SWC were 8.5,-5.2,and 5.4,re-spectively,for the T.chinensis forest experimental site.The R2and NSE of simulated ET,LAI,and mean SWC were 0.79,0.94,0.81,and 0.74,0.93,0.57,respectively,for the T.chinensis forest experimental site.These results indicated that LAI was reasonably well simulated,ET was second in terms of simulation efficiency,and mean SWC was simulated the most poorly in the T.chinensis forest experimental site.However,the smallest NSE value among the ET,LAI,and mean SWC was close to 0.6,which suggests that the model is capable of simulating the change in ecological and hydrological processes at the T.chinensis forest experimental site.Similarly,the PBIAS,R2,and NSE at the P.euphratica forest experimental site can be seen in Table 2.The results of goodness-of-fit parameters show that the model can simulate well the ET and LAI,as compared with the observed values;however,the mean SWC simulated was worse at the P.euphratica forest experimental site.Although the PBIAS and R2of the mean SWC were 4 and 0.92,the NSE of the simulated mean SWC was-2.76.The value of-2.76 may be because the SWC data of the short series was used to calibrate the simulated SWC.The above results indicated that WAVES essentially simulates changes in ecological and hydrological processes well in the Ejina Desert riparian forest under different hydrological conditions and vegetation types.
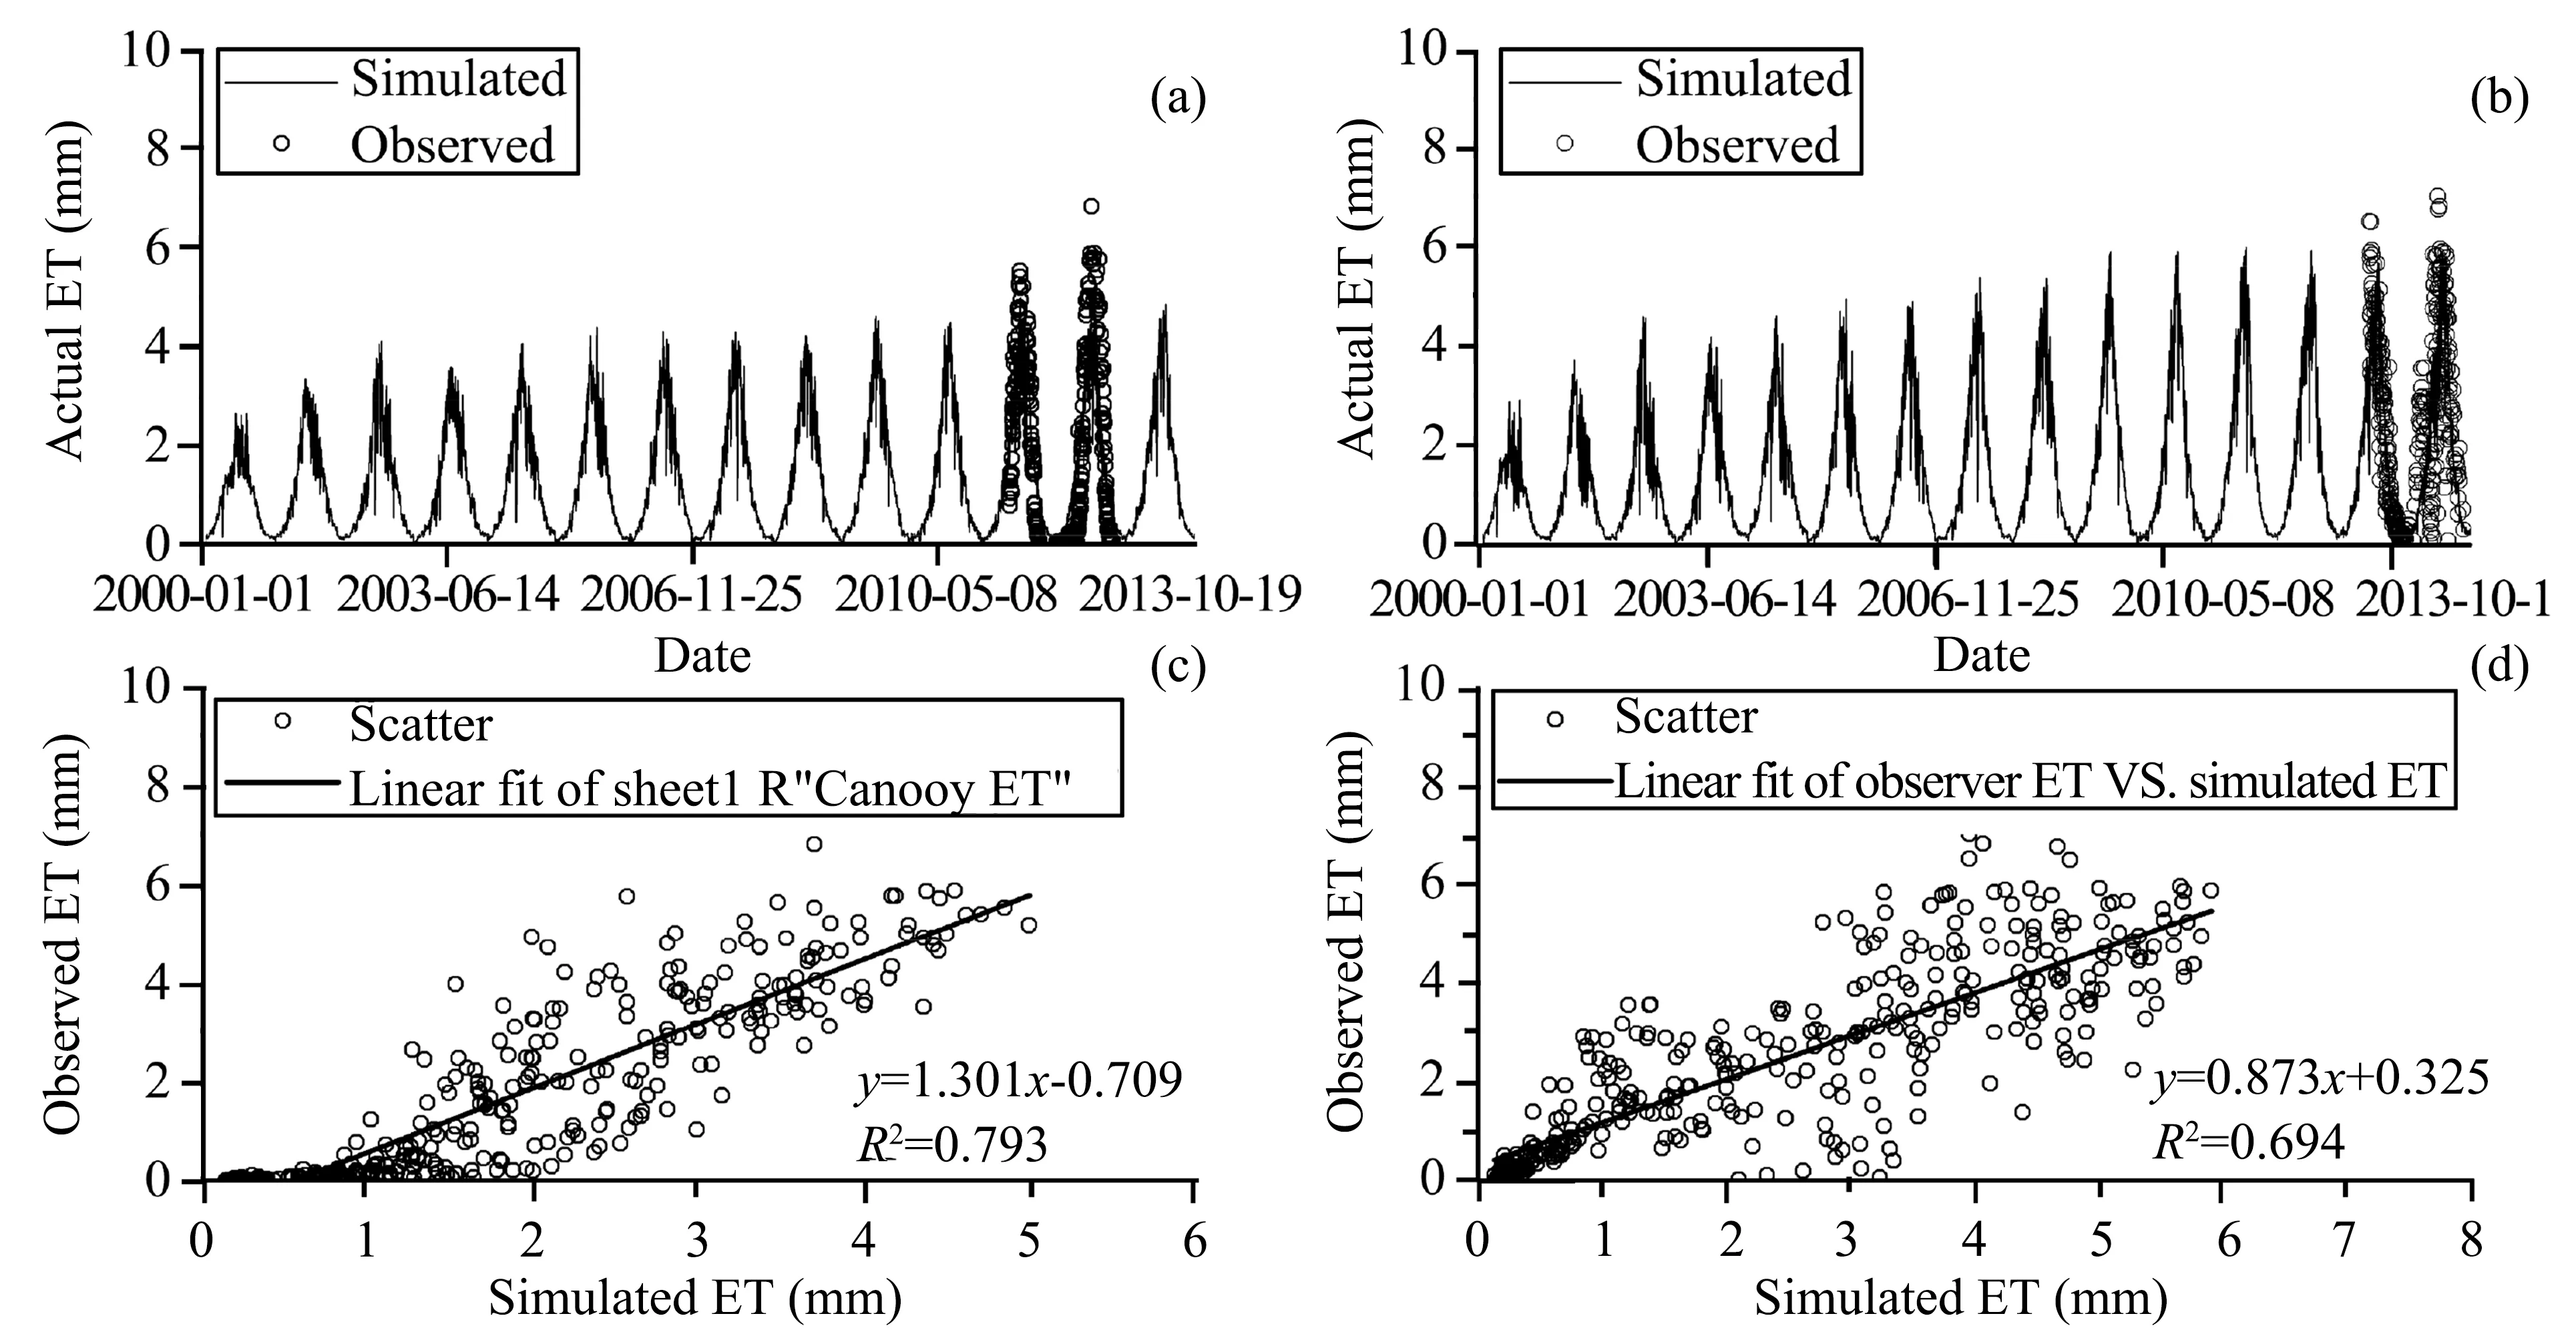
Figure 2 Comparison between simulated and observed ET of T.chinensis forest from January 2011 to December 2012(a)and(c);ET of P.euphratica forest from July 2013 to December 2014(b)and(d)

Figure 3 Comparison between simulated and observed leaf area index(LAI)of T.chinensis forest from 2001 to 2013(a)and(c);LAI of P.euphratica forest from 2001 to 2014(b)and(d)
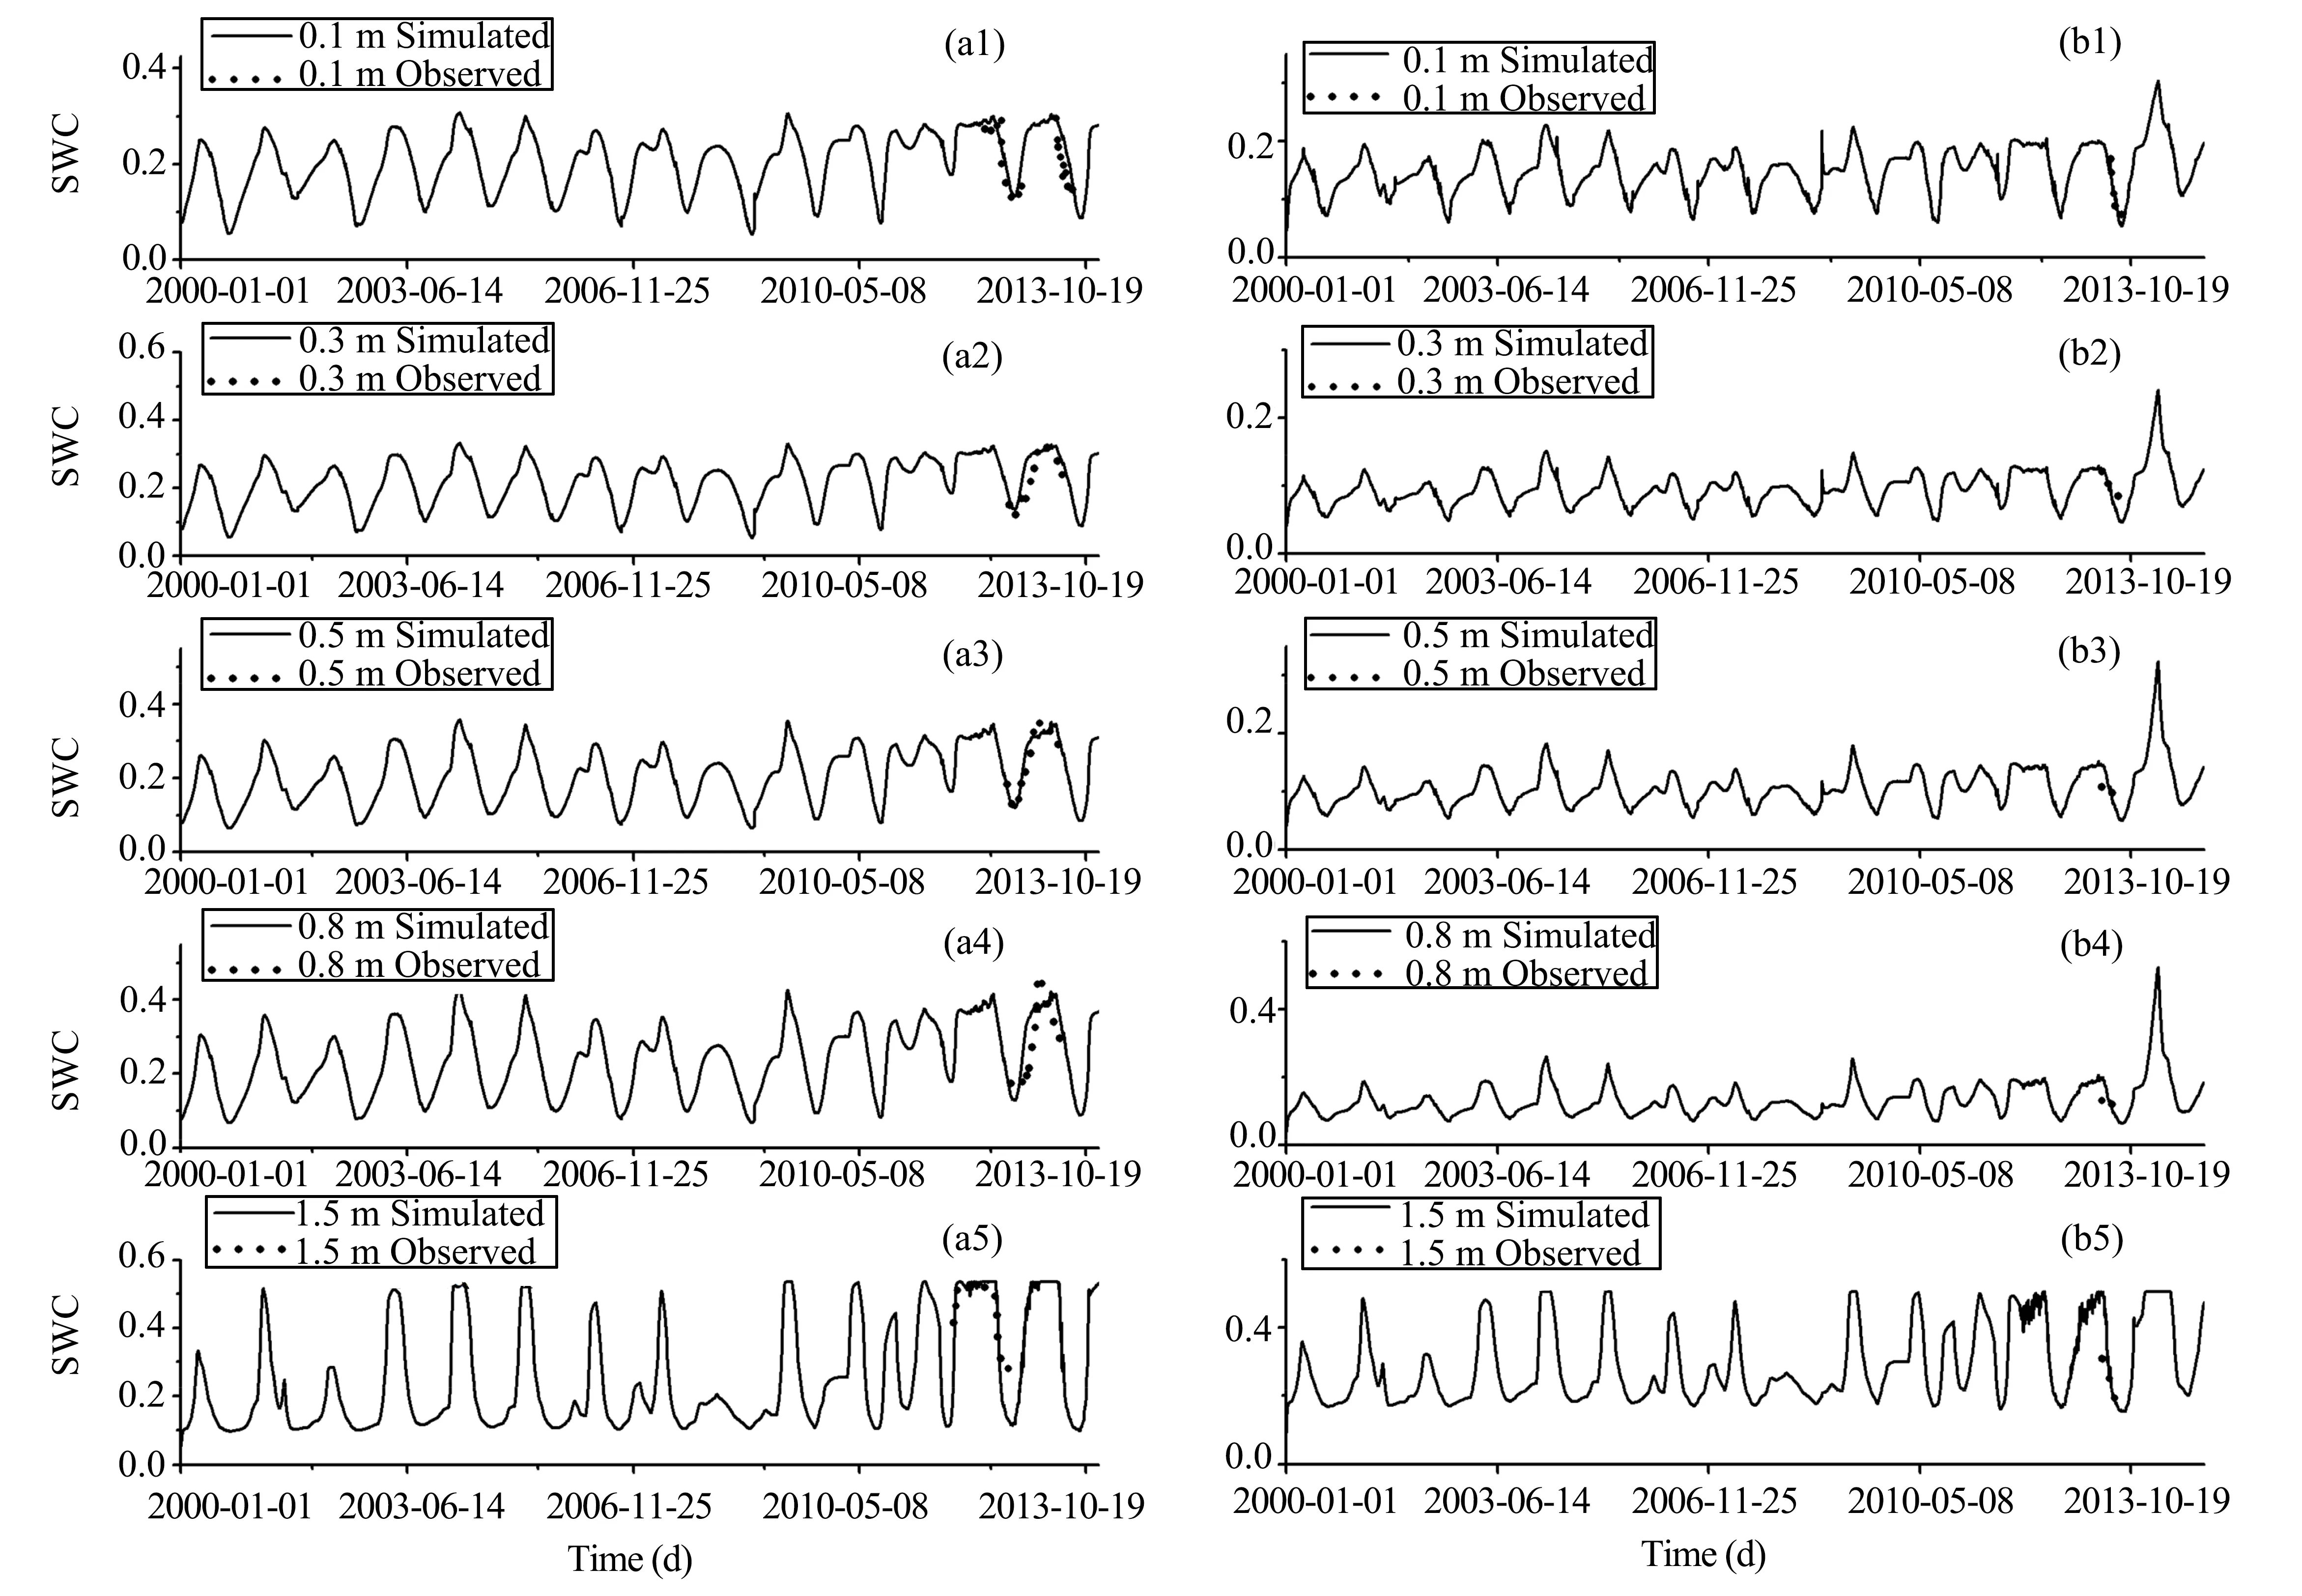
Figure 4 Comparison between simulated and observed soil-water content(SWC)of T.chinensis forest from January 2012 to July 2013(a1:SWC at 0.1 m depth,a2:SWC at 0.3 m depth,a3:SWC at 0.5 m depth,a4:SWC at 0.8 m depth,a5:SWC at 1.5 m depth);SWC of P.euphratica forest from January to September 2013(b1:SWC at 0.1 m depth,b2:SWC at 0.3 m depth,b3:SWC at 0.5 m depth,b4:SWC at 0.8 m depth,b5:SWC at 1.5 m depth)
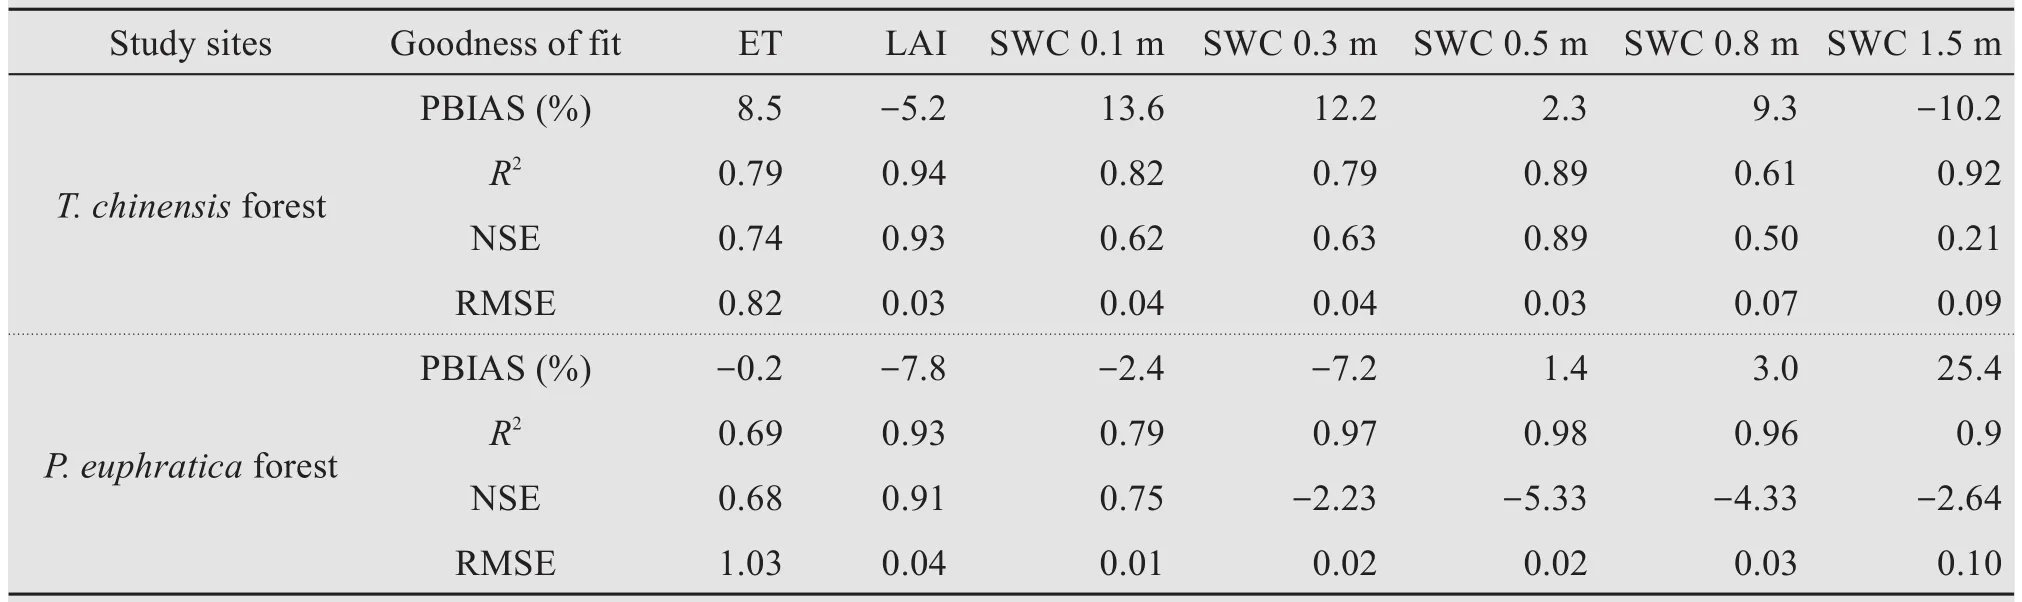
Table 2 Goodness-of-fit measures to compare observed and simulated ET,LAI,and soil-water content values of different depths(0.1 to 1.5 m)
3.2 Groundwater depths estimated under different scenarios of runoff
By analyzing the runoff through Langxin Mountain Station from 1988 to 2013 and the annual mean groundwater-depth change of the T.chinensis forest and the P.euphratica forest experimental sites(Figure 5),it can be seen that the tendency is opposite between annual mean runoff through Langxin Mountain and the groundwater depth.The groundwater depth decreased with the increasing of runoff and vice versa(Figures 5a,5b).The response of the groundwater depth to runoff is very obvious;the two have a typical linear correlation(Figures 5c,5d).The correlation coefficient between the annual mean runoff through Langxin Mountain and the groundwater depth of the P.euphratica and the T.chinensis forest experimental sites are-0.879 and-0.853,respectively.The annual mean runoff through Langxin Mountain under 25%,50%,75%,and 90%of the guaranteed rate is calculated by the Pearson III frequency curve method;they are 6.095×10⁸m3,4.479×108m3,3.180×108m3,and 2.257×10⁸m3,respectively(Figure 6).The annual mean groundwater depths of the T.chinensis and the P.euphratica forest experimental sites under different runoff guaranteed rates through Langxin Mountain are estimated by a linear statistical model(Figures 5c,5d).The estimated results are shown in Table 3.
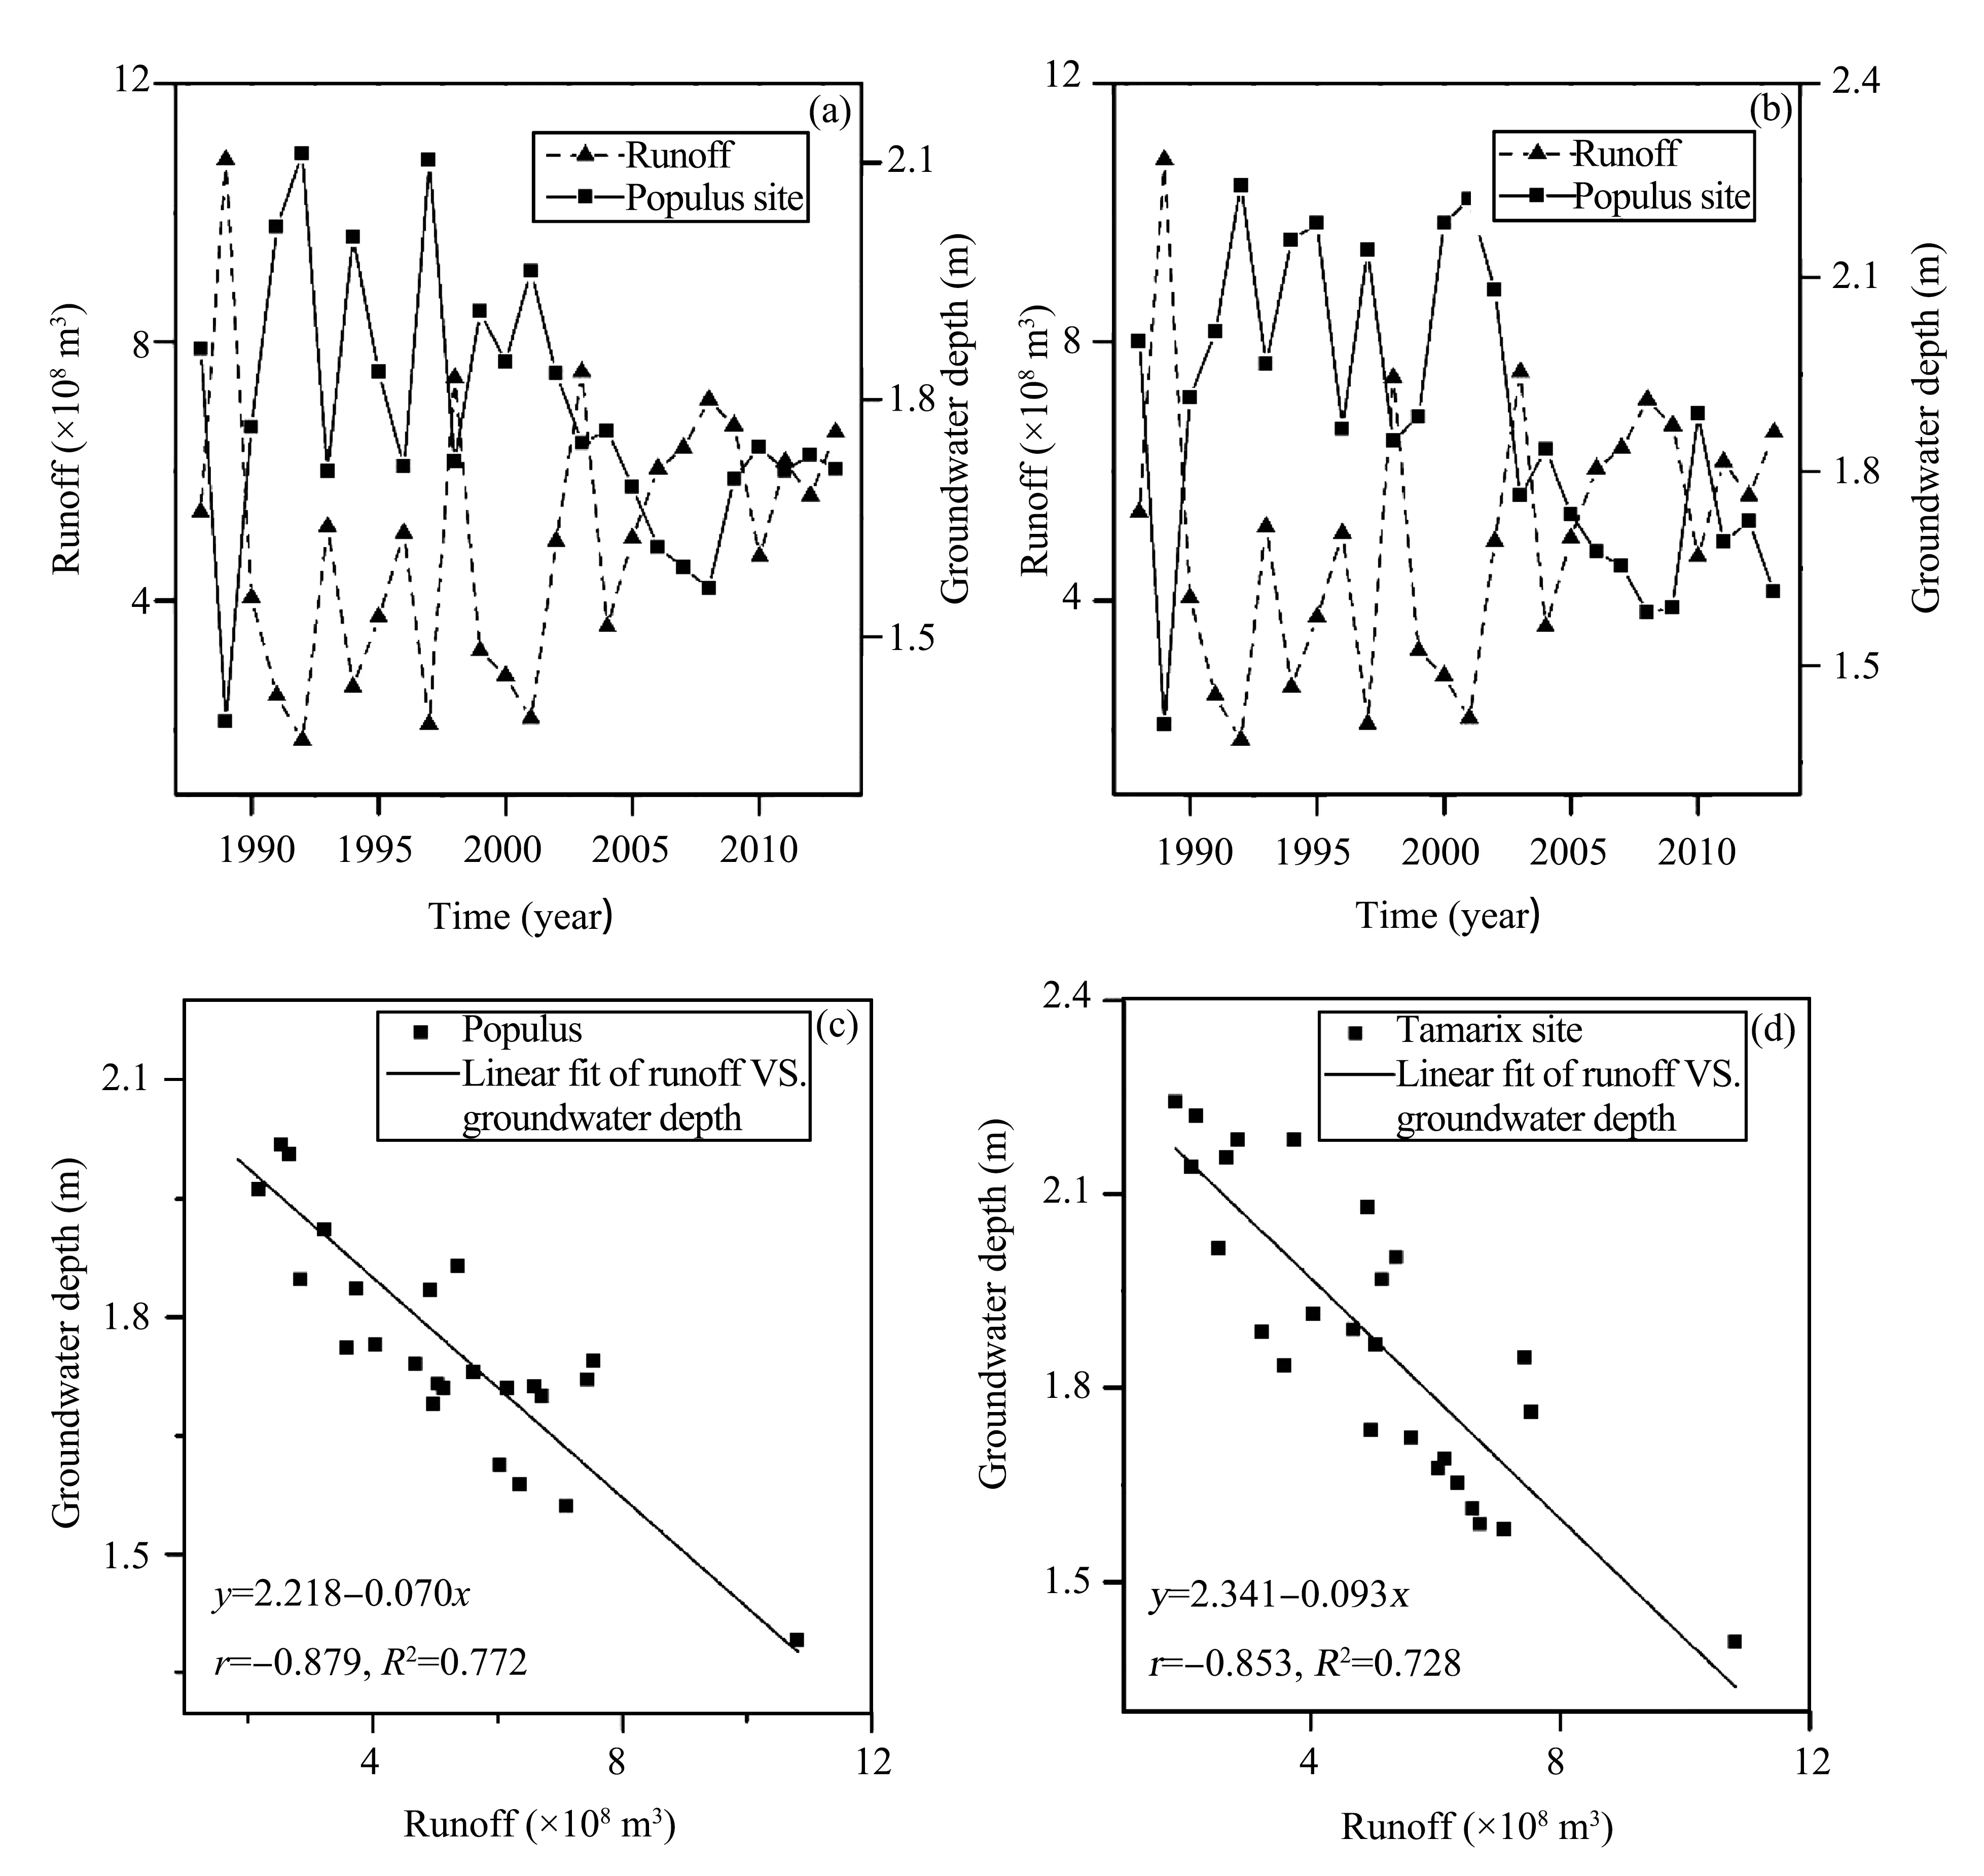
Figure 5 Relationship between the annual mean runoff of Langxin Mountain and the groundwater depth:(a)Annual mean runoff through Langxin Mountain vs.groundwater depth at P.euphratica forest experimental site,(b)annual mean runoff through Langxin Mountain vs.groundwater depth at T.chinensis forest experimental site,(c)scatter diagram of annual mean runoff through Langxin Mountain vs.groundwater depth at P.euphratica forest experimental site,and(d)scatter diagram of annual mean runoff through Langxin Mountain vs.groundwater depth at T.chinensis forest experimental site
3.3 The comparison in water budgets at the P.euphratica and T.chinensis forest experimental sites
There were five main types of water-balance components:change in storage,net rainfall,ET,overland flow,and groundwater extraction at the T.chinensis and the P.euphratica forest experimental sites(Figure 7).Water-balance components with a negative value represent water loss from the model system,whereas the positive water-balance components indicate water gain into the model system.In the simulation period,the storage change(∆S=Sfinal-Sinitial)and the annual mean changes in storage were-92 and-100 mm for the T.chinensis and the P.euphratica forest experimental sites,respectively(Figure 7a).The annual mean values of net rainfall were almost equal at the two sites,29 and 28 mm,respectively(Figure 7b).The annual mean soil evaporation of the T.chinensis forest(58 mm)was slightly smaller than that of the P.euphratica forest(64 mm).The annual mean ET of the T.chinensis forest was significantly less than that of the P.euphratica forest.The annual mean ET values of the T.chinensis and the P.euphratica forest sites were 401 and 470 mm,respectively(Figure 7c).The annual mean overland flow values were-0.95 and-0.90 mm for the T.chinensis and the P.euphratica forest sites,respectively.The annual mean groundwater extraction of the T.chinensis forest was less than 14.5%of that of the P.euphratica forest(465 and 544 mm,respectively;Figure 7d).These results indicate that the annual mean water consumption of the T.chinensis riparian forest was less than the water consumption of the P.euphratica riparian forest;the P.euphratica riparian forest has consumed more groundwater than the T.chinensis riparian forest over the past 15 years.
Soil water was a major source of vegetation transpiration,and the change of SWC will have an important effect on vegetation growth.In the desert riparian forest,the change of SWC was affected synthetically by the change of groundwater depth,ET,rain infiltration,and other parameters.Here,the WAVES model simulated the soil-water changes of the T.chinensis forest from 2000 to 2013 and of the P.euphratica forest from 2000 to 2014(Figure 8).The SWC of the T.chinensis forest was clearly higher than that of the P.euphratica forest in the same soil layer.For the T.chinensis forest experimental site,the SWC displayed the expected seasonal change characteristics,especially at the depth of 0-1.2 m,wherein the soil-water content fluctuated substantially,from 5%to 40%.A minimum of soil-water content of 5%-11%appeared in the 1.2-1.5-m soil layer for most of the 14 years studied(Figure 8a).Compared with the SWC of the T.chinensis forest,that of the P.euphratica forest showed more gentle fluctuation in the 0-1.5-m soil profile;and the SWC was clearly lower.In particular,in the 0.3-1.0 m soil layer,the SWC was smaller than 18%from 2000 to 2010,then slightly increased after 2010.These changes indicate that the P.euphratica forest has consumed more soil water than the T.chinensis forest for the Ejina Desert riparian forest over the past years.

Figure 6 The Pearson III frequency curve of annual mean runoff through Langxin Mountain Station
3.4 The effect of groundwater changes on ET,rainfall infiltration,storage,and LAI of the desert riparian forest
The simulated impactsofgroundwater-depth change on ET,rainfall infiltration,and storage under Scenarios 1,2,3,and 4 were compared with the"Reference"for the T.chinensis and the P.euphratica forest experimental sites(Figures 9 and 10).The ET includes soil evaporation and transpiration,In Scenario 1 at the T.chinensis forest experimental site,the soil evaporation was higher than the"Reference"value(Figure 9a1);whereas,the annual mean of soil evaporation was 21.0%larger than the"Reference"value(Figure 9b1).The annual mean of transpiration was 13.3%more than the"Reference"value(Figure 9b2).The annual mean of total ET and canopy interception were 14.4%and 6.4%larger than the"Reference"values,respectively.The annual mean of storage was 5.6%larger than the"Reference"results(Figure 9b5).The results of the WAVES model under Scenario 2 show that the annual means of soil evaporation,transpiration,total ET,canopy interception,and storage were 4.1%,3.0%,3.2%,1.0%,and 1.1%lower than the"Reference"values,respectively.The simulated results under Scenario 3 show that the annual means of soil evaporation,transpiration,total ET,canopy interception,and storage were 22.1%,18.0%,18.6%,5.0%,and 6.6%less than the"Reference"values,respectively.The annual means of soil evaporation,transpiration,total ET,canopy interception,and storage under Scenario 4 were 31.3%,27.3%,27.9%,6.1%,and 10.9%lower than the"Reference"values,respectively(Figure 9).
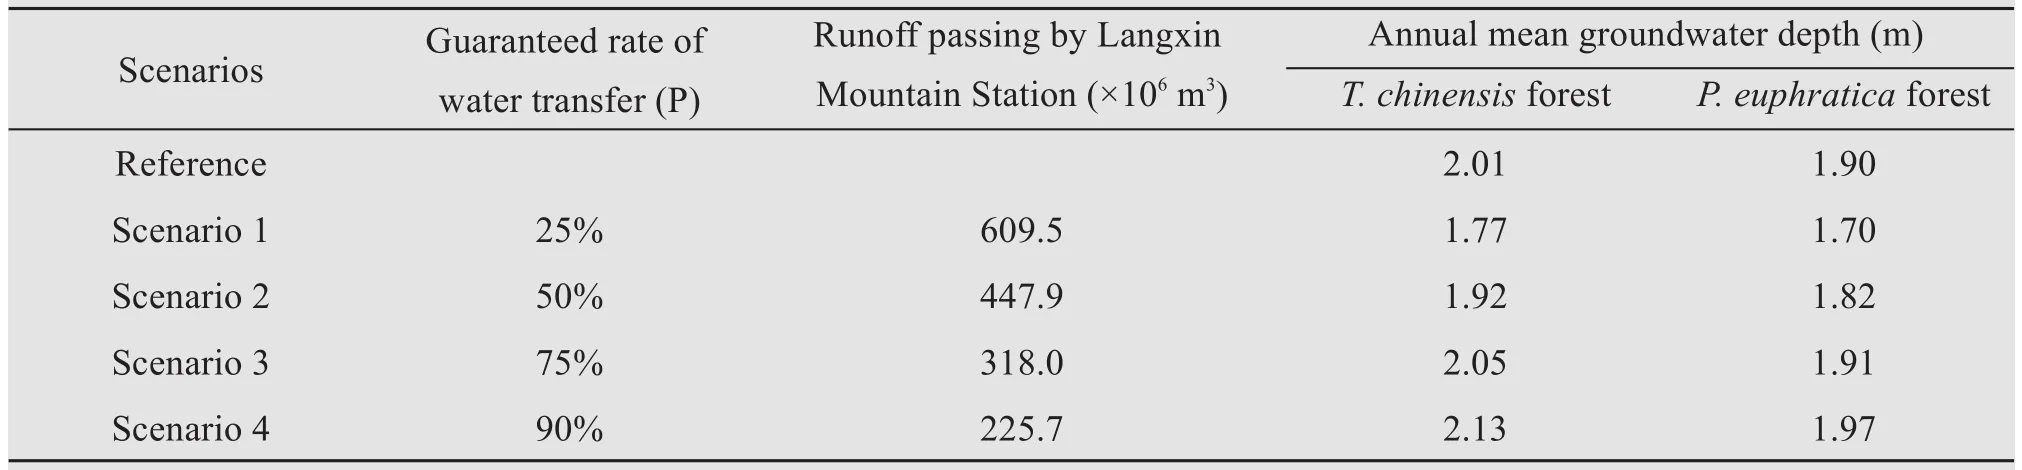
Table 3 Four scenarios of runoff through the Langxin Mountain Station and the mean groundwater depths simulated on two experimental sites under different guaranteed rate of water transfer
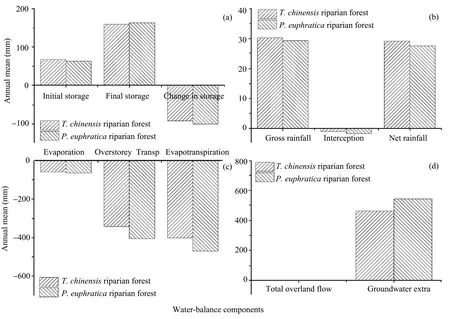
Figure 7 Change and difference in water budgets by comparing the P.euphratica riparian forest with the T.chinensis riparian forest.Water balance of storage(a),water balance of rainfall(b),water balance of ET(c),lateral fluxes and groundwater extraction(d)
The WAVES simulated results and changing trends of water-balance items at the P.euphratica forest experimental site are shown in Figure 10 from 2000 to 2014.The annual means of soil evaporation,transpiration,total ET,canopy interception,and storage under Scenario 1 were 20.6%,19.8%,19.9%,10.3%,and 4.6%larger than the"Reference"values,respectively.The annual means of soil evaporation,transpiration,to-tal ET,canopy interception,and storage under Scenario 2 were nearly equal to the"Reference"values.The annual means of soil evaporation,transpiration,total ET,canopy interception and storage under Scenario 3 were 17.0%,17.0%,16.9%,8.1%,and 5.8%lower than the"Reference"values,respectively;and those of Scenario 4 were 25.2%,26.2%,26.1%,11.9%,and 9.6%lower than the"Reference"values,respectively.
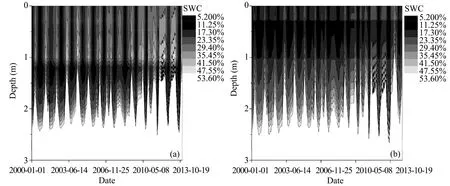
Figure 8 Changes of soil-water content at T.chinensis forest from 2000 to 2013(a)and P.euphratica forest from 2000 to 2014(b)
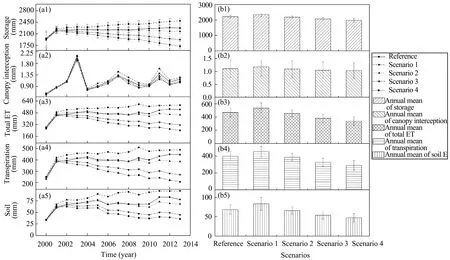
Figure 9 Modeled-effect groundwater changes on ET,rainfall infiltration,and storage at T.chinensis forest experimental site.Time series from 2000 to 2013(a)and annual means(b)
The simulated impactof groundwater-depth change on LAI is shown in Figure 11.The LAI under Scenario 1 was higher than the annual variation of LAI under"Reference".The annual variation of LAI under Scenario 2 was similar to the annual variation of LAI under"Reference".The other annual variation curves of LAI under Scenarios 3 and 4 were clearly lower than the curve of LAI under"Reference"at the T.chinensis forest experimental site(Figure 11a).The annual means of LAI under Scenario 1 was 10.4%larger than the LAI under"Reference"from 2000 to 2013 in the T.chinensis forest experimental site;the annual means of LAI under Scenarios 2,3,and 4 were 1.9%,12.3%,and 18.9%lower than the LAI under"Reference",respectively(Figure 11b).The annual mean of LAI under Scenario 1 was the highest,the second was under"Reference",the third was under Scenario 2,and the lowest was under Scenario 4.Similarly,the annual variation of LAI under Scenario 1 was higher than the annual variation of LAI under"Reference";the annual variation of LAI under Scenario 2 changed consistently with the LAI under"Reference";the other annual variation curves of LAI under Scenarios 3 and 4 were also lower than the curve of LAI under"Reference"at the P.euphratica forest experimental site from 2000 to 2014(Figure 11c).The order of LAI under different scenarios at the P.euphratica forest experimental site was same as the order at the T.chinensis forest experimental site;the annual means of LAI under different scenarios from high to low was Scenario 1,"Reference",Scenario 2,Scenario 3,and Scenario 4(Figure 11d).
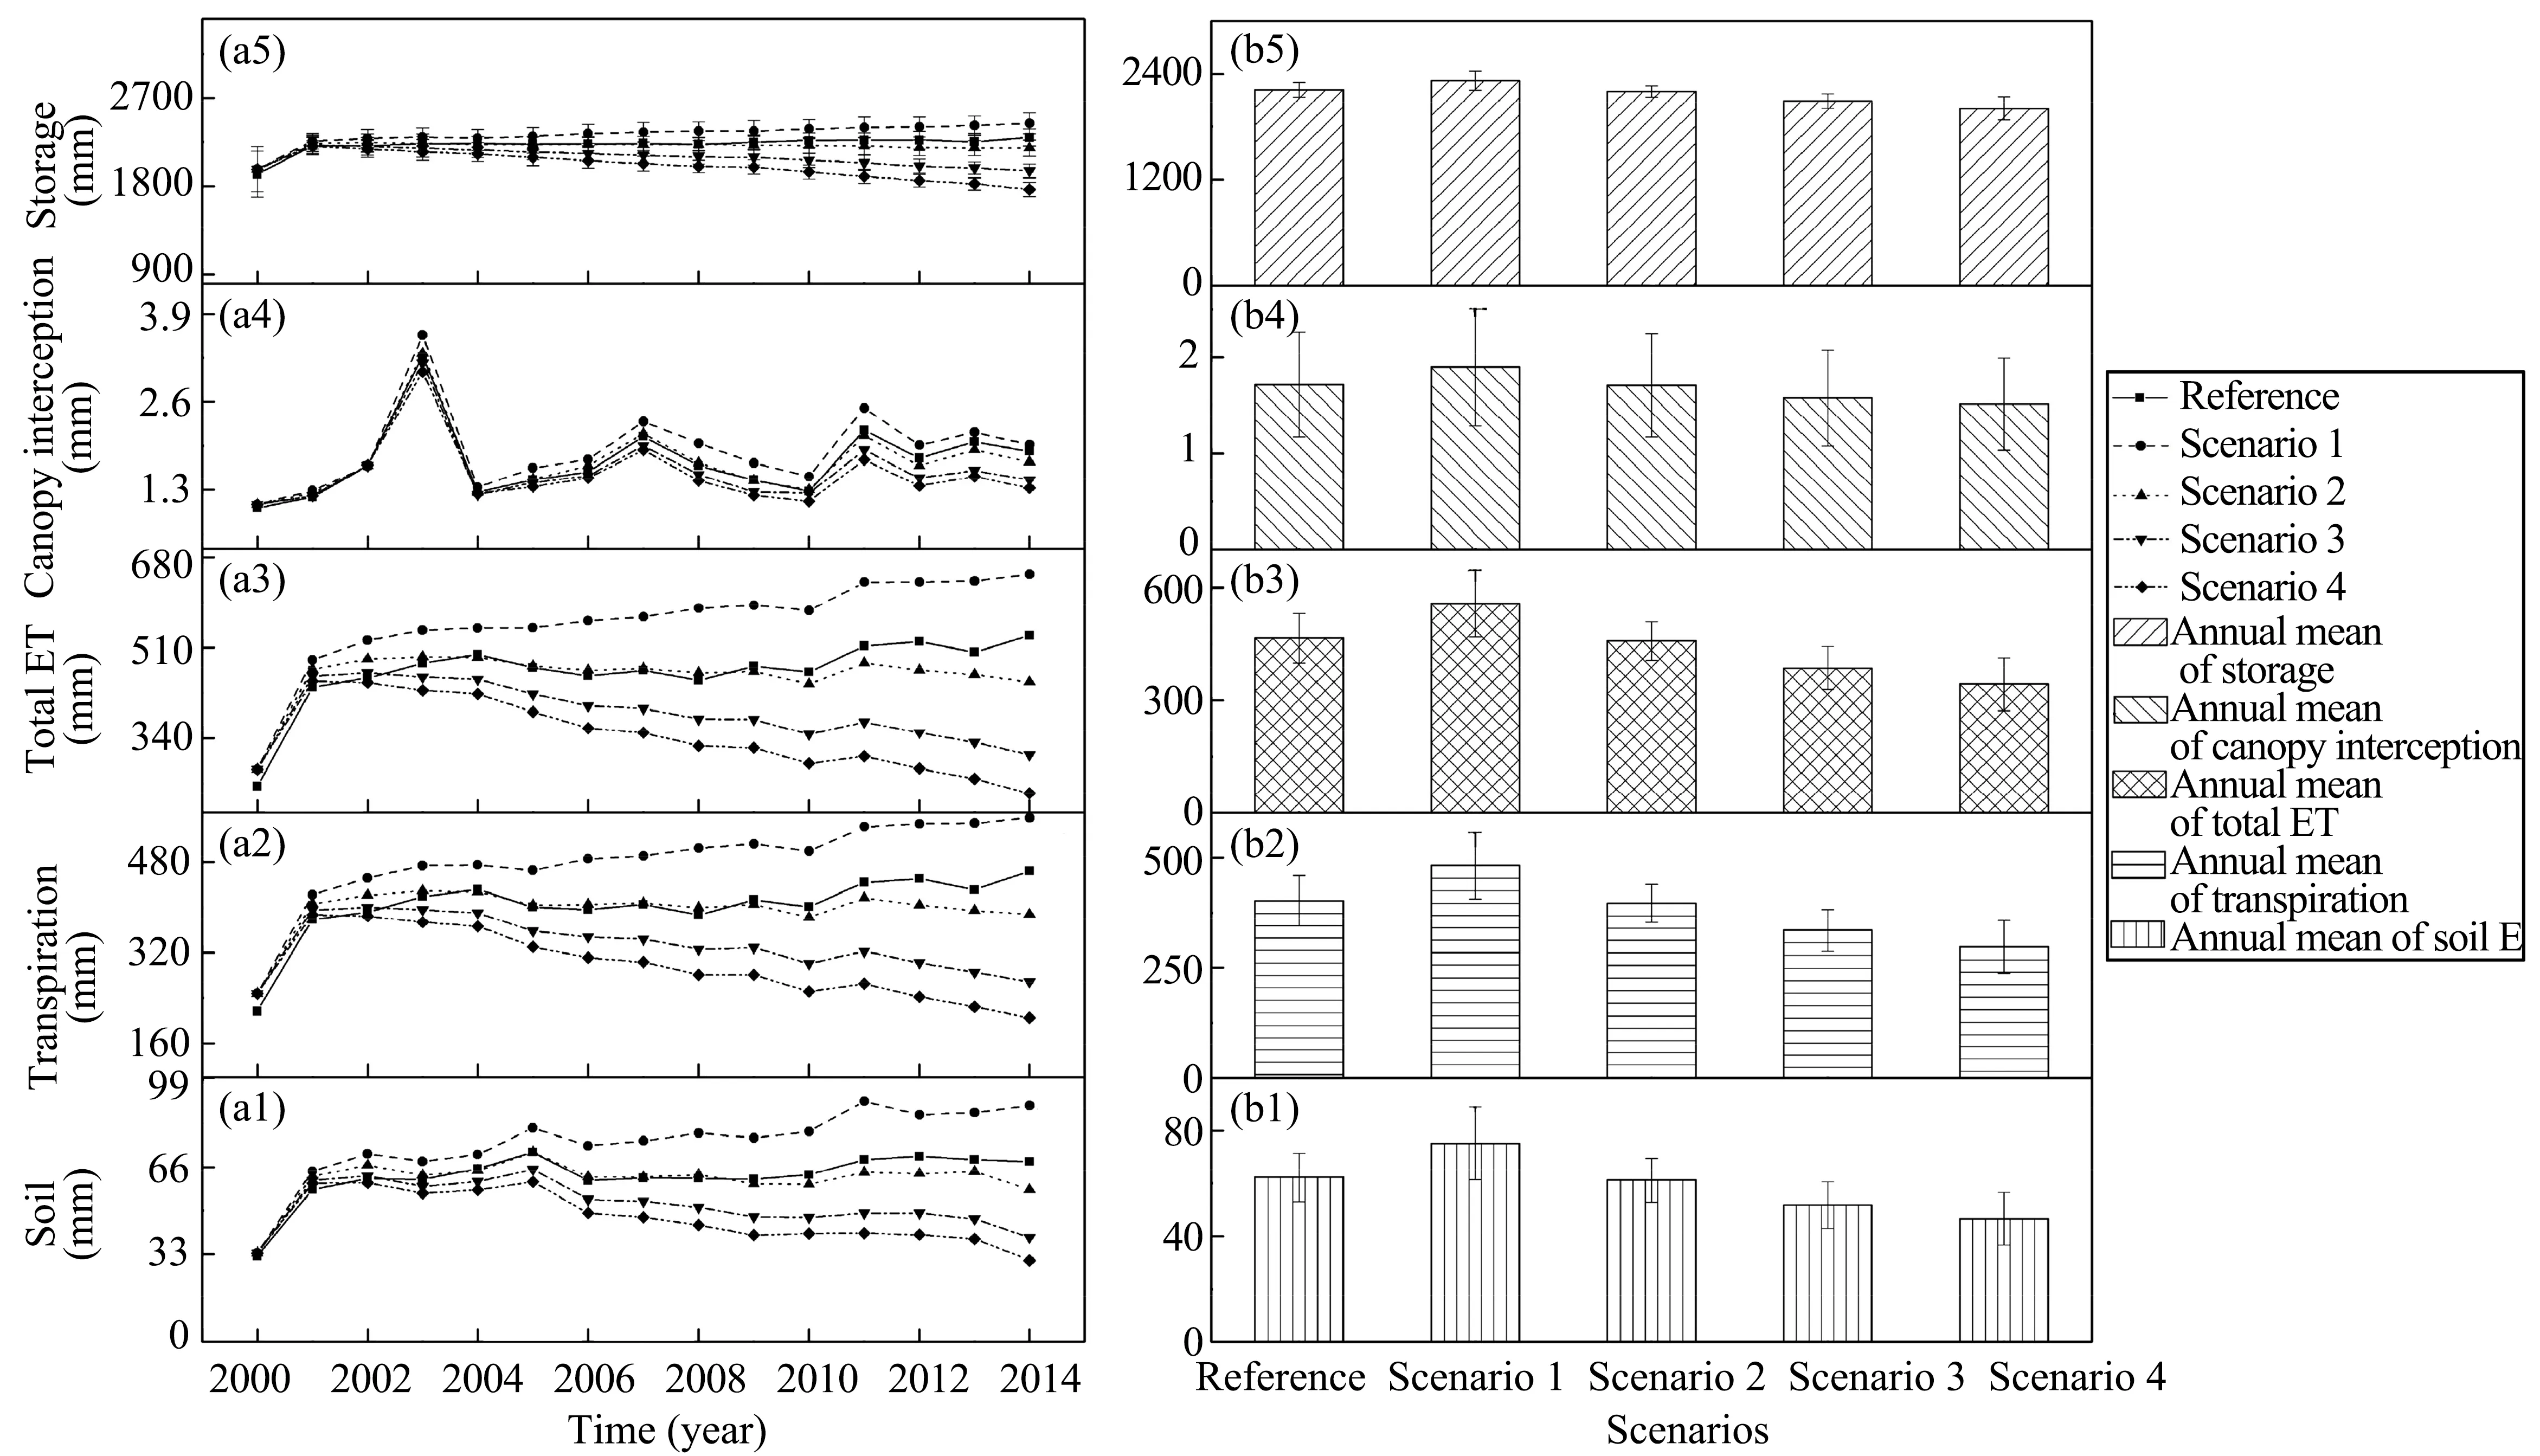
Figure 10 Modeled-effect groundwater changes on ET,rainfall infiltration,and storage at P.euphratica forest experimental site.Annual variations from 2000 to 2014(a)and annual mean variations(b)
4 Discussion
4.1 Plant-growth responses to groundwaterdepth change
The WAVES model predicted a decrease in LAI under groundwater depth in Scenarios 2,3,and 4 for the single canopy at the T.chinensis forest experimental site.The LAI under Scenario 1 was above the"Reference"LAI at the T.chinensis forest experimental site.The annual means of groundwater depth were 1.92 m,2.05 m,and 2.13 m under Scenarios 2,3,and 4,respectively,from 2000 to 2013.The annual means of groundwater depth under Scenarios 3 and 4 were larger than the"Reference"annual mean of observed groundwater depth 2.01 m at the T.chinensis forest experimental site.The predicted LAI under Scenario 1 was larger than the"Reference"at the T.chinensis forest experimental site.The annual mean value of groundwater depth was 1.77 m under Scenario 1,which is less than the"Reference"groundwater depth(2.01 m).The results presented here indicate that the canopy LAI of the T.chinensis riparian forest will reach a maximum when the groundwater depth is about 1.77 m.The canopy LAI of the T.chinensis riparian forest under Scenario 2 most closely matches the LAI under"Reference".
The LAI values under Scenarios 2,3,and 4 were predicted to decrease from 2000 to 2014,as compared with the LAI under"Reference"at the P.euphratica forest experimental site.The annual means of groundwater depth were 1.82 m,1.91 m,and 1.97 m under Scenarios 2,3,and 4,respectively,from 2000 to 2014.The LAI value under Scenario 1 was predicted to increase,as compared with the LAI under"Reference".The annual means of groundwater depth were 1.70 m under Scenario 1.The annual mean observed groundwater depth was 1.90 m at the P.euphratica forest experimental site.The results show that the single-canopy LAI of the P.euphratica riparian forest was the largest when the annual mean of groundwater depth was the least under the four scenarios.
Taken together,our results reveal that the canopy LAI of the desert riparian forest will reach its maximum when groundwater depth fluctuates within a specific range for a certain vegetation and soil pattern.The canopy LAI of the desert riparian forest will increase as the groundwater depth decreases.
Groundwater-level rise can also cause vegetation degeneration by reducing the oxygen levels in soil pores required for the roots to breathe,and lead to changes in capillary rise,thereby affecting plant growth(Hou et al.,2011).This sequence could lead to the succession of vegetation towards swampy vegetation types.Oomes et al.(1996)studied the effects of raising the water level on vegetation change in a wet grassland and indicated that raising the water level resulted in a more rapid establishment of species indicative of wet conditions.Moreover,groundwater-level rise may also lead to soil salinization and then cause associated vegetation decline.Crowley(1994)concluded that the late Quaternary Casuarina decline was caused by a combination of rising groundwater levels and soil salinization in south eastern Australia.Chambel(2006) discussed the relationships between groundwater,soil salinization,and ecosystems in semiarid Mediterranean areas and concluded that some specific plants and trees species resisted rising groundwater level or soil salinization so as to become degenerated.Marohn et al.(2012)found that growth of deep-rooted tree crops can be constrained by ongoing oscillations of the groundwater level and salinity.Therefore,higher water levels will significantly affect the health of native plants.

Figure 11 Effect of groundwater changes on LAI.Annual variations from 2000 to 2013 at T.chinensis forest experimental site(a);annual mean variations at T.chinensis forest experimental site(b);annual variations from 2000 to 2014 at P.euphratica forest experimental site(c);annual mean variations at P.euphratica forest experimental site(d)
In short,groundwater changes under different scenarios significantly influence the canopy vegetation growth for the T.chinensis riparian forest or the P.euphratica riparian forest.The lasting decline of groundwater will lead to vegetation degeneration,and even more severe decline will result in vegetation's changing towards a drought-resistant community pattern.Higher groundwater level could also cause vegetation degeneration and even the trend of the vegetation community succession to Halophytes or Phreatophytes.In this study,the groundwater level under different scenarios was not obviously higher than the vegetation root depth,therefore,LAI always increases with the rise of groundwater level.At the same time,to maintain the current LAI of vegetation,the runoff guaranteed rate through Langxin Mountain should not be more than 50%.
4.2 Shift of water budgets due to groundwater changes
Groundwater changes could significantly influence a shift of water budgets at both riparian forest experimental sites.For the T.chinensis riparian forest,the changes in storage would clearly decrease with the decline of groundwater level(corresponding to Scenarios 2,3,and 4;the relative changes under those scenarios were-7.5%,-26.3%,and-41.4%relative to the"Reference",respectively).For the P.euphratica riparian forest,the relative changes in storage were similar to those in the T.chinensis riparian forest(-8.7%,-26.8%,and-41.5%,respectively).These results indicate that decline of the groundwater level will reduce soil storage.When the runoff guaranteed rate of water transfer that passes through Langxin Mountain is 90%during the periods simulated,the change in storage is reduced by more than 40%in both riparian forest sites.Groundwater-level rises in both riparian forests will increase the soil storage,as shown for Scenario 1.
The results show that groundwater change has little effect on rainfall infiltration for the T.chinensis and the P.euphratica riparian forests(Figure 12).Regardless of the scenario for groundwater-level change,the total ET of the T.chinensis and the P.euphratica canopies all decrease,as compared with the"Reference"results.However,relative changes of total ET in the T.chinensis forest under the same scenarios of groundwater-level decline(Scenarios 2,3,and 4)are larger than in those in the P.euphratica forest,as compared with the results under the"Reference".In contrast,the relative changes in the T.chinensis forest under increased groundwater level(Scenario 1)are lower than in the P.euphratica forest.The results show that the decline of groundwater level was able to reduce the ET of the T.chinensis forest more markedly than that of the P.euphratica forest.Furthermore,the increased groundwater level also could clearly decrease the ET of the P.euphratica forest relative to the T.chinensis forest.The decrease of ET is consistent with the decrease of canopy LAI,which suggests that the T.chinensis forest will appear more severely degenerated than the P.euphratica forest following a sharp decline of groundwater level,it may be due to deeper roots and better adaptability of the P.euphratica forest to the decline of groundwater level.The total ET under Scenario 2 is closer to the value under"Reference"in both riparian forest sites(Figure 12).The results presented here indicate that the T.chinensis and the P.euphratica ET will preserve the status quo when the runoff guaranteed rate of water transfer that passes through Langxin Mountain is 50%.The annual means of total overland flow under different scenarios did not appear to be much different from the one under the"Reference"condition.As the groundwater level declines,the annual means of groundwater extraction would be decreasing,as compared with the value under the"Reference"condition in the T.chinensis and the P.euphratica forest sites under Scenarios 2,3,and 4.The variable amplitudes of groundwater extraction under the same scenarios of groundwater-level decline in the T.chinensis forest are larger than the values in the P.euphratica forest,as compared with the results under the"Reference"condition.Therefore,it can be summarized that the causes of the water-budget change were similar in both the T.chinensis and the P.euphratica forests.It is clear that groundwater change can influence water budgets directly though changes in water availability in arid desert riparian forest and through indirect impacts on plant growth.
Groundwater is also one of the significant drivers thatimpactsoil-waterdynamics and vegetation growth.Groundwater change causes capillary change,which can play an important role in vegetation water use(Jorenush and Sepaskhah,2003)and change the water budget of the vegetation root zone(Ayars et al.,2006).The impacts of groundwater dynamics on plants is complex and difficult to understand completely.Soylu et al.(2014)simulated the influence of groundwater on the plant-water balance at the land surface and concluded that shallow groundwater limited water stress during dry years.If the water level is persistently too close to the surface during the growing season,however,photosynthesis is negatively affected through oxygen stress on root,regardless of the aridity(Soylu et al.,2014).Recent work has suggested that the water balance is highly sensitive to the groundwater level in the root zone(Han et al.,2015).The present study has demonstrated that groundwater is a crucial factor that must be considered when evaluating water-resource management in arid desert riparian forests;groundwater changes show both positive and negative effects on vegetation growth and water budgets in riparian forests.
4.3 The determination of ecological groundwater depth in the desert riparian forest
The distribution of vegetation in the arid region is closely related to groundwater-level depth.Different plant species have different capacities to adapt and respond to changes in the groundwater-level depth(Feng et al.,2012).The main plant species in the Ejina Desert riparian forest include P.euphratica and T.chinensis,the root systems of which are generally distributed within a soil layer of 3 m but are most concentrated in the 2-m topsoil.Annual mean LAI of the T.chinensis forest was predicted to have its optimum(larger than 0.22)when groundwater depth fluctuates between 0.8 and 1.7 m(Figure 13a).It illustrates that 0.8-1.7 m of groundwater depth is the optimal range for growth of the T.chinensis riparian forest.The annual mean LAI ofthe T.chinensis forest changed from 0.17-0.22,as shown in the dashed circle of Figure 13a,corresponding to the annual mean groundwater depth of 1.7-2.7 m.The annual mean LAI of the T.chinensis forest would significantly reduce when the annual mean of the groundwater depth was larger than 2.7 m.Similarly,the optimal annual mean LAI(>0.25)of the P.euphratica forest was predicted when the annual mean groundwater depth was 0.8-1.8 m,as shown in the solid circle of Figure 13b.In the dashed circle in Figure 13b,the groundwater depth is between 1.8 m and 2.6 m.The annual mean LAI of the P.euphratica forest also would greatly decrease when the annual mean of the groundwater is larger than 2.6 m.These results suggest that maintenance of the appropriate groundwater depth will be important to maintain healthy growth of the desert riparian forest.This research suggests that the ecological groundwater depth should be kept in the range 1.7 m to 2.7 m to maintain the normal ecological functions of riparian forests in the Ejina Desert Oasis.These findings are consistent with the conclusions of Feng et al.(2012)from an ecological groundwater-level depth study on the lower reaches of the Heihe River.Hao et al.(2010)assessed the groundwater threshold of desert riparian forest vegetation on the lower reaches of the Tarim River and concluded the optimal groundwater level for major plant growth was 2-4 m.Ma et al.(2011)found that the appropriate groundwater level was less than 4 m for a desert riparian forest along the Lower Tarim River.These results will provide scientific foundation for desert riparian forest restoration and management in an arid inland river basin.
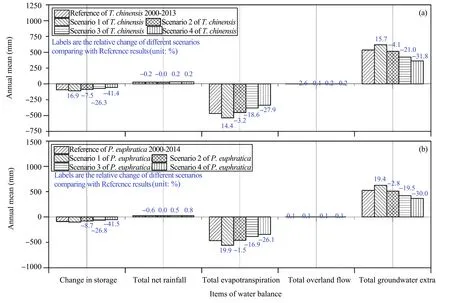
Figure 12 Shift of water budgets due to groundwater changes at T.chinensis forest experimental site(a);and at P.euphratica forest experimental site(b)
5 Conclusion
In this study,impacts of groundwater change on canopy LAI and the water budget were investigated using the ecohydrological model WAVES.Four scenarios of runoff passing through the Langxin Mountain section were chosen to simulate the change of groundwater depths by the groundwater model in the T.chinensis and the P.euphratica riparian forest ecosystems.Then the WAVES model was used to assess effects of groundwater-depth change on ET and LAI under different vegetation patterns.The annual mean water consumption of the T.chinensis riparian forest was less than that of the P.euphratica riparian forest.The response of plants to the groundwater-depth change is clear,and the canopy LAI of the desert riparian forest will increase as the groundwater depth decreases.Groundwater changes significantly influence shifts of water budgets for both types of riparian forest.The decline of groundwater level reduces ET in the T.chinensis forest more markedly than in the P.euphratica forest,and the increasing of groundwater level also can more strongly decrease the ET in the P.euphratica forest than in the T.chinensis forest.The decrease of ET is consistent with the decreasing of canopy LAI,which suggests that the T.chinensis forest will appear more severely degenerated than the P.euphratica forest,corresponding with a sharp decline in groundwater level.Groundwater-depth changes show both positive and negative effects on vegetation growth and water budgets of a riparian forest.Appropriate groundwater depth(1.7-2.8 m)will be important to maintain healthy growth and normal ecological functions of a desert riparian forest in this study area.
Overall,this study has focused on the responses of ecohydrological processes in the desert riparian forest community in arid areas to changes in the shallow riparian groundwater depth.Exploration of the influences of groundwater changes in a desert riparian forest will help us to recognize and maintain the vegetation growth and water-balance dynamics in arid areas into the future.The prediction of dynamic interactions and feedbacks between hydrological and ecological processes may provide guidance for ecological restoration of desert riparian forests and efficient management of water resources in the arid inland Heihe River Basin.
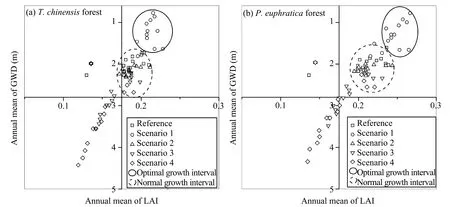
Figure 13 Scatter relationship plot between annual mean of groundwater depth and LAI under different scenarios at T.chinensis forest experimental site(a);and P.euphratica forest experimental site(b)
Acknowledgments:
This research was supported by the National Key Research and Development program(2016YFC0400908),the National Natural Science Foundation of China(Nos.41101026,31370466),and the STS project of Chinese academy of sciences(29Y829731).
 Sciences in Cold and Arid Regions2019年1期
- Sciences in Cold and Arid Regions的其它文章
- Increase in medium-size rainfall events will enhance the C-sequestration capacity of biological soil crusts
- Accumulation and geochemical evidence for the Little Ice Age episode in eastern Antarctica
- Primary investigation of statistical correlation between changes in ice volume and area of glaciers
- Vulnerability and adaptation of an oasis social–ecological system affected by glacier change in an arid region of northwestern China
- The analysis of heat and water fluxes in frozen silty soil
- The changing process and trend of ground temperature around tower foundations of Qinghai-Tibet Power Transmission line