企业环境污染强度研究
蔡慧颖
(日本上智大学 地球环境研究生学院,日本 102-8554)
1 背景介绍
在过去的10年中,中国经济高速发展,远超过经济合作发展机构成员(Organization for Economic Cooperation and Development,OEDC),成为世界第二大经济体[1]。改革开放以来,中国经济已经经历了一个“奇迹发展时期”。在过去的34年,名义GDP增幅甚至达到15.7%,实际GDP增长率达到了9.6%。而与此同时,全球GDP增长率仅2.8%。在1978年,中国经济出口仅排世界第10位。
改革开放初期,中国政府宣布要不惜一切代价大力发展经济[2]。从图1可以看出,30年过后,中国GDP快速增长。2010年,中国取代日本,成为世界第二大经济体。没有任何一个国家能像中国一样,在如此短的时间里有如此大的经济发展。
在20世纪80年代,因为国际经济竞争,全世界国有企业经济发展形势不容乐观[3]。国有企业不佳的经济绩效使得中国不得不寻找提高国有企业经济效率的办法:企业重组、剥离或者破产。随着私有企业的崛起,研究者相信私有企业拥有更好的经济绩效和竞争力。因此,国有企业私有化成了包括中国在内的很多发展中国家发展经济的首选方式。在过去30年中,中国政府为了提高生产力、利润率和竞争力,采取了将部分国有企业私有化,并大力提倡发展私营企业,导致私有企业大量出现,成为了中国最受欢迎的所有制结构[4]。如图2所示。
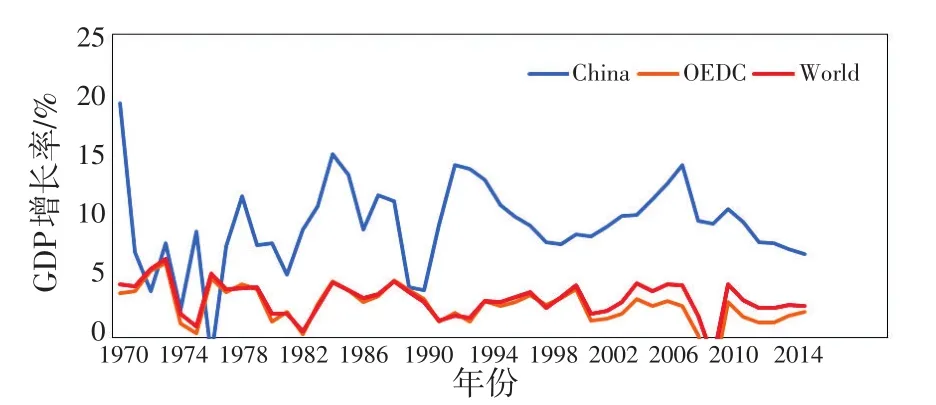
图1 GDP增速对比(1970—2015年)Fig.1 Comparison of GDP growth rate(1970—2015)

图2 中国企业数量(百万)Fig.2 Number of firms in China(in million)
但是,随着工业化和城市化进程的不断加快,中国的环境现状出现了一些新的问题。污染物的长期累积已经对公众健康产生了巨大的影响。环境恶化已经给中国带来了不容忽视的经济损失。中国已经公布了包括环境税在内的各项治理空气和水污染的法律法规,加大了环境保护的执法力度。
在中国,国有企业规模一般较大,而私有企业更多的是中小企业。因此,探究国有企业和私有企业对环境的承受能力从某种角度来说就是探讨大型企业和中小企业对环境的承受能力。Wang和Wheeler在2003年建立了关于大型国有企业和环境绩效关系的模型[5],并表明国有企业相对于中小型私营企业对环境污染的影响更大。但是国有企业因为资金雄厚、有政府支持,环境承受力可能相对较强。相反,中小企业因规模较小、投资环境治理的能力有限,再加上中小企业习惯了“搭便车”(free rides),因此,它们的环境污染承受力可能较弱。基于上述讨论,笔者从国有企业和私有企业对环境的影响来探讨中国不同企业的环境承受能力。
2 数据与模型
本文数据均来自《中国统计年鉴》(2007—2015)和国家统计局,覆盖31个省(自治区/直辖市)(北京、天津、河北、山西、内蒙古、辽宁、吉林、黑龙江、上海、江苏、浙江、江西、安徽、福建、山东、河南、湖北、湖南、广东、广西、海南、重庆、四川、贵州、云南、西藏、陕西、甘肃、青海、宁夏和新疆),包含248个观测数据和2006—2014年共计31个横截面的面板数据。
笔者选择Wang和Wheeler在1999年所建立的公式,建立“三废”(工业废气、工业废水和工业固体废弃物)指标[6]来衡量企业污染指标:

其次,笔者运用Wang和Wheeler在2003年提出的方法,通过收集31个省份国有企业和私有企业的年产值来衡量企业规模。为了得到更准确的模型结果,还将引入以下控制变量(这些变量同时影响污染指标和企业规模):(1)人均GDP,(2)城市化程度(各省份城市人口比例),(3)交通情况(铁路、高速和水路乘客占各省份总人口的比例),(4)科技水平(各省份专利数)。
根据上述讨论,建立以下双向固定效应模型:

式中:ln(PI)it表示污染强度在时间t=1,2,3,…,9和地区i=1,2,3,…,31上的自然对数;lnSOEsit和lnPOEsit表示国有企业和私有企业在时间t=1,2,3,…,9和地区i=1,2,3,…,31上的工业生产总值;γ表示包括人均GDP、城市化程度、交通情况和科技水平在内的4个控制变量向量;εit表示各变量的残差。还建立了包含滞后项的动态模型:

3 结果与讨论
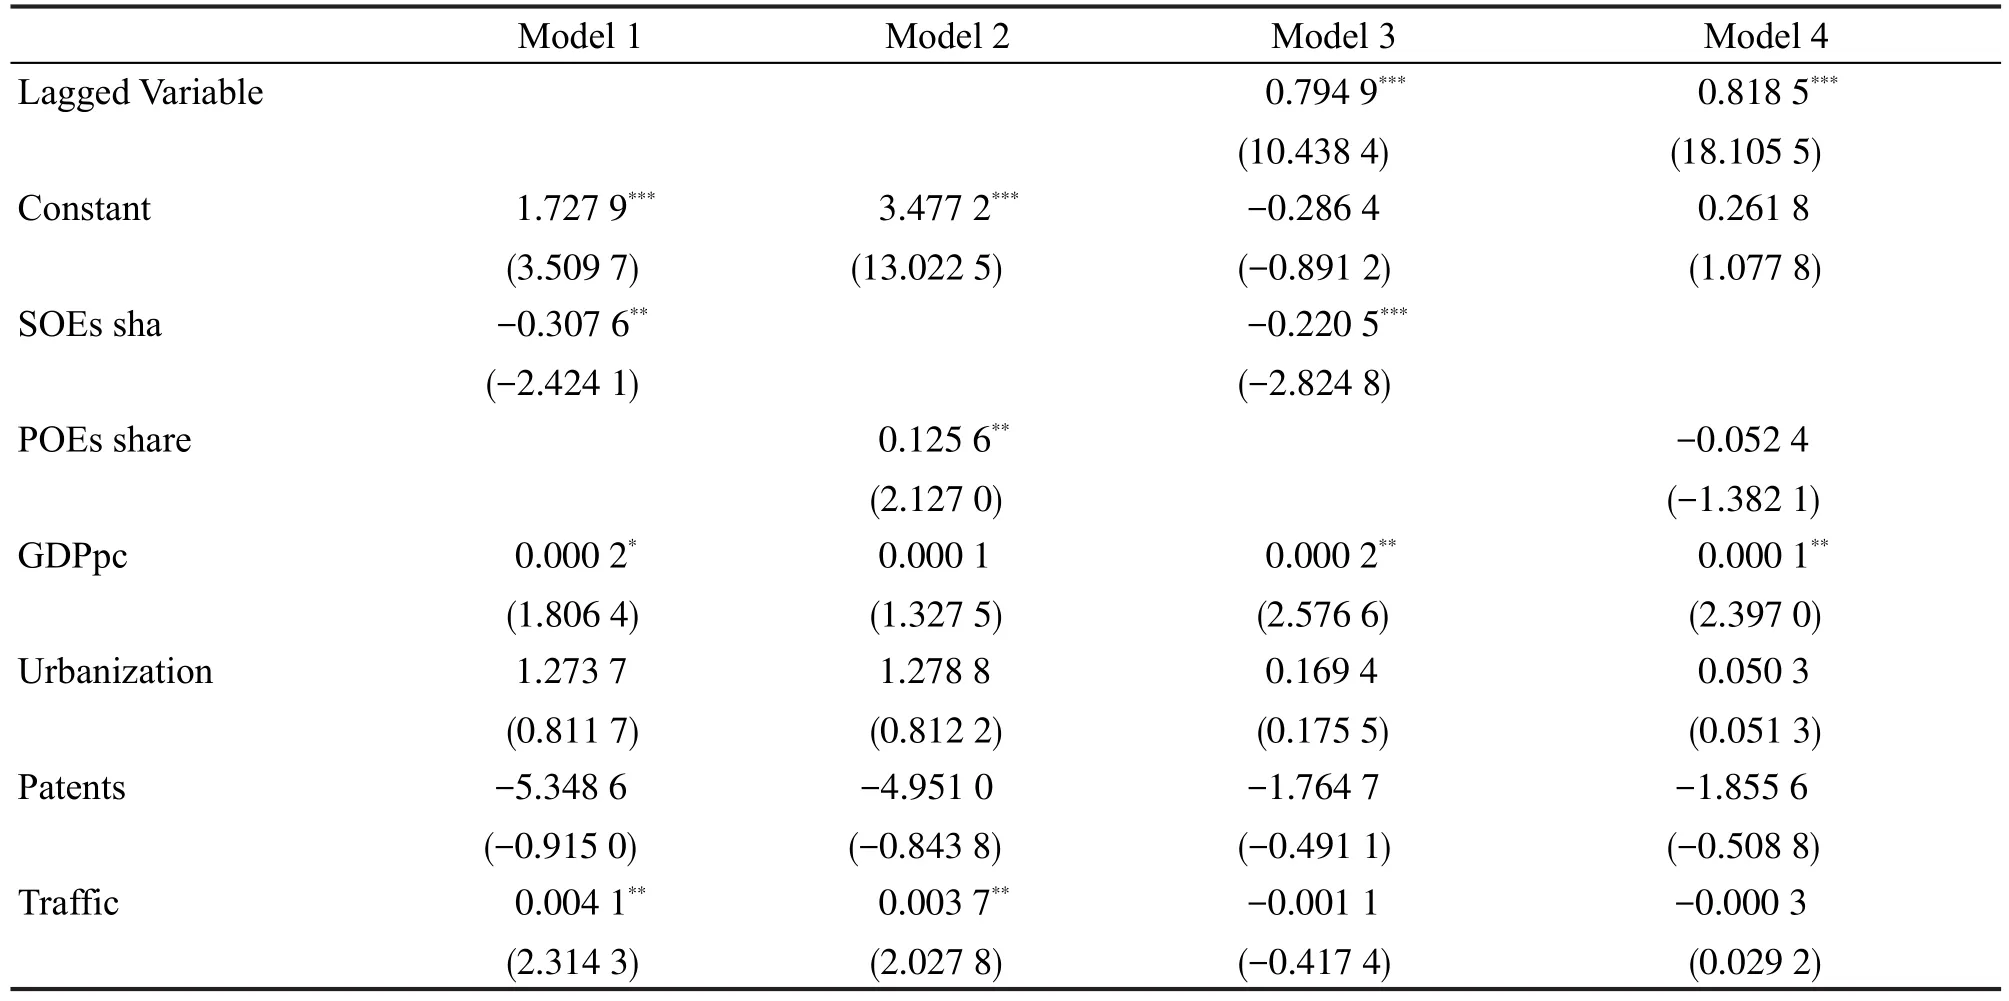
运用Eviews 9.0软件建立双向固定效应模型得出国有企业和私有企业的污染强度,结果见表1。
根据表1的结果可以发现,国有企业工业产出在模型1中显著(-0.307 6),意味着大型国有企业每增加百分之一的产出将会导致0.3%的污染强度的减少。同样,模型3也证实了大型企业和污染强度的负相关关系。这表明国家对国有企业施加的压力迫使国有企业更加关注环境污染问题。另外,模型2中,中小私有企业工业产出在5%显著水平上显著(0.125 6),意味着中小企业每增加百分之一的产出将会直接导致0.18%的污染强度增加。大多私有企业以营利为目的,治理环境污染的成本与投入使得它们不愿意在现有阶段加大环境治理。但加入了滞后变量的模型4中,私有中小企业工业产出变量并不显著,潜在原因可能是因为中小私有企业对环境污染的影响无法在短时间体现。
4 结论
本文采用中国31个省(自治区/直辖市)的面板数据,建立了从2006年到2014年的双向固定因素模型,来探讨国企和私有企业对环境的影响力,进而探讨中国不同企业规模对环境的影响力。从结果来看,目前在中国,大型国企促进环境保护而中小私营企业对环境污染有较大影响。规模较大的国有企业,资金相对充足,更加注重社会责任与经济共同发展,因此会相对严格地执行国家环境政策、严控废物排放;而中小私有企业更加追求利润,较弱的资金背景让它们在考虑利润最大化的同时很难兼顾环境保护。如今,中国中小企业发展迅速,国家政策逐渐完善,如何加强中小企业环保意识值得探讨。中小企业是国家产业的重要组成部分,可以在行业内成立产业链或者企业集群来共同面对环境问题,在某种程度上促进中小企业对环境保护的作用。
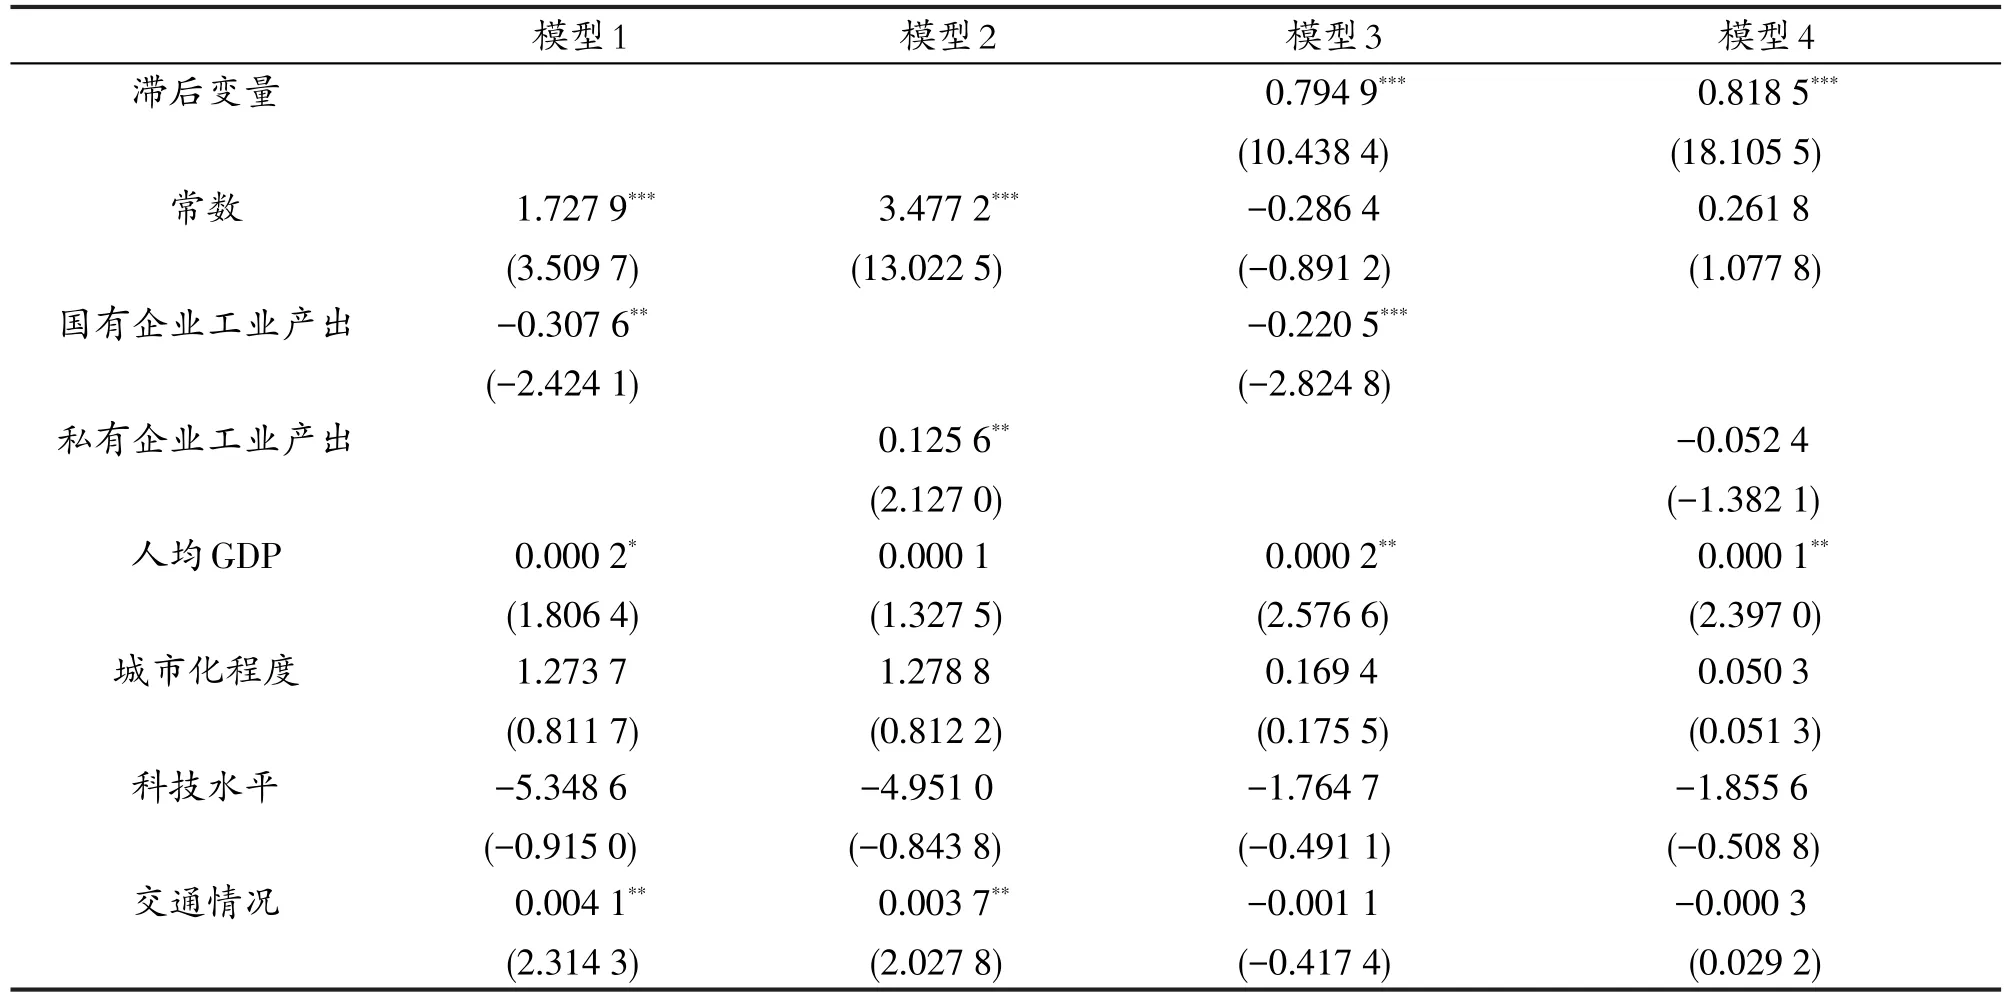
表1 污染强度模型结果Tab.1 Results of pollution intensity models
1.Introduction
Over the last decade,China has witnessed a rapid economic growth rate,far beyond that of(Organization for Economic Cooperation and Development,OECD)members,and is assumed to be the largest economy in the world[1].It can be seen from Figure 1 that since Reform and Opening-up,China's economic growth has experienced a“miracle period”.In the past 34 years,the nominal annual GDP growth rate even reached 15.7%and real GDP growth rate has reached 9.6%.Yet,the average GDP growth rate in the globe was only 2.8%over the same period(World Bank Open Database).In 1978,China's economic outputs ranked only at the tenth in the world while after 30 years,in 2008,China's GDP surpassed Germany's to rank at the third in the world.In 2010,China took Japan's place to become the second largest economy in the globe.There is no other country in the world which has achieved such substantial economic growth in such a short period of time.
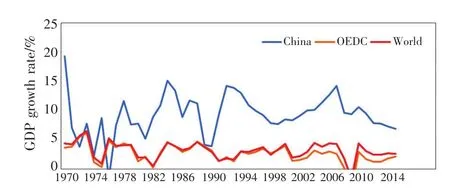
Fig.1 Comparison of GDP growth rate(1970-2015)
At the beginning of the Reform and Open-up,Chinese government stated to pursue a high economic growth at any cost[2].However,the economic performance of state-owned enterprises(SOEs)deteriorated over the world in 1980s because of the fierce international competitiveness[3].The poor economic performance of SOEs motivates Chinese government to explore other methods to promote economic growth.There are three ways that have been issued to improve economic efficiency of SOEs:corporation and re-structuring,divestiture,and bankruptcy.With the belief that private enterprises have better economic performance and better competitiveness than public sectors,privatization has emerged in most disadvantageous countries including China to boost their economic growth.Over the past decades,in order to improve competitiveness,boost profits and enhance productivities,China has witnessed privatization[4],with the result of the diminishing presence of SOEs,which can be observed in the Fig.2.After 1998,due to“privatization Chinese style”,the number of privateowned enterprises(POEs)surpassed that of SOEs approximately 2002,and thus POEs became the most popular ownership structure in China.Then,the number of POEs increased considerably and had as more than ten times as that of SOEs in 2010.
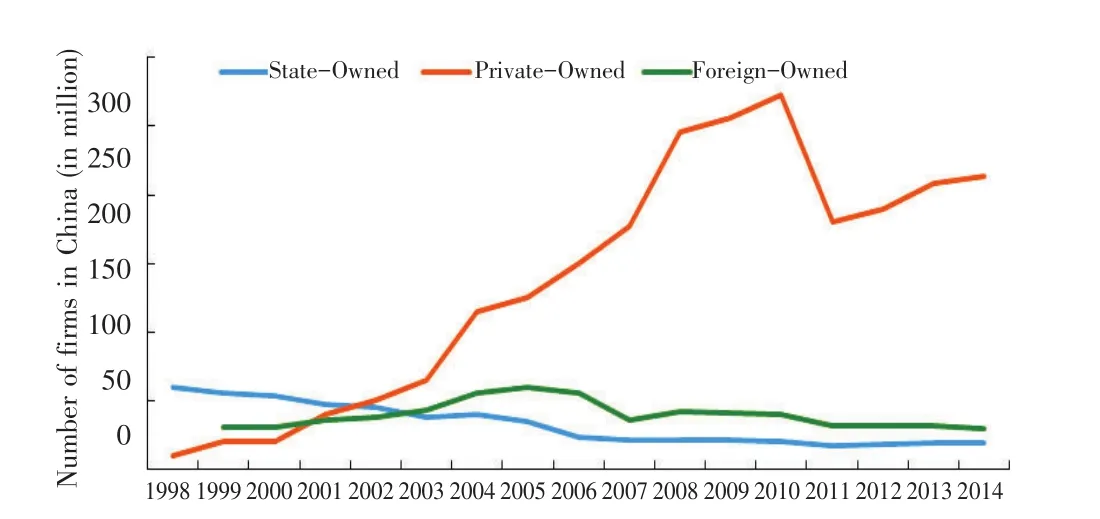
Fig.2 Number of firms in China(in million)
The changes in the number of SOEs and POEs also bring to changes in the industrial outputs of SOEs and POEs.For instance,more large-scale SOEs exist in the most developed cities with severe pollution problems,such as Beijing and Shanghai,than other regions while more relatively small-scale POEs are seen in coastal regions,such as Zhejiang and Guangdong[5].Apart from the differences in the distribution of various types of corporate ownership structures,conditions such as GDP per capita,levels of private sectors as well as openness to foreign sectors,also show the uneven economic development across China.
But with the process of industrialization and urbanization,environmental situation in China has become more and more complex,and the long-term effects of accumulated pollutant have posed a tremendous threat to the public health.The past 30 years has not only witnessed the Golden Ages for China's rapid economic growth,but also marked the threshold of high resource consumption and serious environmental pollution.The effects brought by environmental deterioration have resulted in a huge economic loss forChina.Chinesegovernmentareestimated to spend approximately 3 to 10 percent of national income on tackling environmental pollution every year.China has issued various laws to deal with air and water pollution in recent years,and pollution management has become the top priority in government agenda[6].Although numerous pollution control regulations,such as Pollution Discharge Levy Law,have been issued in 1990s in China,enterprises still have no incentives to control their pollution.Apart from that,the current situation in China also makes environmental regulations less effective than in other countries[7].
The relationship between industrial corporate ownership structures and their environmental performance is still unconducive.Wang and Wheeler in 2003 constructed a model to figure out the relationship between the outputs of large state-owned enterprises and environment,revealing that corporates under state's control polluted much more than private sectors[8].Also,in 2012,some scholars argued that size of enterprises was an essential determinant in terms of corporate's environmental performance[9].The increased privatizations in Chinese corporates have led to the increasing number of small-and medium-enterprises[10].With the depth of development policy for SMEs in China,this study is likely to give SMEs the suggestions for their future environmental development.
2 Data and Models
All data used in this study come from China Statistical Yearbook(2007—2015)and National Bureau of Statistics of the People's Republic of China.The testing period in this study is from 2006 to 2014,covering the main 31 administrative regions in China(Beijing,Tianjin,Hebei,Shanxi,Inner Mongolia,Liaoning,Jilin,Heilongjiang,Shanghai,Jiangsu,Zhejiang,Anhui,Fujian,Jiangxi,Shandong,Henan,Hubei,Hunan,Guangdong,Guangxi,Hainan,Chongqing,Sichuan,Guizhou,Yunnan,Tibet,Shaanxi,Gansu,Qinghai,Ningxia,Xinjiang).All data selected are strongly balanced.In the sum,there are 248 observations and 31 cross-sections in the panel data from year 2006 to 2014.
Some scholars claim that it is inappropriate to discuss environmental affordability by measuring the current environmental performance.Therefore,this study introduces the method proposed Wang and Wheeler in 1999 to consider“three wastes” (industrial waste gases,industrial waste water and industrial solid wastes)into one pollutant index by employing pollution intensity to measure the gross industrial pollution[11].

The pollution intensity includes main industrial pollutant to measure its environmental effects,and this study puts“three waste”together to figure out the clear correlation between corporate ownership structures and environmental pollution.
The essential task in this study is to study environmental effects of different corporate ownership structures at different scales.It is unreasonable to simply use the total volume of SOEs and POEs industrial outputs in a region directly because of the different pollution levies and regulations among these three corporate ownerships in China[12].For instance,in 1997,Pargal and Hettige found the evidence that in most Asian countries,SOEs resisted regulations more successfully than POEs[13].What's more,SOEs are more likely to generate more pollutant per unit of output due to their inefficiency in utilization.As such,the study controls these unexpected influences by introducing the method of Wang and Wheeler that applies the provincial share of productions in SOEs and POEs[13].More specifically,using the volume of SOEs,POEs,and FOEs divided by the total industrial outputs in a provincial level,respectively.
When considering the provincial data in China,it is crucial to acknowledge the huge regional differences among these 31 administrative regions.In or-der to recognize the corporate ownership structure effects and eliminate internal correlations among different provinces,it is significant to recognize control variables that tend to be related to both industrial ownerships and environment pollution.
2.1 GDP per capita
GDP per capita is a perfect representative to measure the level of development in one region.China is the country that has huge economic differences across regions.It seems that higher GDP are always found in the regions where have more private sectors[14].So in the model,GDP per capita should be included as a control variable,as it is not only related to the volume output of industries but also to corporate ownership structures.
2.2 Level of Urbanization
Urbanization has a great impact on industrial waste gas emissions,and one percentage rises in urbanization rates(the number of non-agriculture population in one area divided by the total number of residences in this area)will lead to more than one percentage increased in industrial waste gas emissions.Therefore,this study controls the level of urbanization by introducing the percentage of urban population as it is a popular and proper measurement to estimate the level of urbanization.
2.3 Traffic Situation
Exhausted emissions from urban traffic have become one of the major threats to air quality in China.From the research[15],corporate ownerships may have some relations to transportation.POEs are likely to reduce their operating costs and maximize their profits,thus wanting to seek methods to reduce their transport costs,such as planning a good transportation route to reduce petrol costs.The traffic control variable is estimated by using the number of passenger in railways,highways and waterways,divided by the total population in the specific regions to remove the size effect of population.
2.4 Level of Technology
Wang and Wheeler point out that“state-owned plants may simply generate more waste residuals per unit of output because these plants are less efficient”[16].The level of technology estimates the equivalent level of development,income and foreign direct investment in the region[17].The empirical study conducted by Watson,Jonstone and Hascic in 2009 introduced the number of patents granted as a proxy to measure the scale of technology[18].It is an appropriate measurement for China where the technological statistical data are not transparent enough owing to the number of patent applications reported insufficiently in databases.
Based on the above analysis and tests,this study specifies the equations of estimating pollution intensity as follows:

Here Models(1)and(2)are two-way fixed effects models,whereΔis the first difference,andln(PI)it is the natural logarithm of pollution intensity across time(t=1,2,3,…,9)and regions(i=1,2,3,…,31).lnSOEsitandlnPOEsitare industrial output shares of SOEs and POEs in natural logarithms form in regioni(i=1,2,3,…,31)from periodt(t=1,2,3,…,9).γis a vector of all control variables,including GDP per capita(GDPpc),percentage of urban population(Urbanization),patents granted per capita(Patents)and traffic per capita(Traffic),in regioni(i=1,2,3,…,31)and timet(t=1,2,3,…,9).εitis the unobservable disturbance that is unexplained by variables.
Besides,this study also develops dynamic models by introducing a lagged variable,ln(PI)it-1.Including lagged dependent variables can reduce the occurrence of autocorrelation,so helps us to defend the existence of autocorrelation in the model.The adjusted models of(1)and(2)which include one-year lagged variable have the form of

3 Results
This section gives the results of the four models provided in the previous section.Table 1 represents the results of model 1,2,3 and 4 by employing time-and city-fixed effects method,and model 3 and 4 are dynamic two-way fixed effects models.
Tab.1 Results of pollution intensity models
From the table,SOEs share is significant at confidence level 5%in non-dynamic model 1 and its coefficient is negative at-0.307 6,indicating the larger share of SOEs leads to the lower level of pollution intensity.That is,one-percent increase in share of SOEs would lead to about 0.3%decrease in environmental pollution intensity,provided other variables kept at constant.Not surprisingly,in model 3,the dynamic counterpart of model 1,SOEs is also statistically significant and presents a negative relationship with environmental pollution.Taking together,these two models present that the larger output share of state-owned enterprises has positive effects on environment in China.
With respect to the independent variables,POEs share is significant in model 2 and 4,suggesting that one-percent increase in the output share in POEs is associated with 0.12%increase and 0.18%decrease respectively in pollution intensity.This result implies that the larger output share of POEs would give rise to the larger pollution intensity.Results here document that output of POEs deteriorates to the environment.
Despite the fact that remaining control variables are not the central topics in this study,they should also be noted.In all models(exclude model 2),GDP per capital(GDPpc)is significant and has positively related to pollution.On the other hand,the volume of passenger per capita(Traffic)is significant in model 1 and 2 and directly related to pollution intensity.
The adding of lagged dependent variable may reduce the sample size effects,and it is still arguable whether lagged dependent variables should be added in fixed-effect models.Because of the time lag in economic operation,it is statistically reasonable to add lagged variables on the right of model.After adding lagged variables,all of them are significant at 1%confidence level,and have positive relationship with pollution intensity.The coefficients of lagged variables are positive,which are 0.7949 and 0.8185 respectively.This result is surprising at first glance,but the positive effects in all lagged variables can be explained as the failure of governments'environmental policies,and all of SOEs and POEs are potentially put more pressures on environmental situation in China in the long haul.Furthermore,SOEs share in model 3 is negatively correlated with pollution intensity,which suggests one-percent increase in output share of SOEs would have 0.2%decrease in pollution intensity.This negative relationship between SOEs share and pollution intensity indicates that SOEs still have beneficial effects on the environment.Nevertheless,similar tendency is also observed for POEs in model 4.The reason for this phenomenon could be that the effects tof POEs on environment are unable to be observed in a short time.
4 Conclusions
Distinct from the previous works,this study investigates environmental impacts of different industrial ownerships at the provincial level in China.With a database of 31 provinces from the year 2006 to 2014,this study finds that privately owned enterprises lack the incentive to reduce their emissions of pollutants.This is mostly related to the short-sighted decisions of privately owned enterprises when pursuing economic profits.
Additional implications are observed from the findings.Firstly,there is a necessity for managers in private firms to improve their engagement in environmental protection.The stakeholders'engagement in a small company has been regarded as the most essential contributor to corporate social responsibility[18].Policies that can push stakeholders to lean towards more environmentally-friendly practices should be developed.Secondly,since most private sectors mostly lack financial resources and environmental management involving large-scale investments,government policies which give rewards or incentives for private firms may be considered.Finally,as previously discussed,because the small private sectors often have limited resources,encouraging private sectors to cooperate with state enterprises to form private-public partnership is one method to help them seek for more resources.
There are currently no accurate studies done undoubtedly.The methods used and the data gathered in this study are limited in some aspects.One limitation of the models is their control variables.It should be noted that only the GDP per capita,level of urbanization,level of technology,and traffic situation are employed as the main control variables.However,these four factors do not represent all control variables in the real world.In 1994,Grossman and Krueger figured out the relationship between squared GDP per capita and environmental pollution,which they referred to as the Environmental Kuznets Curve(EKC),implying that squared GDP per capita might also be an option of the control variable in the model[19].It is,however,of great importance to realize that some scholars believe that there is no relationship between economic growth and environmental pollution in China,and thus they do not think that there exists an EKC in the country[20].It is because of this controversy that the squared GDP per capita is not included in the models used in this study.
Furthermore,Dasgupta and Wheeler in 1996 figured out the potential relationship between human capital and environmental pollution.Specifically,they found that higher levels of education had positive impactson environmentalimprovement.Areaswith higher educational levels(less illiteracy rates)were more easily aware of and responded more quickly to environmental problems.Additionally,corporate ownership structures have been shown to be positively related to human capitals.For instance,SOEs and FOEs have more skilled workers than POEs since SOEs and FOEs tend to have higher salaries and welfares for their employees in developing countries[5].Since human capitals may be a potential variable,it is logical to be taken into account in the models.However,because there is no known standard proxy to accurately measure the level of human capitals in China and there exists missing data in some provinces,human capitals is ignored in this study.
Results from this study are useful to explain the current corporate ownership structure and environmental performance in China.However,there are still questions left unanswered.For one,this study has discussed the social responsibility of state-owned enterprises but what we do not know at this stage is how the social responsibilities of these public enterprises work in real world.Furthermore,the different proxies for environmental pollution in China lead enterprises to have different reflections in environmental pollution.As firms under different ownership structures face different financial difficulties,they may choose various indexes to accurately measure environmental pollution and set targets accordingly.Thus,further research should be conducted in order to eradicate the importance for firms to comply to different environmental measures,especially for those in the private sectors as they usually face difficult economic constraints and generally have poor choices when it comes to environmental pollution.

