
Comparison of two classification methods to identify grain size fractions of aeolian sediment
2018-10-31 11:50YanZaiWangYongQiuWuMeiHuiPanRuiJieLu
YanZai Wang , YongQiu Wu , MeiHui Pan , RuiJie Lu
1. College of Geography and Tourism, Chongqing Normal University, Chongqing 401331, China
2. State Key Laboratory of Earth Surface Process and Resource Ecology, Beijing Normal University, Beijing 100875,China
3. Engineering Center of Desertification and Blown-Sand Control, Ministry of Education, Beijing Normal University,Beijing 100875, China
4. College of Geography and Environment Science, Northwest Normal University, Lanzhou, Gansu 730070, China
ABSTRACT Grain-size class-Std (GSCStd) and Grain-size class-dD (GSCdD) methods are simple statistical approaches for classifying bulk grain-size distributions (GSDs) into grain-size fractions. Although these two methods were developed based on similar statistical principles, the classification difference between these two methods has not been analyzed. In this study, GSCStd and GSCdD methods are conducted in thirteen grain-size data sequences to examine the applicability for identifying grain size fractions. Results show that, application of the GSCStd method is equivalent to that of the GSCdD method in identifying finer grain-size fractions, and the difference between the two methods mainly comes from the identification of coarse grain-size fractions. Thus, finer grain-size fractions are recommended for use in research of surface aeolian and paleo-aeolian sediments. In addition, our results do not completely agree with previous studies, coarser grain-size fractions in our case suggest that the GSCdD method may not be more applicable than the GSCStd method.
Keywords: Grain-size class-Std method; Grain-size class-dD method; grain-size fractions
1 Introduction
The change of grain-size distribution of aeolian sediment can be considered a proxy of depositional modification, which can help us investigate sediment provenance and depositional processes (Duet al.,2009; Heet al., 2009; Liaoet al., 2010; Roskinet al.,2014; Liuet al., 2016). Therefore, the classification of aeolian sediment is crucial for aeolian research to examine the change of grain-size distribution.
Two simple approaches were introduced to classify bulk grain size distributions into different grain size fractions, of which the content can be adopted to investigate the change of grain size distribution along a grain size data sequence. The GSCStd method is a typical approach (Guanet al., 2010; Liuet al., 2016)where grain size fractions can be identified by analyzing the standard deviation (Std) of each grain-size class for a grain size data sequence. In recent years,the GSCStd method was widely used in research of paleo-climate and surface aeolian sediment in Northwest China (Xuet al., 2006, 2007; Longet al., 2007;Xue and Zhang, 2008; Huanget al., 2009; Guanet al.,2010, 2013; Niuet al., 2010; Maet al., 2012; Liuet al., 2013, 2016). The GSCdD method is another classification approach, recently introduced by Nottebaumet al. (2014), where deciles difference (dD:D90–D10) instead of standard deviation (Std) was recommended for identifying grain size fractions.Moreover, Nottebaumet al. (2014) noted that the application of dD is better than that of Std in identifying grain-size fractions. However, scarce research has been done to compare the differences between GSCStd and GSCdD, and it is uncertain which method is more applicable in identification of grain size fractions. In this study, both GSCStd and GSCdD methods are applied to the same grain size data set. The purpose of this study is to compare the difference between GSCStd and GSCdD, so as to examine the applicability of the two methods for identification of grain size fractions.
2 Material and methods
2.1 Material
2.1.1 Grain-size data sequences of surface sediment
Ten grain-size data sequences were collected from ground surface of ten different transects (Figure 1a).These transects are located in the shifting dune field of Taklimakan Desert, Northwestern China. Each transect is perpendicular to the desert highway and over the shelter system of the desert highway.
Figure 1a is the location of sampling transect.Samples were collected from ground surface, and the data has been published in Wanget al. (2009) and Wang (2013). Figure 1b is the location of sampling section. Samples were collected from paleo-aeolian section, and data of sections XL and JJ are published in Panet al. (2014), data of section SDG is published in Luet al. (2010).
In this study, each transect is named after its location milestone of the desert highway,e.g., TK-K134 is located at the milestone of 134 km. For most transects, due to the long distance between each other,sediment provenance is also different from each other(Zhuet al., 2013). Also, for different transects there are different amounts of sand samples, ranging from 15 to 49 samples.
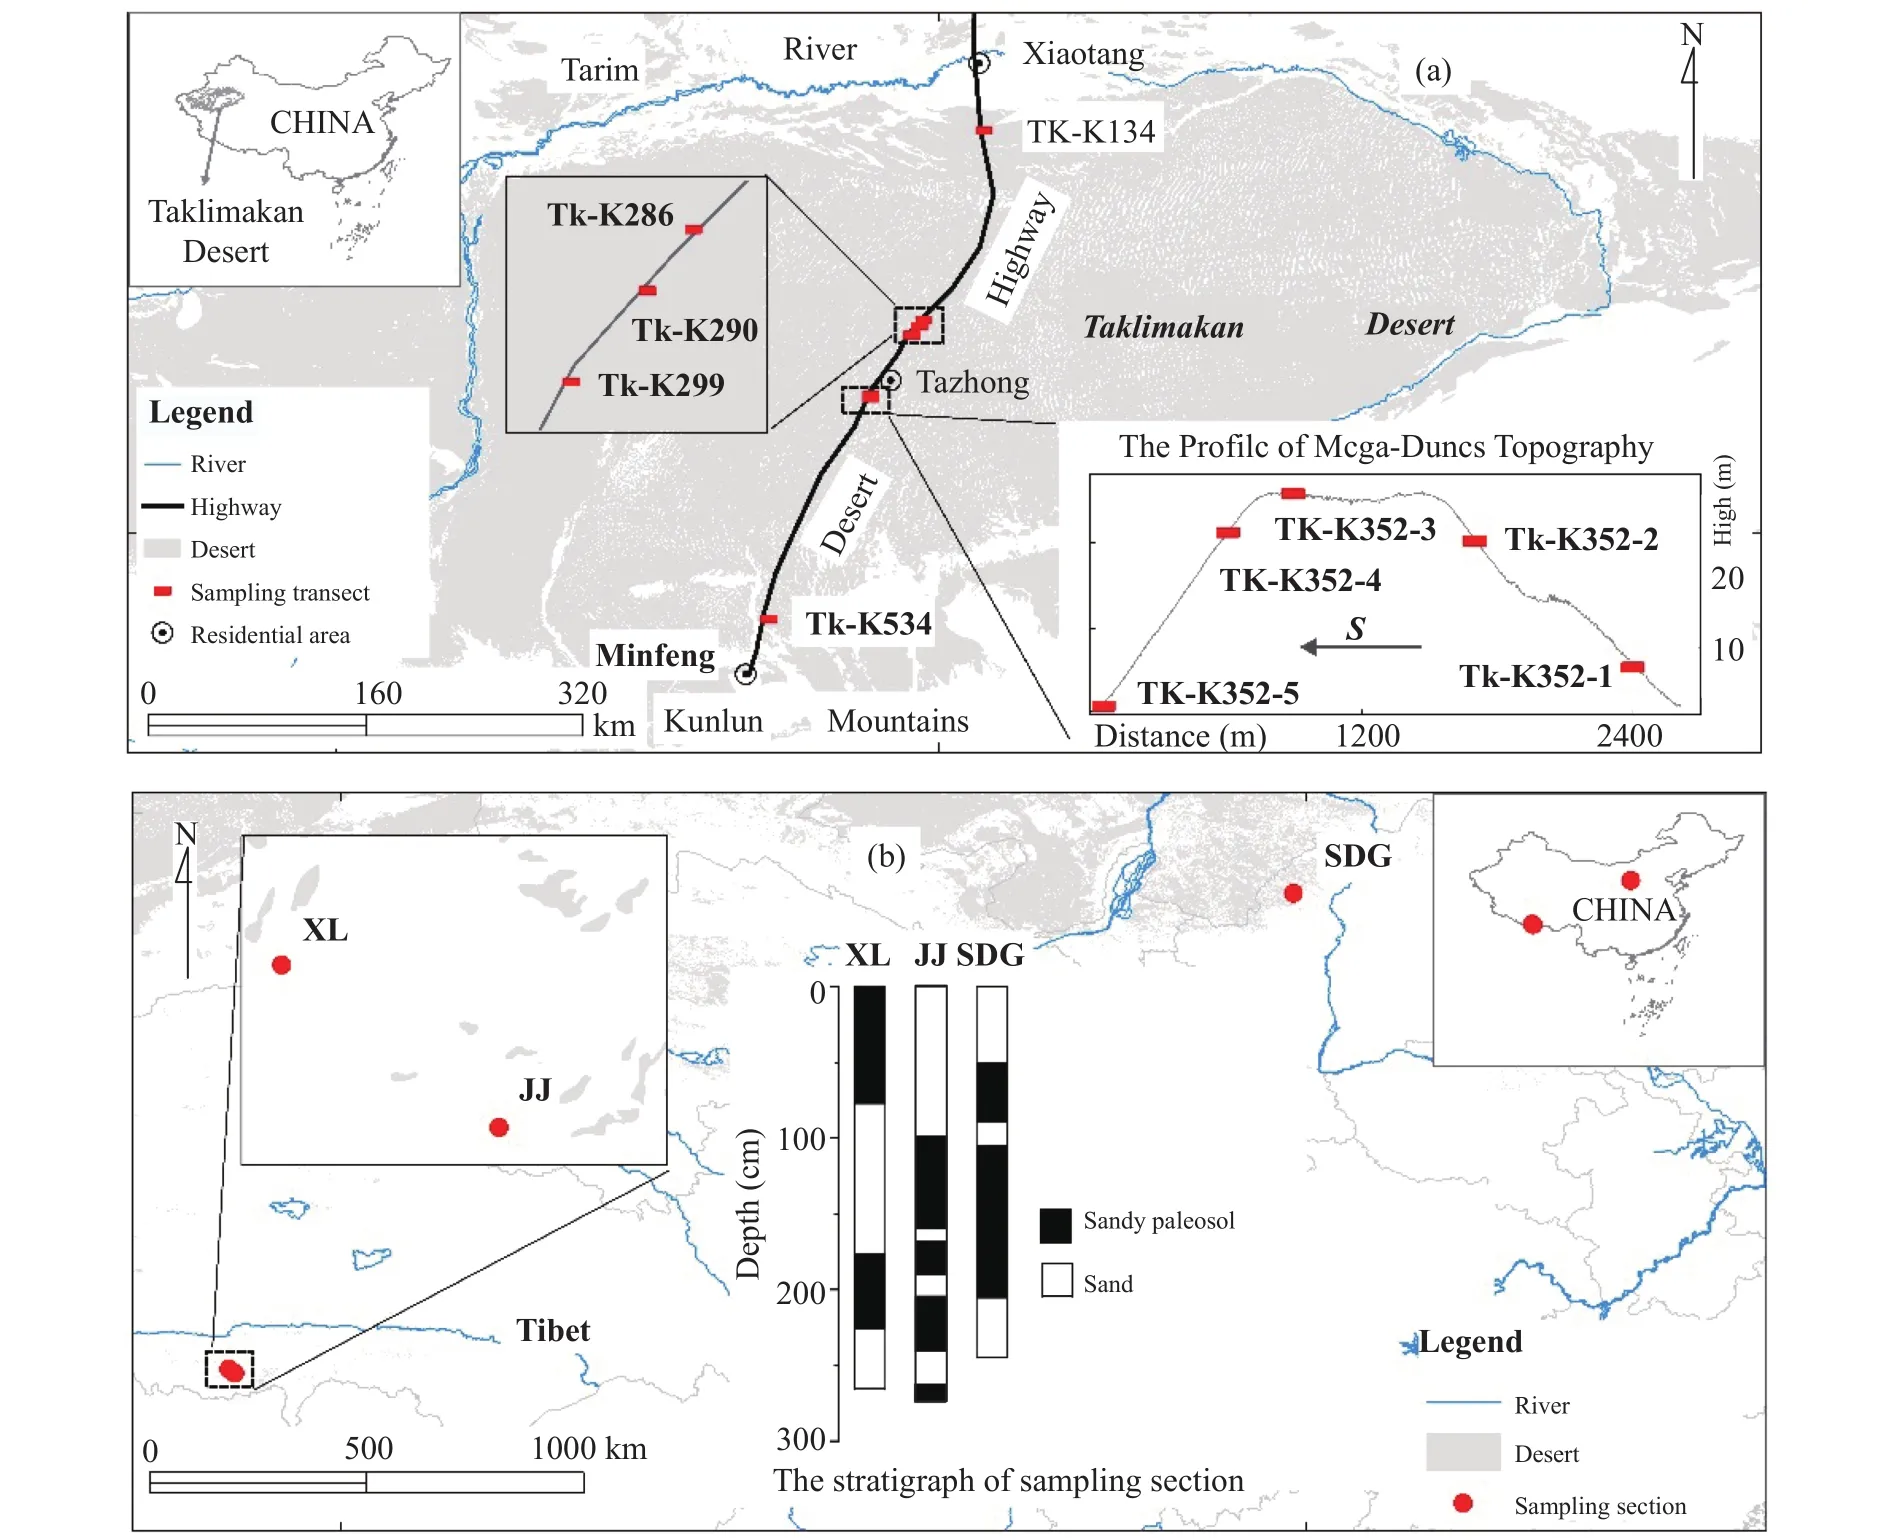
Figure 1 Study area and sampling locations
2.1.2 Grain-size data sequences of paleo-aeolian sediment
Three grain-size data sequences were collected from three different aeolian sediment sections (Figure 1b). These sections are typical paleo-aeolian, and respectively named after their sampling location, correspondingly abbreviated XL, JJ, and SDG. Of the three sections, sections XL and JJ are located in Qinghai-Tibet Plateau, China, and section SDG is located in the margin of Mu Us Desert, China. The thickness of each section is about 2–3 m. The sample amount is 134, 138 and 41 for sections XL, JJ and SDG, respectively (Luet al., 2010; Panet al., 2014). In this study,according to the field description of sedimentary characteristics in previous studies, each section was divided into two sedimentary types namely sandy paleosoil and sand layers.
2.2 Methods
Grain-size analysis of each sample was performed by using a Malvern particle size laser analyzer. After grain-size analysis, grain-size frequency data was shown up with 100 grain-size classes in the range of 0.01–2,000 μm.
2.2.1 Calculation of Std and dD
For one grain-size class, the standard deviation(Std) of a grain-size data sequence can be written as follows,

wherejis the number of grain-size class, 1≤j≤100,and Stdjis the standard deviation ofjth grain-size class' proportion for the grain-size data sequence.Piis the proportion ofjth grain-size class for ith sample,Pmis the mean proportion ofjth grain-size class for the grain-size data sequence, andnis the sampling amount of the grain-size data sequence.
Correspondingly, for one grain-size class, after arranging the grain-size class' proportion of all samples in a deciles order, the proportion difference between two samples withD90th deciles order andD10th deciles order can be written as follows,

where dDjis the proportion difference ofjth grainsize class,PD90isjth grain-size class' proportion forD90th sample, andPD10isjth grain-size class'proportion forD10th sample.
2.2.2 Grain-size fractions' identification and its application
After calculating Stds and dDs, the data can be plotted on a graph against corresponding grain-size classes (Figure 2). Grain-size fractions are typically classified at cutoffs of valley grain-size class (us), or fine peak grain-size (uf) and coarse peak grain-size(uc) in the graph. Finally, the proportion of grain-size fractions (class) ufand uc, as well as grain-size fraction <usare exported by Malvern particle size laser analyzer, and these grain-size fractions and their proportion can be considered as proxies for analysis of aeolian process or paleo-climate change.
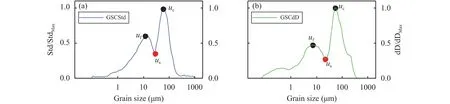
Figure 2 Application of GSCStd and GSCdD methods in previous studies
In left graph, Std data from Xuet al. (2006). In right graph, dD data from Nottebaumet al. (2013).
3 Results
3.1 Classification results of surface sediment
The graph of Stds is similar to that of dDs for each grain-size data sequence. The grain size class against peaks and valleys in the Stds graph is nearly equal to that in the dDs graph (Figure 3).
Regression analysis shows that Stds correlates with dDs at the 0.01 significant level for each grainsize data sequence, most determination coefficientR2of ten regression equations mainly reaches a level larger than 0.95 (Figure 3). However, in some grain-size data sequences, such as TK-K286, TK-K290, TKK299, TK-K352-1, TK-K352-4 and TK-K534, the Stds graph differs from the dDs graph at coarse grainsize classes (Figure 3, see black arrow), and these differences between Stds and dDs graphs lead to lower determination coefficientR2of regression equation.Further, grain-size classes ufand uc, and usare extracted from Stds and dDs graphs, then the proportion of grain-size fractions ufand uc, and <usare exported from Malvern particle size laser analyzer for each sample. The proportion results of grain-size fractions along each transect show that (Figure 4), the changing tendency of grain-size fractions ufand <usof GSCStd nearly mask that of GSCdD. However, in transect TK-K299, TK-K352-2, TK-K352-3, TKK352-4 and TK-K352-5, the proportion changing tendency of grain-size fraction uc-GSCStd is different from that of GSCdD.

Figure 3 Classification results of GSCStd and GSCdD methods for grain-size data sequence of surface sediment. The scatter plot refers to regression analysis between Stds and dD for each grain-size data sequence. The classification difference between Stds and dD graphs occurs over coarse grain-size classes
Because smaller wind speed is located in the shelter belt compared to that outside the shelter belt(Chenget al., 2015), the proportion of grain size fraction ucwould go down correspondingly in the shelter belt, while the proportion of grain size fractions ufand<uswould increase in the shelter belt. Generally, the more the proportion decreases or increases, the better the grain-size fraction. The average proportion ratio between samples outside and inside the shelter belt was calculated for each grain-size fraction of all grain size data sequences (Table 1). The difference of proportion ratio between grain-size fractions uc-GSCStd and uc-GSCdD exist in 6 grain size data sequences.Compared to grain-size fraction uc-GSCdD, the proportion ratio of uc-GSCStd shows larger value in transects TK-K352-2, TK-K352-3, TK-K352-5 and TKK534, but smaller value in transects TK-K299 and TK-K352-4 (the gray shade in Table 1). However, the difference of uf-GSCStd vs. uf-GSCdD, and us-GSCStd vs. us-GSCdD respectively exist in 2 and 3 grain size data sequences. It seems that the classification difference between GSCStd and GSCdD methods mainly comes from coarse grain-size fractions uc.ANOVA was then conducted for each of the three grain size fraction pair of uf, ucand us. The results show that, the proportion ratio produced by the GSCStd method does not significantly differ from that of the GSCdD method (at the 0.05 significant level).
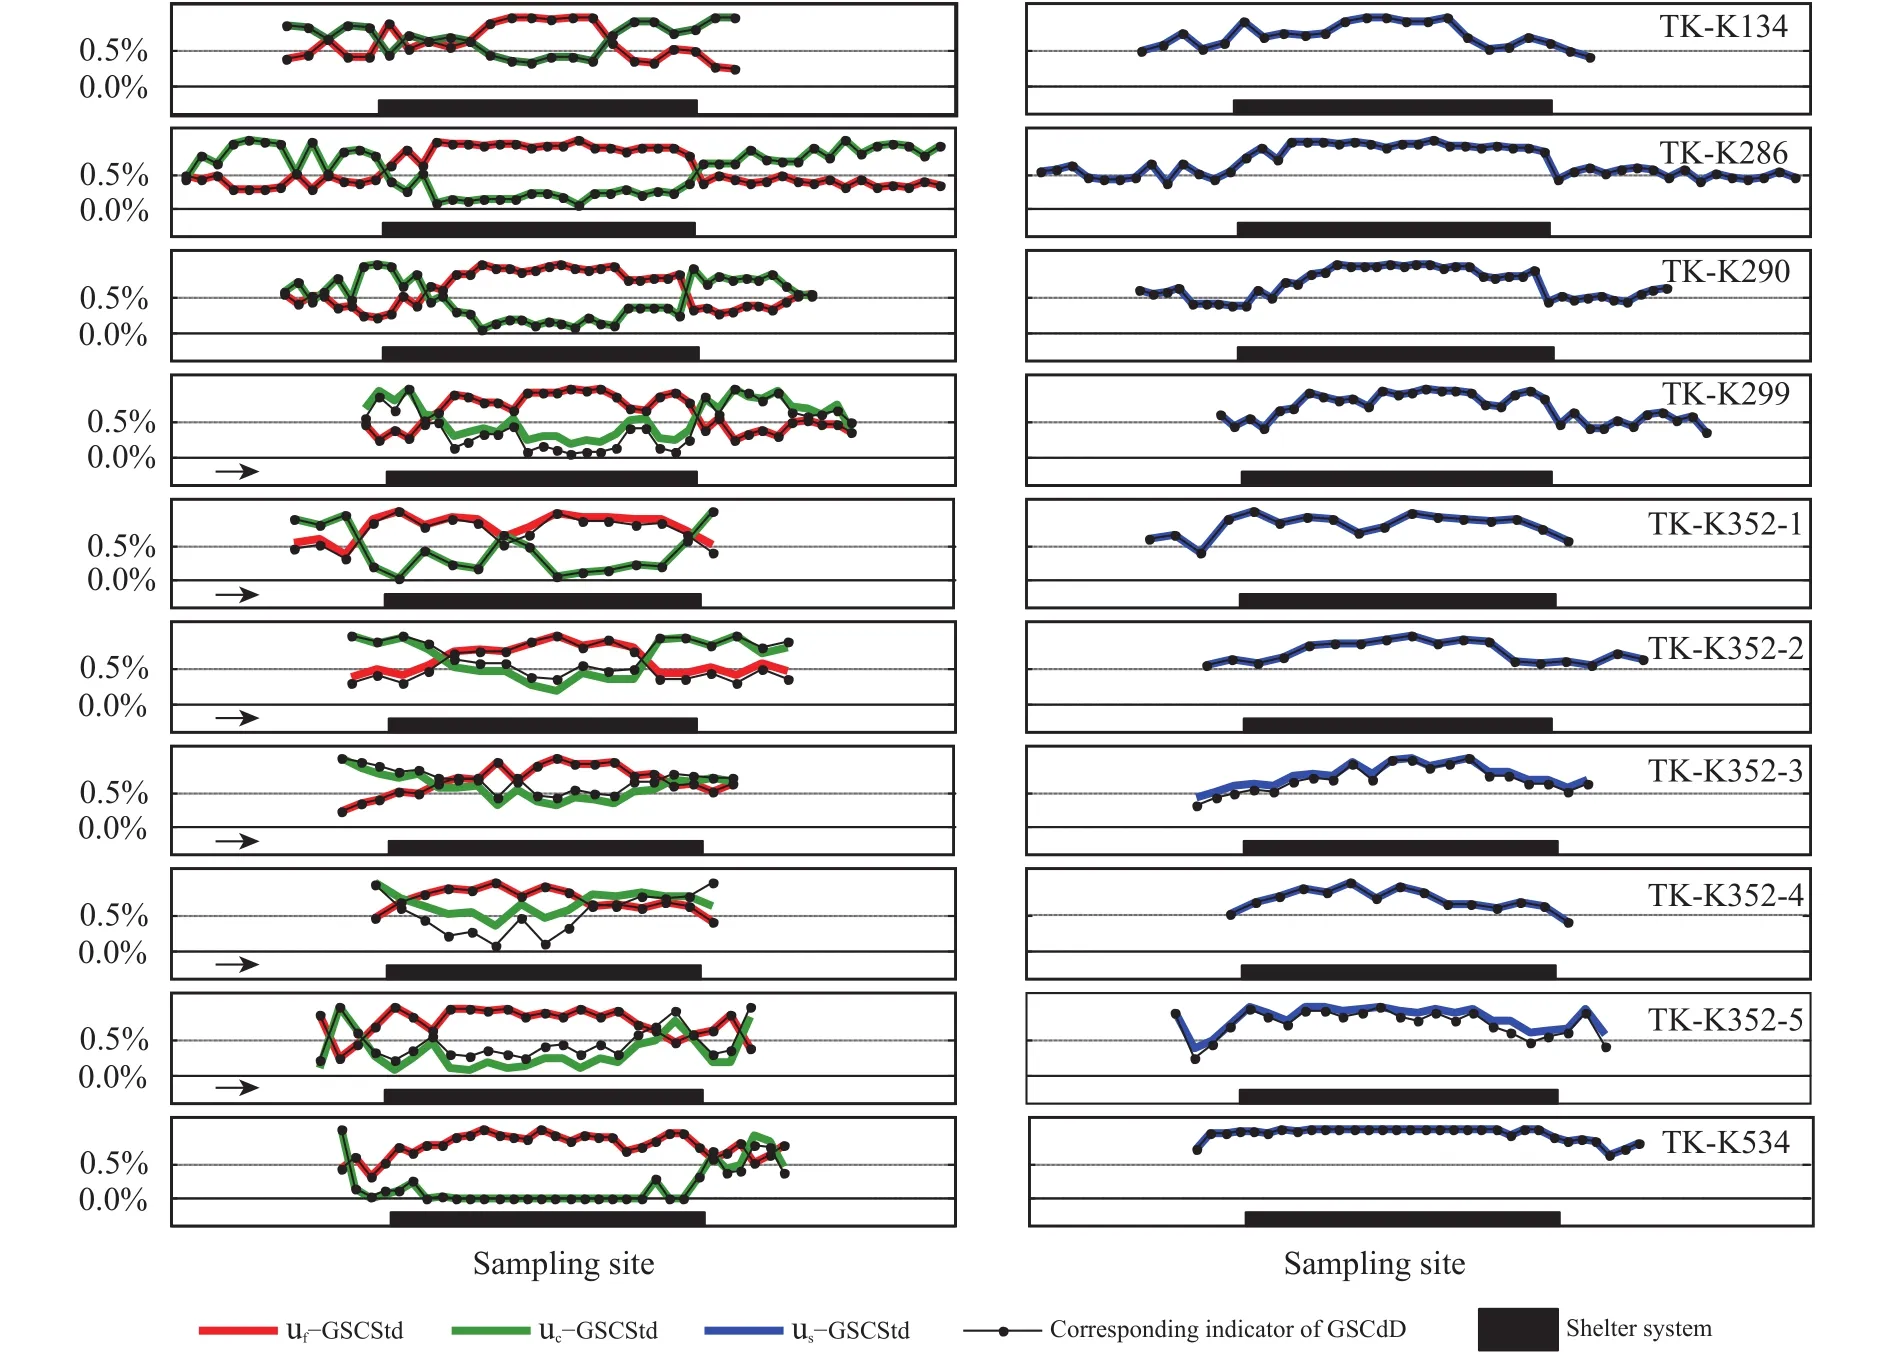
Figure 4 The proportion changing tendency of grain-size fractions extracted from Std and dD graphs of surface sediment
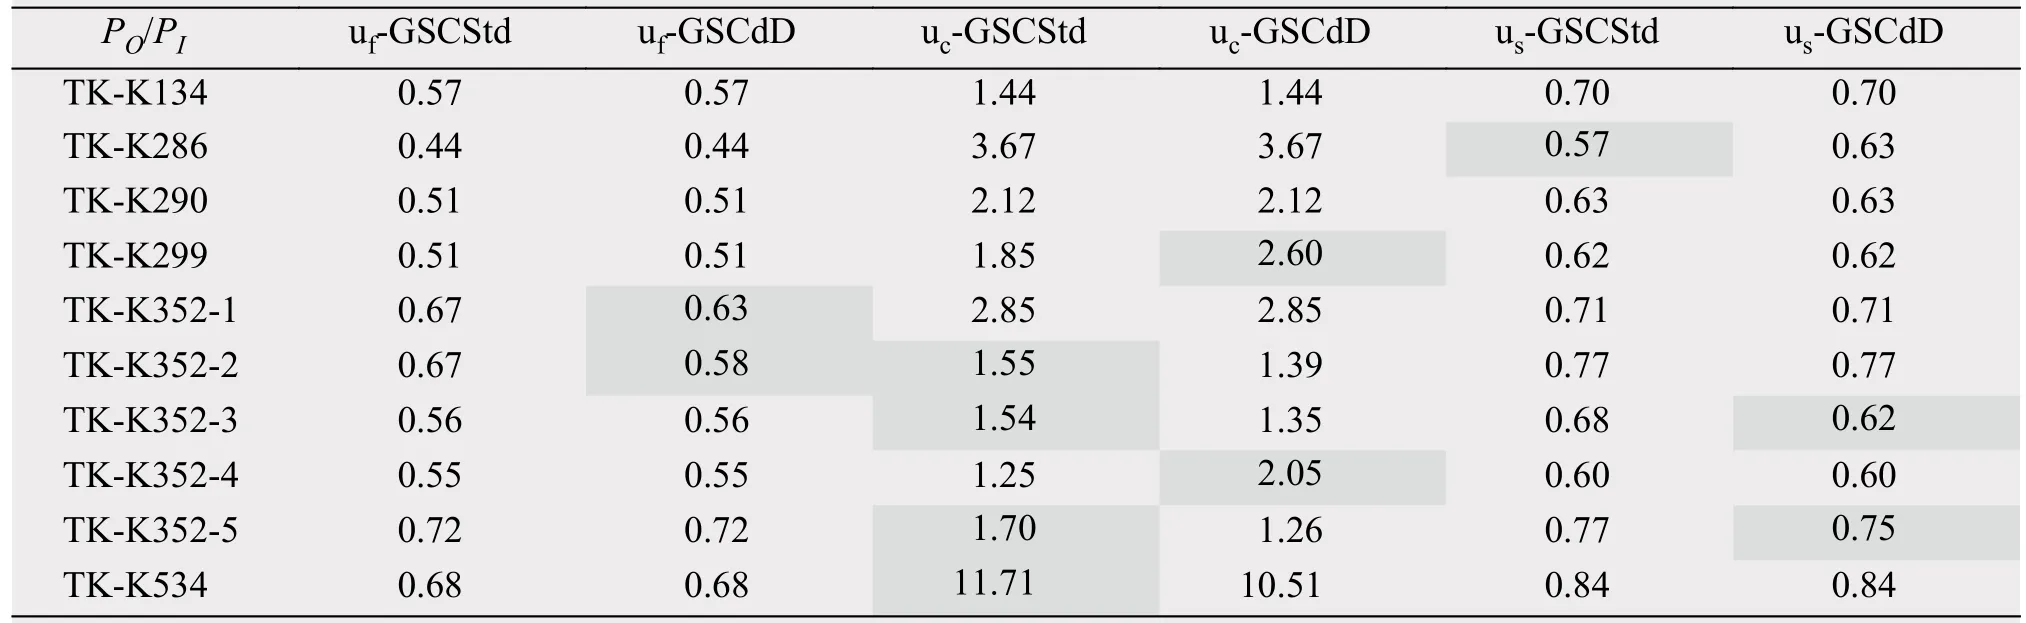
Table 1 The proportional ratio between samples outside and inside the shelter belt for each grain size fraction extracted by GSCStd and GSCdD methods
3.2 Classification results of paleo-aeolian sediment
The graph of Stds is similar to that of dDs for each paleo-aeolian sediment section. The grain-size class against peaks and valleys in the Stds graph nearly equal to that in the dDs graph (Figure 5). Regression analysis shows that Stds correlates with dDs at the 0.01 significant level for each grain-size data sequence, the determination coefficientR2of regression equation mainly reaches 0.98.
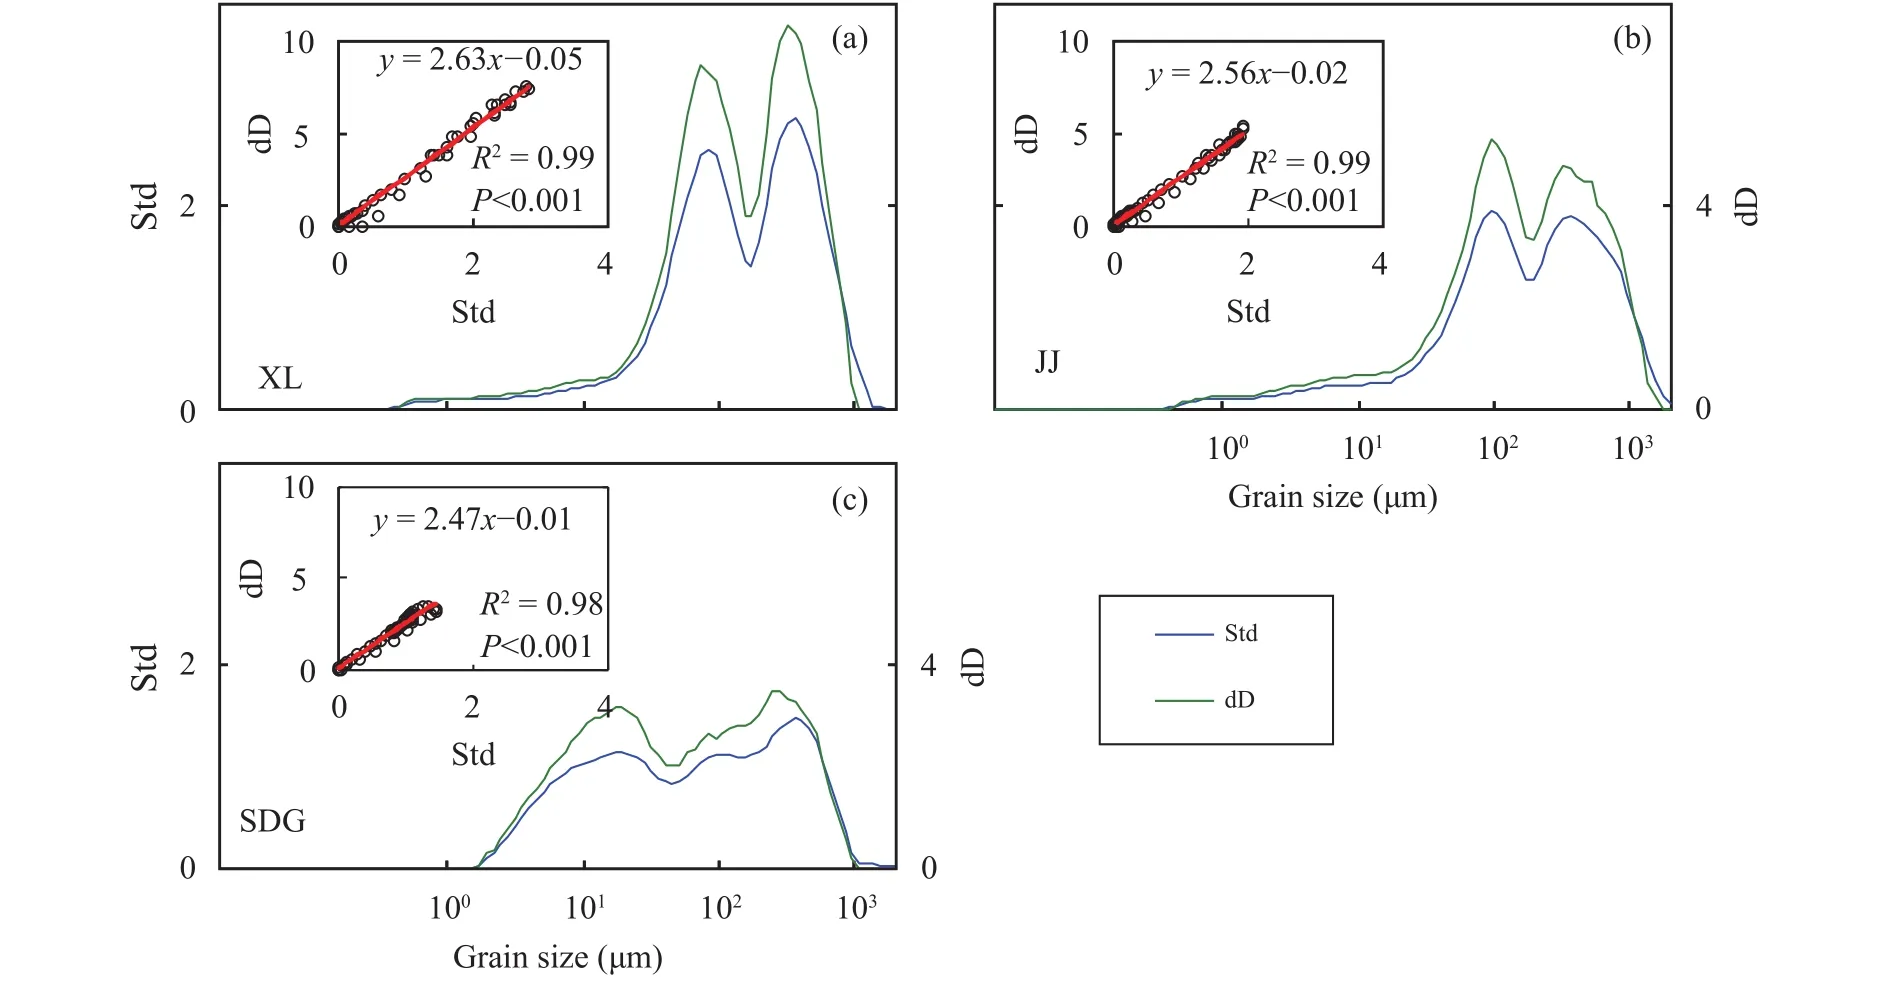
Figure 5 Classification results of GSCStd and GSCdD methods for grain-size data sequence of paleo-aeolian sediment. The scatter plot refers to regression analysis between Stds and dD for each grain-size data sequence. The classification difference between Stds and dD graphs occurs over coarse grain-size classes
The proportion results of grain-size fraction along the depth of each section shows that (Figure 6), the changing tendency of grain-size fractions uf-GSCStd and <us-GSCStd nearly mask that of GSCdD.However, in section SDG, the proportion changing tendency of grain-size fraction uc-GSCStd is different from that of GSCdD. Typically, due to the influence of climate; sediment in sandy paleosol layers of sediment section would be finer than that of sand layers.Thus, the larger the proportion differs between sandy paleosol layers and sand layers, the better the grainsize fraction.
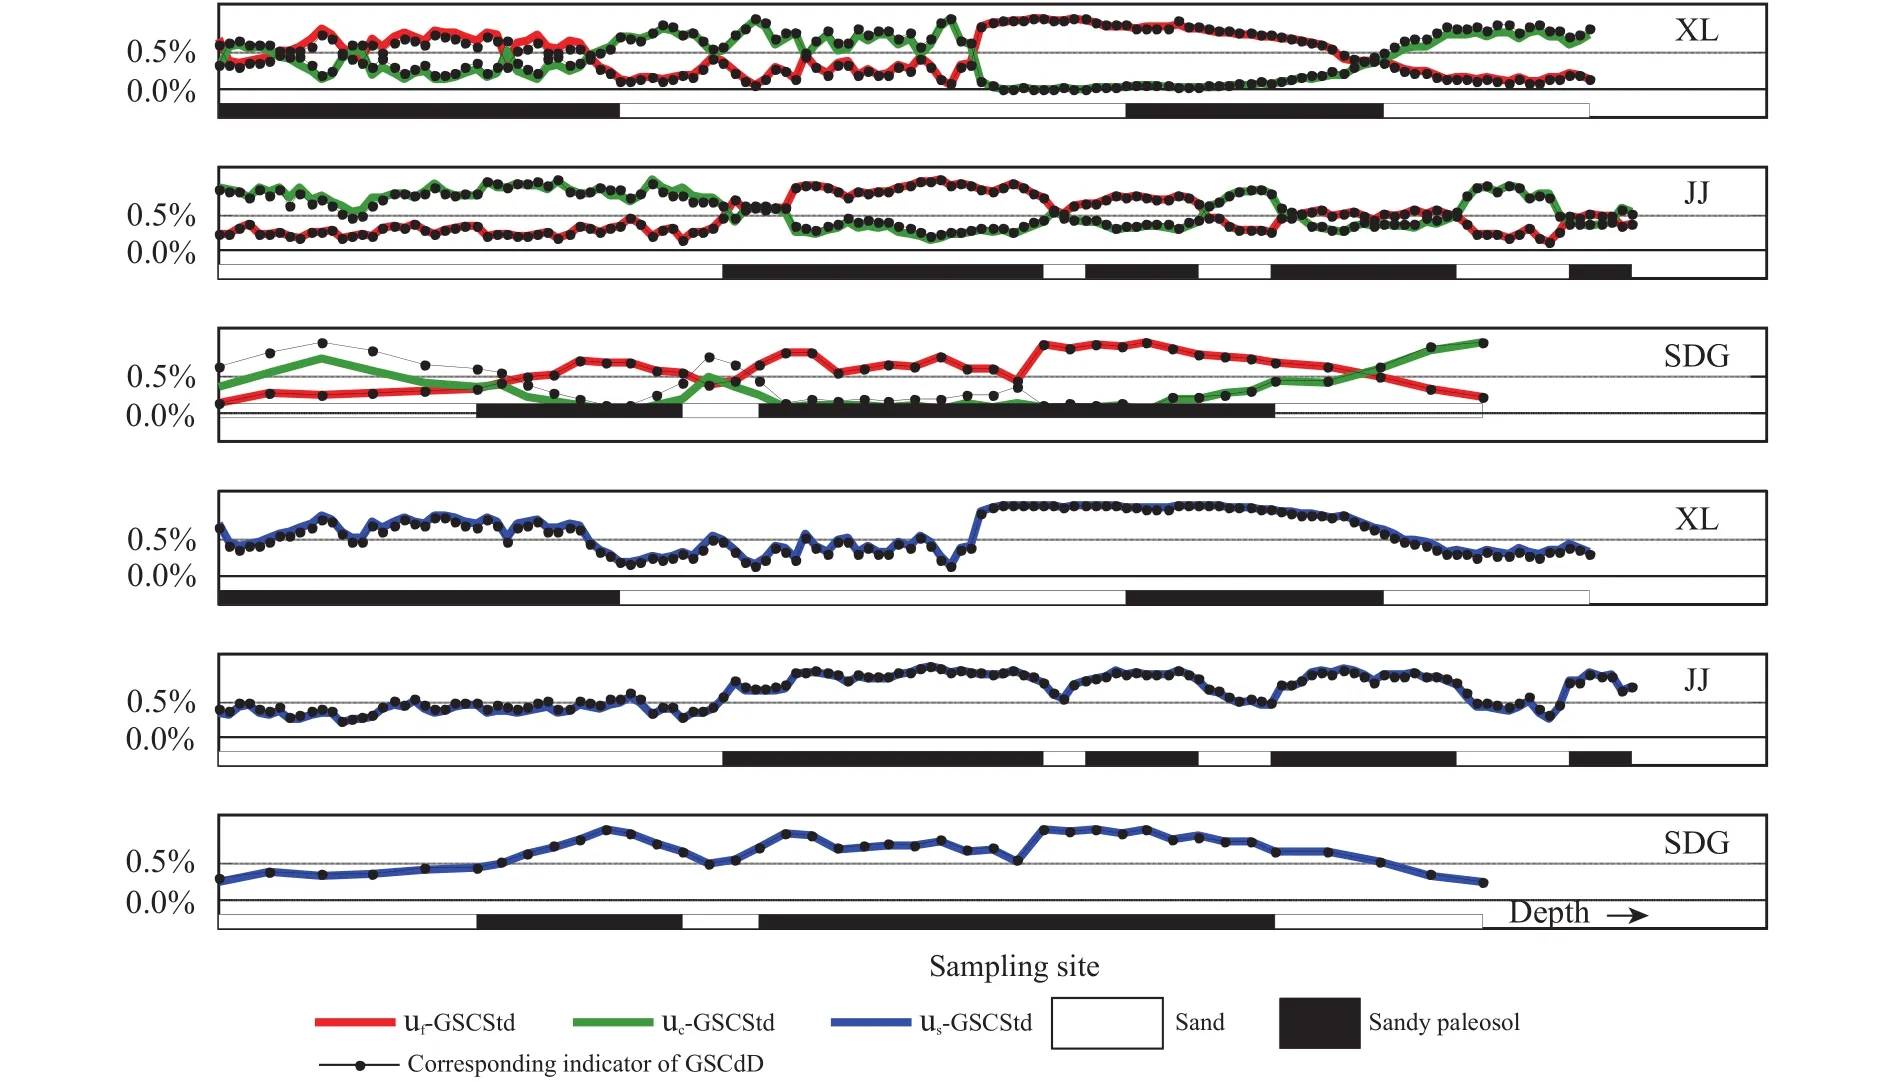
Figure 6 The proportion changing tendency of grain-size fractions extracted from Std and dD graphs of paleo-aeolian sediment
The average proportion ratio between samples of sandy paleosol and of sand was calculated for each grain-size fraction of all grain size data sequences(Table 2). Compared to the grain size fraction uc-GSC-dD, the proportion ratio of uc-GSCStd shows lower value in all three sections (the gray shade in Table 2).Similarly, the differences of us-GSCStd vs. us-GSCdD also display in all three sections, larger proportion ratios in JJ and SDG correspond to us-GSCStd, while the larger proportion ratio in XL corresponds to us-GSC-dD (the gray shade in Table 2). However, the difference of uf-GSCStd vs. uf-GSCdD only exist in XL(the gray shade in Table 2). It seems that the classification differences between GSCStd and GSCdD methods come from grain-size fractions ucand us. ANOVA was also conducted for each of three grain size fraction pair of uf, ucand us. The results show that, the proportion ratio produced by the GSCStd method does not significantly differ from that of the GSCdD method (at the 0.05 significant level).
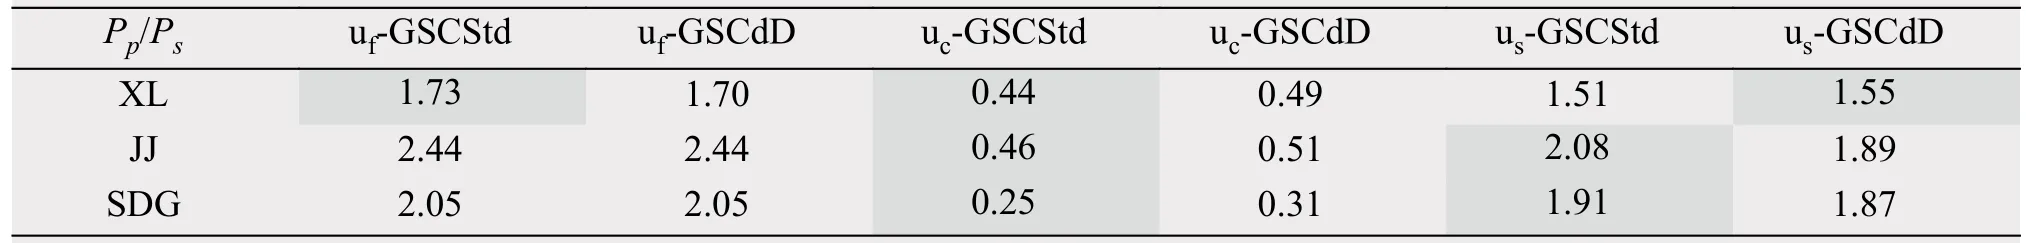
Table 2 The proportional ratio between sandy paleosol samples and sand samples for each grain size fraction extracted by GSCStd and GSCdD methods
4 Discussion and conclusion
In this study, we investigated the classification difference between GSCStd and GSCdD methods. We found that, the proportion changing tendency of grainsize fractions uf-GSCStd and < us-GSCStd nearly masks that of GSCdD on the graph of each grain-size sequence. The proportion results of three grain size fractions from the GSCStd method do not significantly differ from that of the GSCdD method for transects and sections (at the 0.05 significant level). The aforementioned results show that, application of the GSCStd method is equivalent to that of the GSCdD method in identification of finer grain-size fractions.
In addition, the classification difference between GSCStd and GSCdD methods mainly comes from coarse grain-size fractions. The proportion ratio of coarse grain-size fractions show that, the GSCStd method seems more applicable than the GSCdD method in grain-size data sequences such as TK-K352-2,TK-K352-3, TK-K352-5, TK-K534 and all three sections (Figures 1, 2). Nottebaumet al. (2014) noted that the GSCdD method is more applicable than the GSCStd method, however, from our results, we can note that the statements of Nottebaumet al. (2014)may not be correct. Overall, our results suggest that finer grain-size fractions that were identified by GSCStd and GSCdD methods can be considered as a suitable indicator in aeolian sediment research.
Acknowledgments:
This study is supported by project funding from Chongqing Normal University (No. 12XLB009) and Key Projects in the National Science & Technology
Program (No. 2006BAD26B0302). Map data of the desert used in this study was provided by"Environmental & Ecological Science Data Center for West China, National Natural Science Foundation of China".
 Sciences in Cold and Arid Regions2018年5期
- Sciences in Cold and Arid Regions的其它文章
- Study of thermal properties of supraglacial debris and degree-day factors on Lirung Glacier, Nepal
- Comparison of temperature extremes between Zhongshan Station and Great Wall Station in Antarctica
- Numerical simulation of the climate effect of high-altitude lakes on the Tibetan Plateau
- Comparison of precipitation products to observations in Tibet during the rainy season
- Altitude pattern of carbon stocks in desert grasslands of an arid land region
- Effect of slow-release iron fertilizer on iron-deficiency chlorosis, yield and quality of Lilium davidii var.unicolor in a two-year field experiment