
Comparison of temperature extremes between Zhongshan Station and Great Wall Station in Antarctica
2018-10-31 11:50AiHongXieShiMengWangYiChengWangChuanJinLi
AiHong Xie , ShiMeng Wang , YiCheng Wang , ChuanJin Li
1. State Key Laboratory of Cryospheric Science, Northwest Institute of Eco-Environment and Resources, Chinese Academy of Sciences, Lanzhou, Gansu 730000, China
2. Gansu Meteorological Administration, Lanzhou, Gansu 730020, China
ABSTRACT Although temperature extremes have led to more and more disasters, there are as yet few studies on the extremes and many disagreements on temperature changes in Antarctica. Based on daily minimum, maximum, and mean air temperatures(Tmin, Tmax, Tmean) at Great Wall Station (GW) and Zhongshan Station (ZS), we compared the temperature extremes and revealed a strong warming trend in Tmin, a slight warming trend in Tmean, cooling in Tmax, a decreasing trend in the daily temperature range, and the typical characteristic of coreless winter temperature. There are different seasonal variabilities, with the least in summer. The continentality index and seasonality show that the marine air mass has more effect on GW than ZS. Following the terminology of the Fifth Assessment Report of the Intergovernmental Panel on Climate Change (IPCC AR5), we defined nine indices of temperature extremes, based on the Antarctic geographical environment. Extreme-warm days have decreased, while extreme-warm nights have shown a nonsignificant trend. The number of melting days has increased at GW, while little change at ZS. More importantly, we have found inverse variations in temperature patterns between the two stations, which need further investigation into the dynamics of climate change in Antarctica.
Keywords: temperature extremes; Great Wall Station; Zhongshan Station; West Antarctica; East Antarctica; inverse variations; climate events
1 Introduction
Antarctica, as the coldest place on Earth (Scamboset al., 2018), plays a fundamental role in global climate; and there is a high level of interest in climate variability and change in Antarctica (Vaughanet al.,2003; Turneret al., 2004, 2005; Kennicuttet al.,2014). Evidence of warming over portions of Antarctica is growing, especially winter warming in West Antarctica and the Antarctic Peninsula (Chapman and Walsh, 2007; Steiget al., 2009; Dinget al., 2011;Bromwichet al., 2013). Various studies have presented evidence of warming, which may contribute to the regional retreat of glaciers, disintegration of floating ice shelves, rising of the sea level, a 'greening'through the expansion in range of various flora, and the likely extinction of less-competitive species and the spread of invasive species (Shepherdet al., 2012;Turneret al., 2016; Amesburyet al., 2017; Kaufmanet al., 2017; Leeet al., 2017; Thomaset al., 2017).However, there is much disagreement about the magnitude of warming, its intensity, and seasonal and regional differences. In looking at surface-air temperatures collected for more than 60 years over Antarctica,the long-term trend is one of warming (Nicolas and Bromwich, 2014; Steig, 2016); the result shows statistically significant annual warming in the Antarctic Peninsula and virtually all of the West Antarctica but no significant temperature change in the East Antarctica (Nicolas and Bromwich, 2014). Recent studies show that the Antarctic Peninsula has cooled since the late 1990s (Turneret al., 2016), and the cooling has already impacted the cryosphere in the northern Antarctic Peninsula (Olivaet al., 2017); However, Steig reports that it would indeed be premature to come to such a conclusion (Steig, 2016). Temperature extremes that have occurred and are occurring frequently can lead to more and more disasters (IPCC,2013) because the extremes interact with exposed and vulnerable human and natural systems. The Intergovernmental Panel on Climate Change (IPCC) published theSpecial Report on Managing the Risks of Extreme Events and Disasters to Advance Climate Change Adaption(SREX) in 2012 (IPCC, 2012).However, Antarctica has had very little research on extreme events until now (IPCC, 2013), as meteorological records are spatially poor and of short duration.
To understand the apparent reversal, this work aims to analyze the interdecadal variation of daily observation minimum, maximum, and mean surface-air temperatures (Tmin,Tmax,Tmean) at Great Wall Station and Zhongshan Station. For a better interpretation of the temperature variation, we compare the indices of temperature extremes between the two stations in the last three decades.
2 Data and methodology
On February 20, 1985, China established the first Chinese research station in Antarctica (Figure 1),Great Wall Station (GW, 62°12'59"S, 58°57'44"W, 10 m a.s.l.), which lies on the south of King George Island and to the north of the Antarctic Peninsula. The second Chinese station, Zhongshan Station (ZS,69°22'23.36''S, 76°22'17.14''E, 15 m a.s.l.), was established on February 26, 1989, and lies in Prydz Bay in East Antarctica. Sensors at these stations can measure temperatures within a range of -85 °C, –65 °C and at a resolution of 0.02 °C. In the harsh Antarctic environment, the operation of the stations has met extremely challenging conditions. The reliability of the temperature observations is a central premise of our analysis (Bromwichet al., 2013). Professional weather observers did the quality control for temperatures during the period from establishment to December 31,2015, providing a robust anchor for the observation data. Based on the daily minimum, maximum, and mean surface-air temperatures (Tmin,Tmax,Tmean) from the two stations, we calculated monthly, seasonal, and annual mean values of the observation air temperature (Table 1).
The large seasonal difference in solar radiation from low to high latitudes makes it necessary to adjust the annual temperature amplitude by latitude (Selfet al., 2011). Gorczynski suggested a continentality index (CI, also called the coefficient of continentality or index of continentality) in which the annual difference in temperature is divided by the sine of the latitude to compensate for the seasonal differences from latitude (Gorczyński, 1920). Later, there were modifications of the index, including the addition of a few constants (Grieseret al., 2006); a constant for the degree of latitude (Conrad, 1946); classification independent of temperature amplitudes (Berg, 1944),while the modification index is seldom used. We adopt Gorczynski's index in this study, as it is easily computed and applicable to high latitudes:where CI is the index of continentality expressed as a percent,TmaxandTminis the annual range of average monthly temperature in °C, andφis the geographical latitude in degrees. Because the stations in this study are located in the Southern Hemisphere, the values of latitude are negative, which we transform to positive.
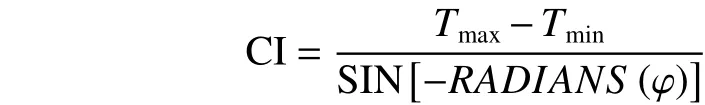
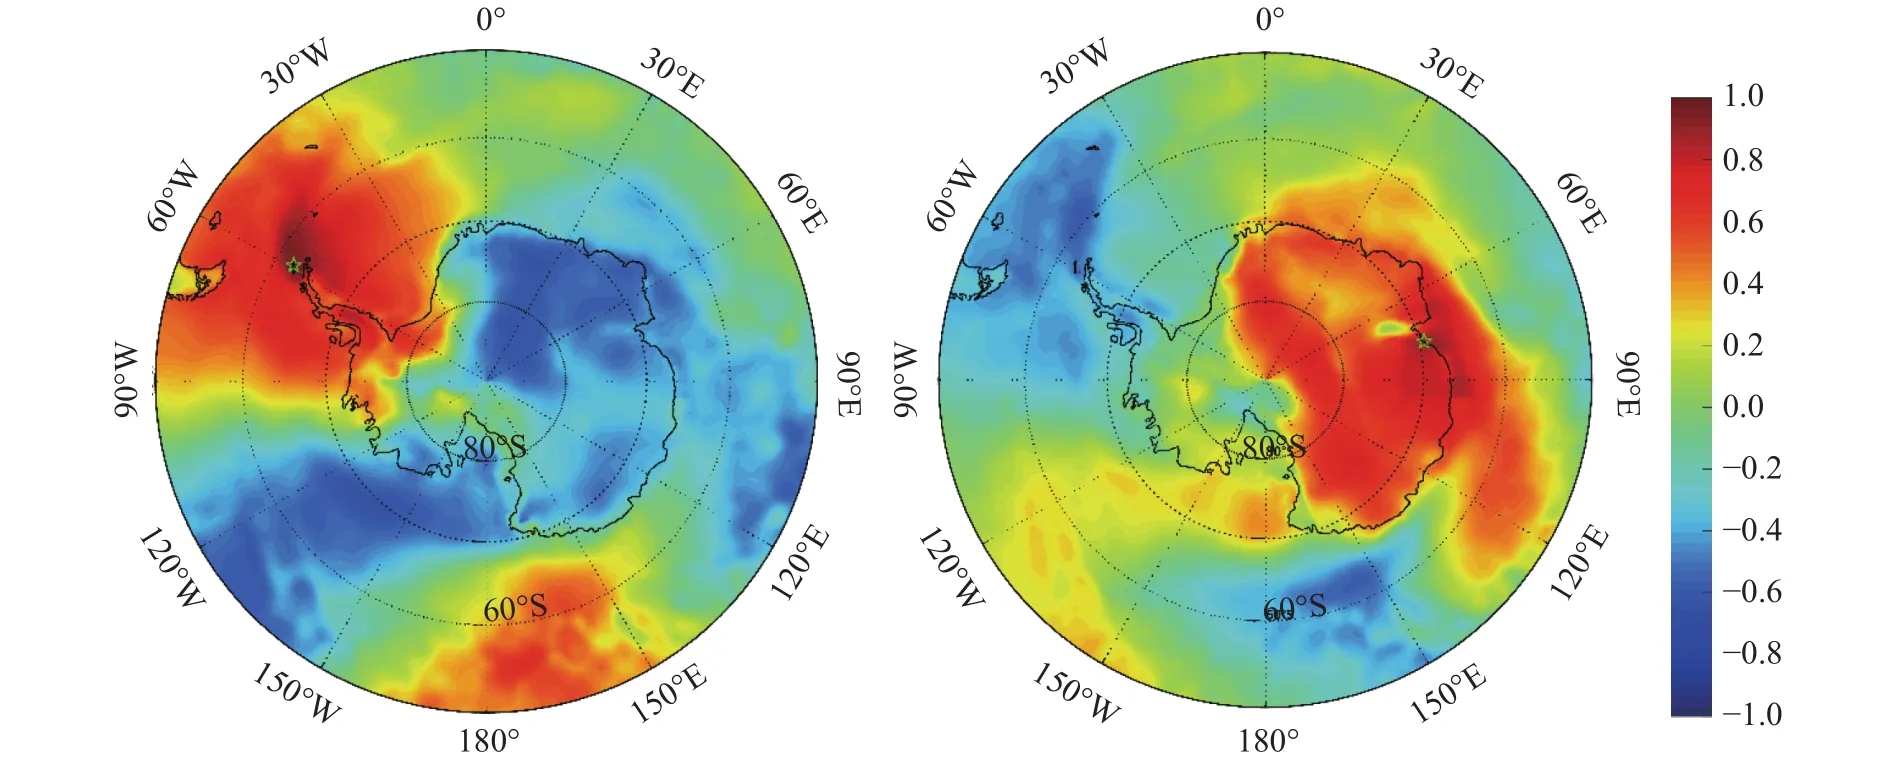
Figure 1 Map of Antarctica and annual spatial footprint of GW (left) and ZS (right) stations' temperature (The color shadings show the correlation between the annual mean temperatures at GW or ZS and at every other grid point in Antarctica. The correlations are calculated using ERA-Interim 2-metre temperature from 1989 to 2015. Stars denote the location of GW and ZS)
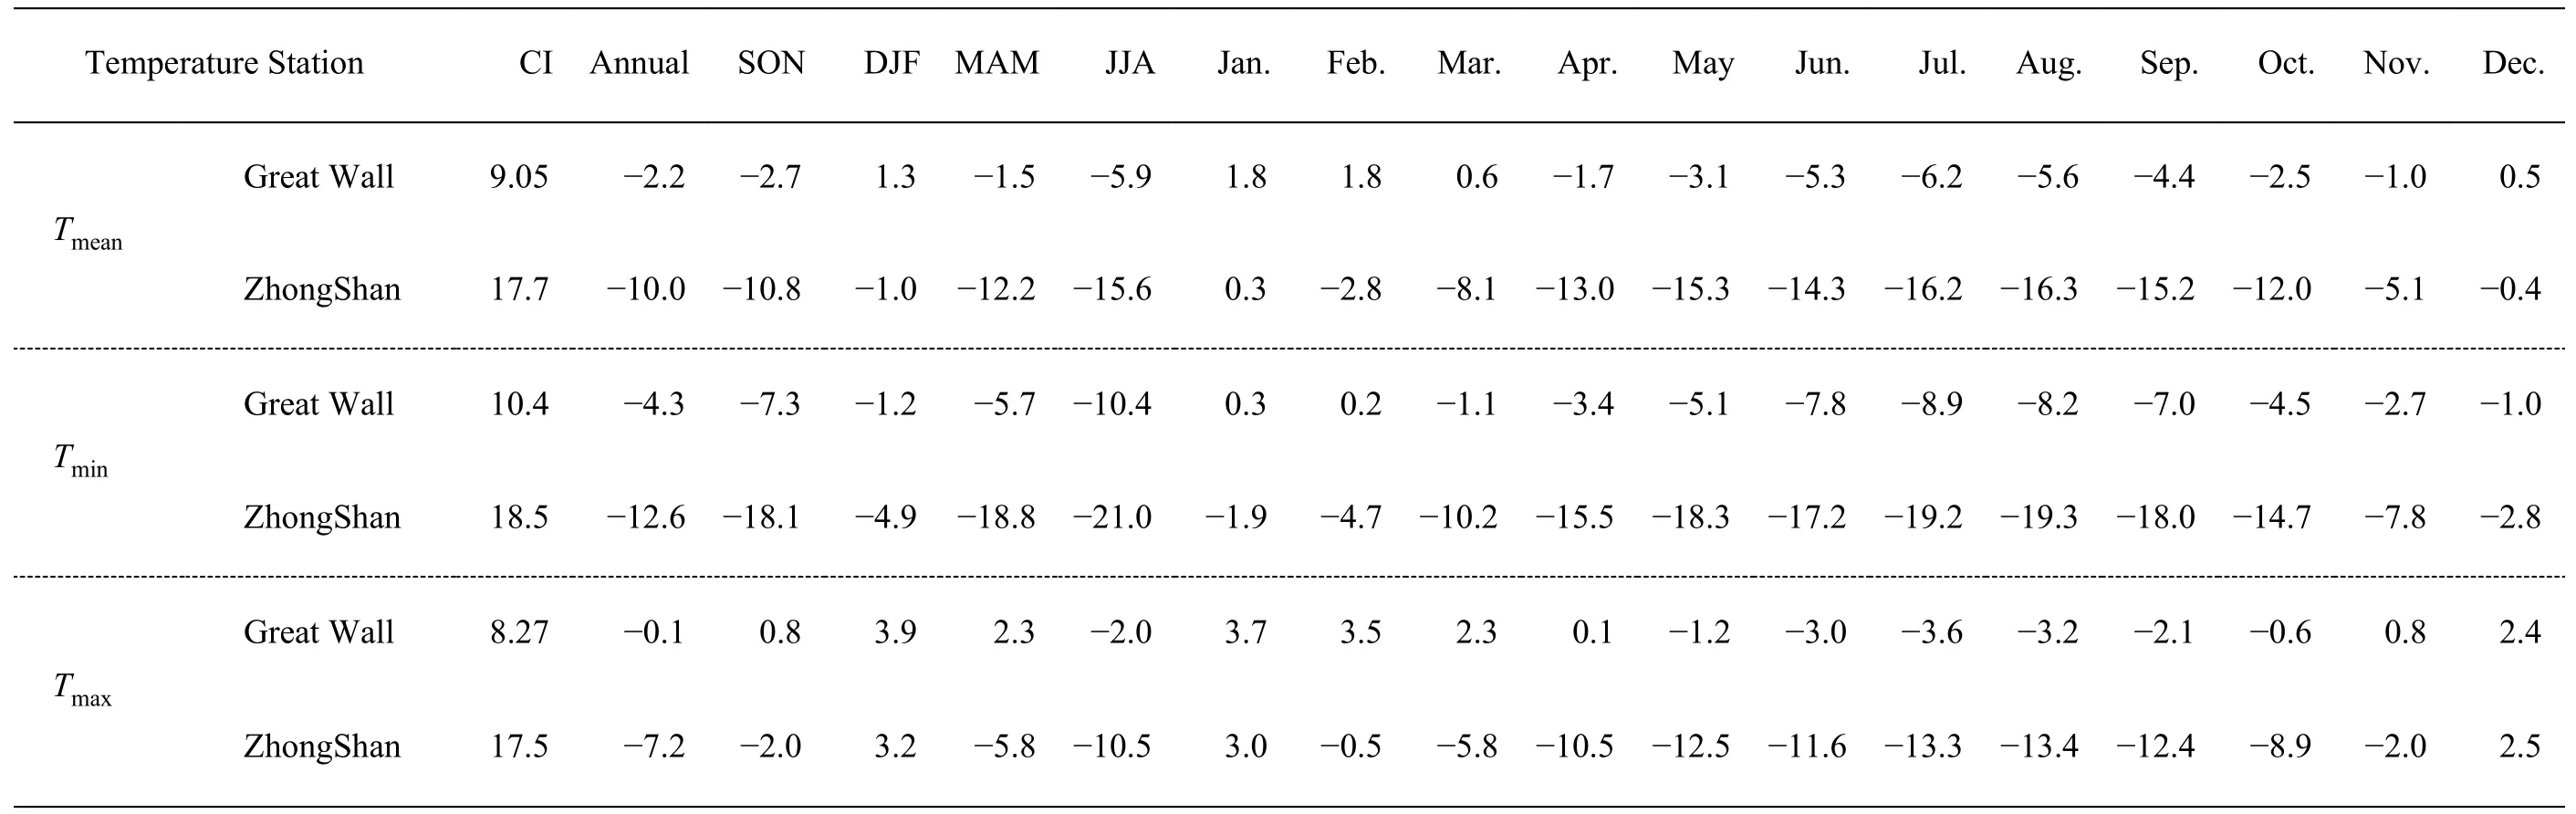
Table 1Annual, seasonal, and monthly Tmean, Tmin, and Tmax (°C) and CI (%) for Great Wall and Zhongshan stations
Based on the IPCC AR5 (IPCC, 2013) and the Antarctic geographical environment, nine climate indices of extreme temperatures are defined and calculated from the daily data (Table 2). Some indices,such as the number of tropical nights, are not relevant to the region studied and have not been used;however, the number of melting days are counted. Table 2 provides descriptions of indices used, based on monthly and/or annual data. The percentiles are calculated from the reference period 1985/1989–2015,which is a widely used climate-normal period.

Table 2 Definitions of nine indices of temperature extremes
3 Results
We calculated annual, seasonal, and monthly mean temperature ofTmin,Tmax, andTmean(Table 1)for the period from establishment to December 31,2015. The annual mean temperature was -2.2 °C and-10.0 °C at GW and ZS, respectively. These figures showed the expected decrease with latitude. So did all the monthly and seasonal values ofTmin,Tmax, andTmeanfor the two stations, except for the continentality index. The seasons are defined as the austral spring (September to November, SON), summer(December to February, DJF), autumn (March to May, MAM), and winter (June to August, JJA).
3.1 Annual variations of temperature extremes at the two stations
Figure 2a presents the annual-mean-temperature time series from the establishment to the December 31, 2015. The linear trend for the period shows that the annual temperature had an average warming trend with the rate of 0.29 °C and 0.18 °C per decade inTmin, a slight warming of 0.05 °C and 0.03 °C per decade inTmean, along with a cooling trend of -0.10 °C and -0.10 °C per decade inTmax, at GW and ZS, respectively. This pattern indicates that warming mainly occurred inTmin, either in the Antarctic Peninsula or in East Antarctica. In general,Tmeanchanged little during the last three decades, whileTmaxshowed a slight cooling trend, which disagrees with global climate warming, especially opposite to the warming observed over land in the high latitudes of the Northern Hemisphere (Bromwichet al., 2013; IPCC, 2013).TheTminwarming was less than that measured at Farady/Vernadsky on the western coast of the Antarctic Peninsula (0.58 °C per decade), a site already known for its rapid atmospheric warming (Vaughanet al., 2003). This difference is perhaps partly due to the time difference of the research periods. However, theTminwarming was greater than the global average(0.13 °C per decade) (IPCC, 2013).
All the trend coefficients were higher at GW than at ZS (Figure 2a), which shows that climate has changed more at GW than at ZS. The index CI (Table 1) was lower at GW than at ZS, which indicates that the constant stable marine air mass affects GW more than ZS. This difference was mainly due to geographic location. GW lies on the north of the Antarctic Peninsula, is located in the subpolar area, and has the effect from subpolar cyclones all the year around. There are many rainy days, the surface always remains wet,and the turbulent exchange is very weak in sub-Antarctica (Zhouet al., 1990; Zhanget al., 2015; Wanget al., 2017); whereas, ZS is located on the East Antarctic coast (Xieet al., 2016) and has more effect from the continental air mass than GW.
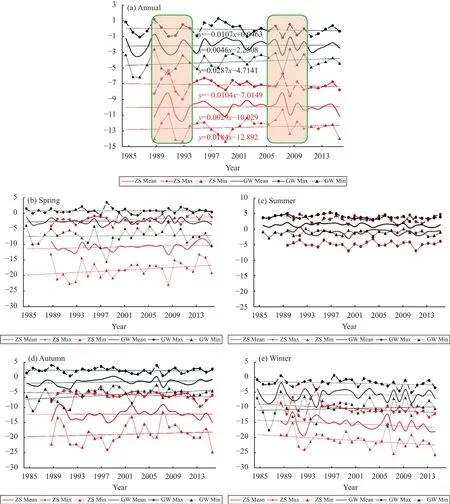
Figure 2 Time series of annual mean (solid line), maximum (broken line with solid circle), and minimum (dotted line with triangle)temperature (°C) and the corresponding linear trends at GW (black) and ZS (red) stations (from daily values) for annual and austral seasons: Spring (SON), Summer (DJF), Autumn (MAM), and Winter (JJA) (°C)
All the annual temperatures ofTmean,Tmin, andTmaxshowed the inverse trend at the two stations, with high negative correlation coefficients (CC) of -0.494(N>27,P<0.01). It shows that an anti-correlation exists between the temperature variations of East Antarctica and the Antarctic Peninsula, especially during the period of 1989 to 1995 and 2007 to 2011 (shadow areas in Figure 2a). Based on the previous study that ERA Interim is superior to the other reanalysis of NCEP-1, NCEP-2, 20CR-V2, and JCDAS (Xieet al.,2014), we prefer the ERA-Interim 2-metre temperatures from 1989 to 2015 to calculate the correlation between GW and ZS (Figure 1). The color shadings show the correlation between the annual temperatures at each station and at every other grid point in Antarctica. Both of the figures (Figures 1a, 1b) present the general overview of the negative correlation between the Antarctic Peninsula and East Antarctica. GW Station is primarily controlled by the Amundsen Sea Low (Hanet al., 2018); and ZS Station in East Ant-arctica is most affected by International Pacific Oscillation (IPO), El Niño-Southern Oscillation (ENSO),and Pacific-South American (PSA) (Clemet al.,2018; Paoloet al., 2018).
Figure 3 shows the annual value of the daily temperature range (DTR) is obviously lower at GW than at ZS, which indicates again that GW has more maritime climate characteristics than ZS. The DTR at the two stations had a similar trend, with the high CC of 0.920 (N=22,P<0.001) for the 5-year moving average and CC of 0.527 (N=27,P=0.005) for the annual value during the last three decades. Compared withTmean,Tmin, andTmax, DTR has decreased more, with the line trend of -0.29 °C and -0.40 °C per decade at ZS and GW, respectively. DTR at the two stations had a similar decreasing trend, as both East Antarctica and the Antarctic Peninsula are under the control of the Antarctic Circumpolar Current (ACC). It is emphasized that the long-term climate memory is not negligible for trend evaluation for air temperatures over Antarctica, especially for the Antarctic coastline, island, and the western continental areas (Yuanet al.,2015), which contribute to the similar trend of DTR variation between the two stations.
3.2 Seasonal and monthly variations of climate extremes at the two stations
Figure 2 shows the overall agreement on the greatest seasonal warming occurring in austral spring(SON) amongTmin(1.05 °C per decade),Tmean(0.42 °C per decade), andTmax(0.60 °C per decade) at ZS,which corroborates the conclusion from a recent investigation of the West Antarctica warming during this season (Schneideret al., 2012; Bromwichet al.,2013). However, the warming at GW was not so obvious in spring among eitherTmin,Tmean, orTmax; and the greatest seasonal warming occurred in autumn(MAM) amongTmin,Tmean, andTmaxat the rate of 1.01 °C, 0.30 °C, and 0.07 °C per decade, respectively. In austral summer, temperatures have changed little, and winter temperatures indicated a cooling trend at both ZS and GW stations for allTmin,Tmean,andTmax. Moreover, the cooling trend was much stronger at ZS than at GW, with the cooling trend of-1.15 °C, -0.79 °C, and -0.95 °C per decade forTmin,Tmean, andTmax, respectively, at ZS; and the corresponding values of -0.38 °C, -0.01 °C, and -0.39 °C per decade at GW. The Southern Annular Mode(SAM) trend toward its positive phase in summer and fall since 1950s has had a statistically significant cooling effect, not only in East Antarctica but also in West Antarctica (Nicolas and Bromwich, 2014).
Similar to the annual average, the seasonal DTR(Figure 3) was lower at GW than at ZS, presenting a decreasing trend in the last three decades. However,DTR has obviously seasonal characteristics, decreasing less in austral spring and summer and much more in autumn and winter. In autumn and winter, all the trends exceeded -0.40 °C per decade at the two stations; and the decreasing trend reached -0.58 °C per decade in winter at GW. The seasonal variation of DTR has decreased more at GW than at ZS in spring,autumn, and winter.
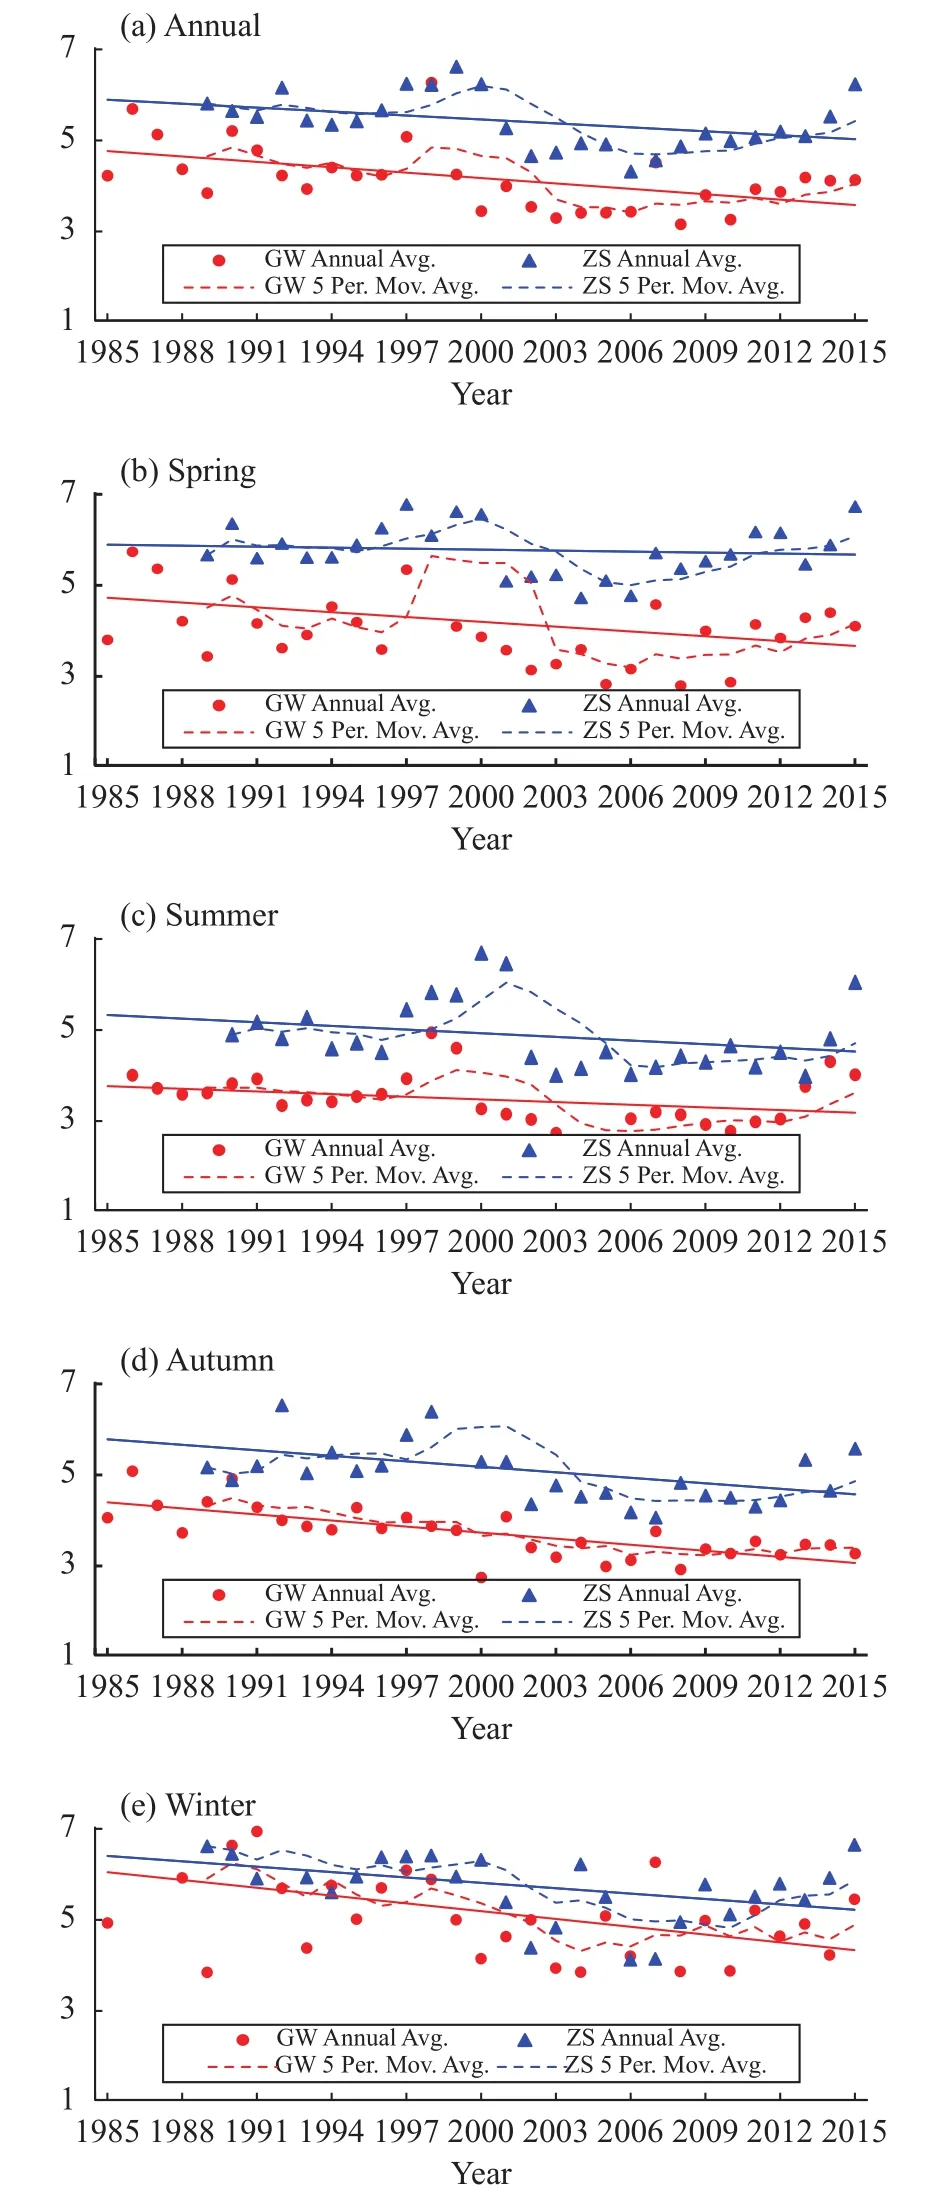
Figure 3 The daily temperature range (DTR) (°C) at GW(red) and ZS (blue) stations for annual and austral seasons. The solid circle/triangle and dashed line represents the observations and 5-year-moving average, respectively (°C)
As Figure 4 indicates, at both ZS and GW stations, air temperature warmed rapidly from September, and cooled rapidly at the end of summer and in autumn, and was preceded and followed by lower rates of fluctuations.Corelessnessis defined as the amplitude ratio of the second to the first harmonic of the annual temperature wave (Allison, 1998). This typical pattern of coreless winter shows that the winter temperatures do not have distinctive minima,and the temperature traces are rather flat over winter months, which is consistent with those for the other coastal stations and the inland stations in Antarctica(Allison, 1998; Gonget al., 2015; Van Wessemet al.,2015). The seasonal cycle in air temperature had a coreless period from May to September at ZS and from June to August at GW.
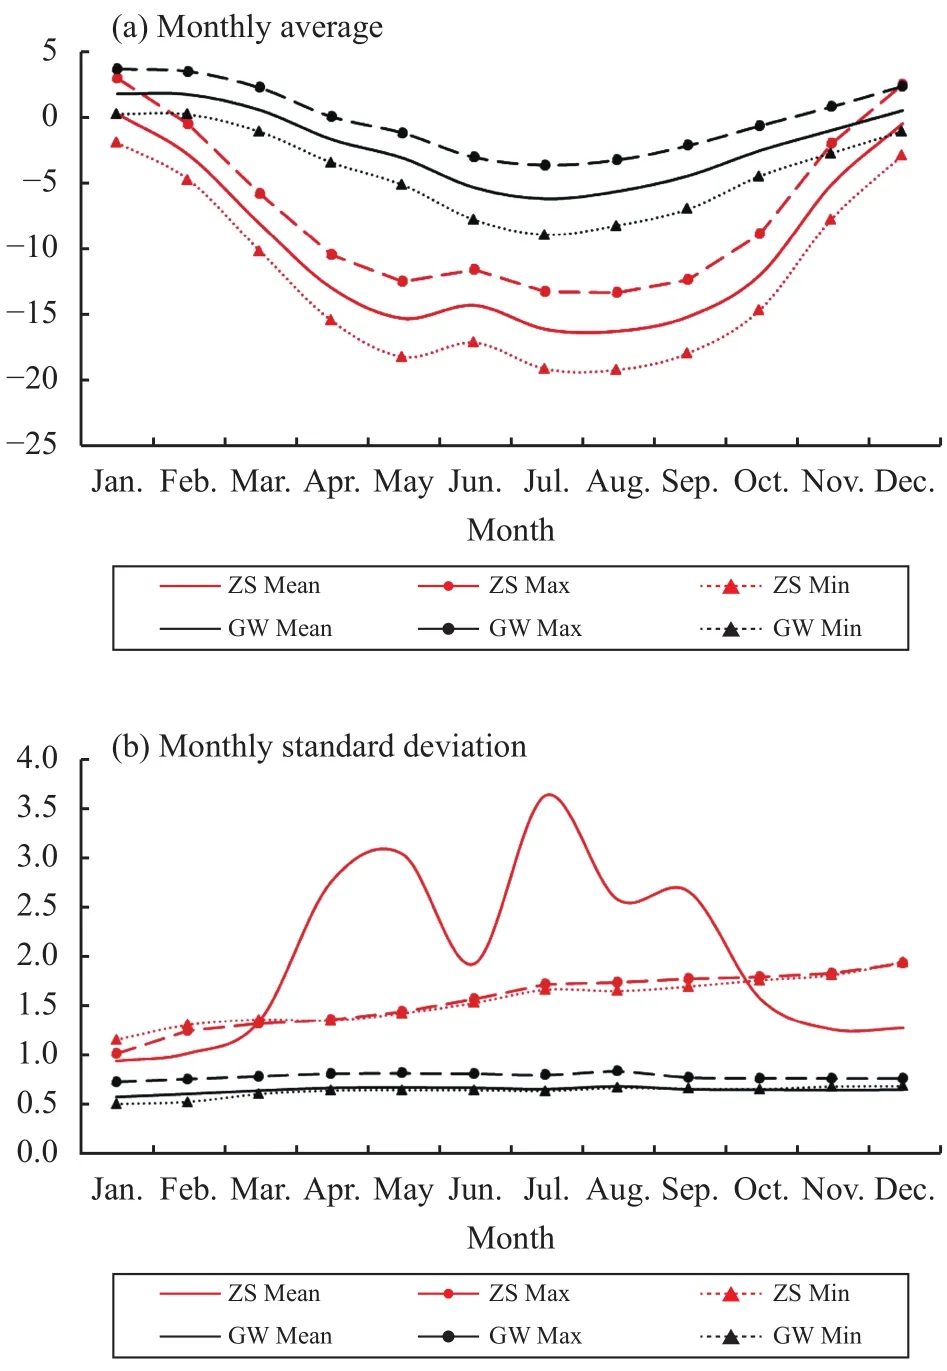
Figure 4 For monthly average and monthly standard deviation for Tmean (solid line), Tmin (dotted line with triangle), and Tmax (broken line with solid circle)(°C) at GW (black) and ZS (red)
In spring, autumn, and winter of the seasons (Figure 4), the monthly meanTmin,Tmax, andTmeanat ZS were obviously lower than those at GW. However, in winter, especially in December and January, the monthly temperatures were similar at the two stations,especially forTmax. Therefore, the temperature range was greater at ZS than at GW, not only for DTR (Figure 3), but also for the annual temperature range (Figure 4). Figure 4 also shows that monthly standard deviation was stable at GW in the last three decades,while it had much more variation at ZS, especially forTmean. GW showed less monthly variation than ZS,which also indicates that GW had more effect from maritime air mass.
3.3 Warm extremes (TXx, TNx, TX90, TN90, MD)at the two stations
Table 2 presents the detailed definitions for warm-extreme indices, and Figure 5 shows the temporal series during 1985–2015 at GW and 1989–2015 at ZS with significantly negative and significantly positive trends. The two stations exhibited a similar trend in both TXx and TNx. For warm days, the index TXx showed the negative trend, with -0.526 °C per decade and -0.475 °C per decade at GW and ZS stations,respectively; and the index TNx for warm nights presented no obvious negative or positive trend at the two stations, including changes with a slightly larger variance at the end of the 1990s and the beginning of the 2000s. However, both TXx and TNx kept feeble magnitudes within 8 °C at the two stations.
For the percentage of days exceeding the 90th percentile, the index TX90 of warm days displayed obviously greater magnitude at GW than at ZS. Especially in the 1990s, TX90 varied much, even up to more than 45% at GW. However, the index TN90 of warm nights changed little at the two stations, almost within 10%, especially at GW. For the melting days,Figure 5 shows that the index MD almost exceeded 40 days at GW almost every year in the last three decades; and it showed the increasing trend of 4.34 d per decade, while MD remained under 40 days at ZS, despite an increasing trend of 0.89 d per decade.
3.4 Cold extremes (TXn, TNn, TX10, TN10) at the two stations
The definitions for cold-extreme indices are shown in Table 2, and Figure 5 demonstrates the annual anomalies series at the two stations. Both TXn and TNn showed a positive trend with 0.279 °C and 1.482 °C per decade at GW, while there was a negative trend, with 1.065 °C and 1.762 °C per decade at ZS. However, the two stations presented a similar trend in both TX10 and TN10, with more variation in magnitude at GW than at ZS. For the percentage of cold days below the 10th percentile, the index TX10 changed little, within 15% (almost within 10%). For cold nights, TN10 varies over a much greater magnitude, almost always beyond 10%, even up to more than 30%.
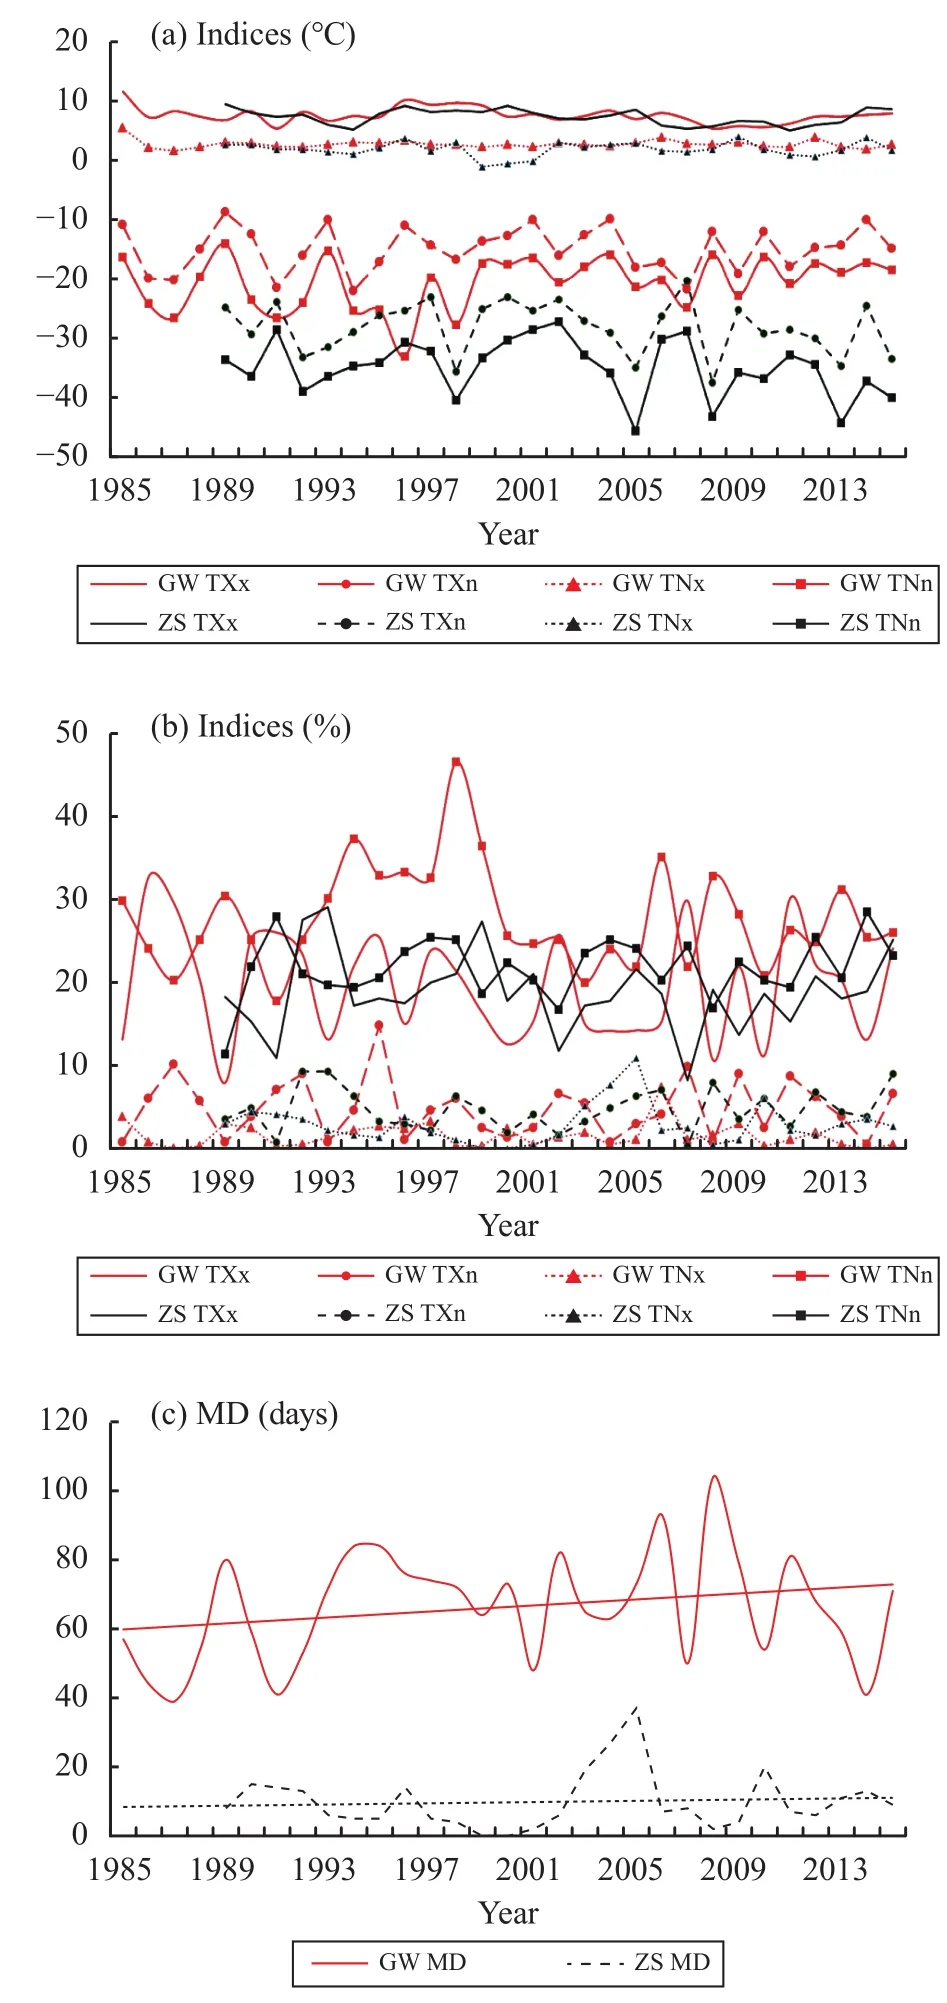
Figure 5 The annual variations during 1985/1989–2015 for indices of temperature extremes, including warm indices(TXx, TNx, TN90, TX90, MD) and cold indices (TXn,TNn, TN10, TX10)
To learn more about the relative variations in the daily temperature distribution, it is necessary to compare the warm and cold indices. For the percentage of extreme indices, TN10 and TX90 presented much greater magnitude than TX10 and TN90. Compared with the warm-extreme indices of TXx and TNx, the cold-extreme indices of TXn and TNn showed much more fluctuation, with the magnitude even up to 19.1 °C. Therefore, we can conclude that some cold extremes (TN10, TXn, and TNn) have varied obviously more than some warm extremes (TN90, TXx,and TNx), while some cold extremes (TX10) seem to have had smaller magnitudes than some warm extremes (TX90). Cold extremes changed greatly in magnitude and mostly happened in nights. Warm extremes varied less and almost occurred in warm days.
4 Discussion and conclusions
The trends comparison of dailyTmean,Tmax, andTminfor the last three decades at GW and ZS in Antarctica demonstrates that annual mean temperature reveals a strong warming inTmin, a slight warming inTmean, with cooling inTmaxand a decrease in DTR.Temperatures showed different seasonal variabilities,with the least variability in summer, and had the typical characteristics of a coreless winter pattern at the two stations. After examining nine indices of temperature extremes, we conclude that extreme-warm days have decreased, while warm nights have shown only a nonsignificant trend, with interannual variability.Cold extremes showed great change in magnitude and mostly happen in nights. Warm extremes varied less and almost occurred in warm days. The number of melting days has increased at GW and denotes a nonsignificant trend at ZS. The maritime air mass has more effect on GW than on ZS because of the geographic location.
More importantly, we have found that inverse variations exist between the two stations on the interannual time scale. Based on the annualTmeanat 2 m from ERA Interim Data (Dee and Uppala, 2009), we demonstrated that the annual mean temperatures at GW have a negative correlation with those in East Antarctica and a positive correlation with those in the Antarctic Peninsula and the surrounding region (Figure 1). To the contrary, the annual temperatures at ZS are correlative with those in East Antarctica and inverse with those surrounding the Antarctic Peninsula.Can the pattern of inverse variations be explained as seesaw or time delay? We shall pay more attention to the causes and mechanism in future research, which is essential to reduce the uncertainty of models and to improve the accuracy of projections.
There are many studies on the bipolar seesaw pattern between Antarctica and Greenland in glacial climate variability and deglacial climate events, and from synchronized and high-resolution ice-core water-stable isotope records during past centuries and millennia or the multidecadal scale variability (Blunier and Brook, 2001; Morganet al., 2002; Stocker and Johnsen, 2003; Barbanteet al., 2006; Chyleket al.,2010; Pedroet al., 2011; Landaiset al., 2015). The detrended multidecadal scale variability of the Arctic and Antarctic temperature time series are highly anticorrelated. When the Arctic warms, Antarctica cools
andvice versa(Chyleket al., 2010). However, there is scant research on the seesaw or time delay between the Antarctic Peninsula and East Antarctica. Because of the short period of observation, there is much to research further on the anticorrelated pattern, especially for the temperature extremes. Unraveling cause and effect, critical for predicting changes to this rapidly evolving ocean–atmosphere–sea ice–ice sheet system,will require more in situ observations, along with improved atmosphere modeling and remote-sensing capabilities. Therefore, future investigation based on model experiments and more datasets of climate-extremes linkage between the Antarctic Peninsula and East Antarctica is required to explore further the detailed mechanism of this physical change. To improve further model results, the effects of more dynamic ocean and sea-ice models should be investigated; and more in situ observations will be of great importance, especially those from the vast interior of Antarctica.
Acknowledgments:
We are thankful for the logistical support provided by the Chinese National Antarctic Research Expedition.This research is funded by the National Natural Science Foundation of China (Grant Nos. 41476164,41671073, 41425003, and 41671063) and the State Key Laboratory of Cryospheric Science. Our sincere appreciation goes to Professor LinGen Bian for providing the meteorological data and to Professors Tuo Chen, CunDe Xiao, ShiChang Kang, and Ian Allison for their insightful comments and suggestions.
 Sciences in Cold and Arid Regions2018年5期
- Sciences in Cold and Arid Regions的其它文章
- Study of thermal properties of supraglacial debris and degree-day factors on Lirung Glacier, Nepal
- Numerical simulation of the climate effect of high-altitude lakes on the Tibetan Plateau
- Comparison of precipitation products to observations in Tibet during the rainy season
- Altitude pattern of carbon stocks in desert grasslands of an arid land region
- Comparison of two classification methods to identify grain size fractions of aeolian sediment
- Effect of slow-release iron fertilizer on iron-deficiency chlorosis, yield and quality of Lilium davidii var.unicolor in a two-year field experiment