Influence of groundwater drawdown on excavation responses-A case history in Bukit Timah granitic residual soils
Wengang Zhang,Wei Wang,Dong Zhou,Runhong Zhang,A.T.C.Goh,Zhongjie Hou
aNational Joint Engineering Research Center of Geohazards Prevention in Reservoir Area Environment,Chongqing University,Chongqing,400045,China
bSchool of Civil Engineering,Chongqing University,Chongqing,400045,China
cSchool of Civil and Environmental Engineering,Nanyang Technological University,639798,Singapore
Keywords:Braced excavation Bukit Timah granitic(BTG)residual soil Wall deflection Groundwater drawdown Empirical charts
A B S T R A C T Performances of a braced cut-and-cover excavation system for mass rapid transit(MRT)stations of the Downtown Line Stage 2 in Singapore are presented.The excavation was carried out in the Bukit Timah granitic(BTG)residual soils and characterized by significant groundwater drawdown,due to dewatering work in complex site conditions,insufficient effective waterproof measures and more permeable soils.A two-dimensional numerical model was developed for back analysis of retaining wall movement and ground surface settlement.Comparisons of these measured excavation responses with the calculated performances were carried out,upon which the numerical simulation procedures were calibrated.In addition,the influences of groundwater drawdown on the wall deflection and ground surface settlement were numerically investigated and summarized.The performances were also compared with some commonly used empirical charts,and the results indicated that these charts are less applicable for cases with significant groundwater drawdowns.It is expected that these general behaviors will provide useful references and insights for future projects involving excavation in BTG residual soils under significant groundwater drawdowns.
1.Introduction
In recent years,a large number of transportation tunnels and mass rapid transit(MRT)stations have been constructed in densely built-up and populated area of Singapore to meet the requirement of urbanization and continuing population growth.As the fifth MRT line in Singapore,the Downtown Line(DTL)is a major MRT line that links downtown area with the northern and eastern parts of Singapore directly.The DTL is being implemented in 3 stages and the stage 2(DTL2)with 16.6 km twin tunnel and 12 underground stations was completed in December 2015.Fig.1 shows the route of DTL2 and distribution of main geological formations in Singapore.
A keychallenge of construction in sensitive areas is to assess and control the impact of construction activities on surrounding buildings and infrastructures.Bukit Timah granitic(BTG)residual soil is the main geological formation in the area where DTL2 stations and tunnels were constructed.However,some studies have confirmed that the BTG residual soil properties have a great spatial variability(Rahardjo et al.,2011,2012;Qian et al.,2016;Moon et al.,2017;Zhang et al.,2018).Due to the hot and humid tropical climate in Singapore,the weathering process of the Bukit Timah granite is extensive and rapid.The large amount of rainfall combined with relative high temperature facilitates the weathering of the bedrock to a vertically varying degree,and the regional nature of bedrock and climatic and topographic conditions result in the degree of weathering of residual soil varying from region to region(Rahardjo et al.,2004).Therefore,the hydromechanical properties of BTG residual soil are complicated.
In Singapore,the groundwater level is about 1-3 m below the ground surface due to the considerable precipitation and the low elevation.Abundant groundwater exerts considerable hydraulic pressure on the underground supporting structure and even flooding accident takes place during underground constructions.Moreover,excessive ground settlement due to dewatering measures of excavation is one of the main reasons for damage of nearby buildings and roads.Some studies focused on underground excavations in permeable strata and analyzed the leakage and seepage problems(Zheng et al.,2014,2018;Goh et al.,2017a,b;2018;Shen et al.,2017;Tan and Lu,2017;Tang et al.,2017;Zhang et al.,2017;Zeng et al.,2018;Xiang et al.,2018),but history cases with significant water level drawdown outside the pit were rarely reported.
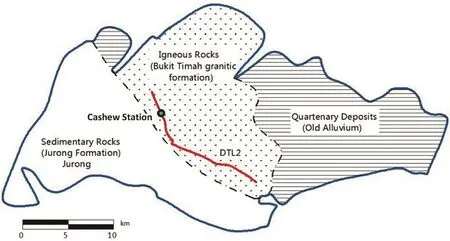
Fig.1.Simplified geological map of Singapore and the location of Cashew station.
Specially,Zhang and Goh(2016)reported an excavation construction of Cashew station(as indicated in Fig.1),which is one of the 12 stations of DTL2 and subjected to significant groundwater drawdown during construction.Meanwhile,they presented the instrumentation results of measured wall deflections and profiles,ground surface settlements,and groundwater level changes.However,the influences of groundwater drawdown on the wall deflections and ground surface settlements were not systematically and numerically back-analyzed.Based on the reported responses,this paper back-analyzes the most typical cross-sections for planestrain calculations.Numerical model is developed and calibrated according to the instrumentation results.Subsequently,parametric studies of groundwater drawdown influences on excavation responses are carried out.It is expected that both the instrumentation data and the numerical results obtained in this paper will provide helpful references and insights for future projects involving excavations in the BTG residual soils,especially when subjected to significant groundwater drawdowns.
2.Project overview
2.1.Site conditions
The excavation is about 225 m long,up to 60 m wide,and 20 m deep.As shown in Fig.2,the Cashew station is located at the intersection of Cashew Road and Upper Bukit Timah Road,with several adjacent buildings.
The ground consists mainly of the man-made fill(denoted as fill),Kallang formation(F1 and F2),BTG residual soil(G VI),completely weathered Bukit Timah granite(G V),highly weathered Bukit Timah granite(G IV),moderately to slightly weathered Bukit Timah granite(denoted as G III and G II,respectively),and fresh rock(represented by G I).According to borehole data,the thickness of fill varies from 1 m to 5 m,and the distribution of the Kallang formation is fragmentary.The residual soil,most concerned in this study,is typically described as soft to stiff sandy silt with thickness of 5-25 m,below which lies the G V layer of 5-15 m in thickness.The G IV layer is a transition zone and is less frequently encountered.The top of G III layer is the rockhead together with the G II and G I layers,and they are regarded as the rock bed.Fig.3 shows the typical strata profiles with field and laboratory test data.Shear strength parameters were obtained by triaxial tests,and permeability was measured using variable-head single-packer test.
2.2.Supporting and monitoring systems
To prevent the damage of surrounding buildings and roads caused by excavation,the earth retaining support system(ERSS)which consisted of 1 m-thick diaphragm wall with the average length of 29 m,4 layers of HY 700 struts and double waler beam HY700 with bracket HY400 was utilized.Fig.4 plots the layout of the supporting system.
Field instrumentations were also installed to monitor the excavation responses.The monitoring system,as shown in Fig.5,included settlement markers(monitoring ground settlement),in wall inclinometers(monitoring lateral wall deflection),and vibrating wire piezometers(monitoring pore water pressure).
2.3.Excavation activities and groundwater response
The main construction activities and the corresponding dates,as well as the construction days,are summarized in Table 1.Construction day 1 denotes the day of June 3,2011,corresponding to the beginning of the excavation of the first level soil at the project site.
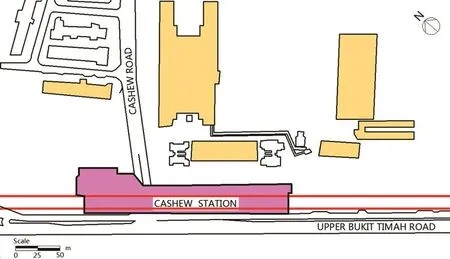
Fig.2.Plan layout of Cashew station and its surroundings.
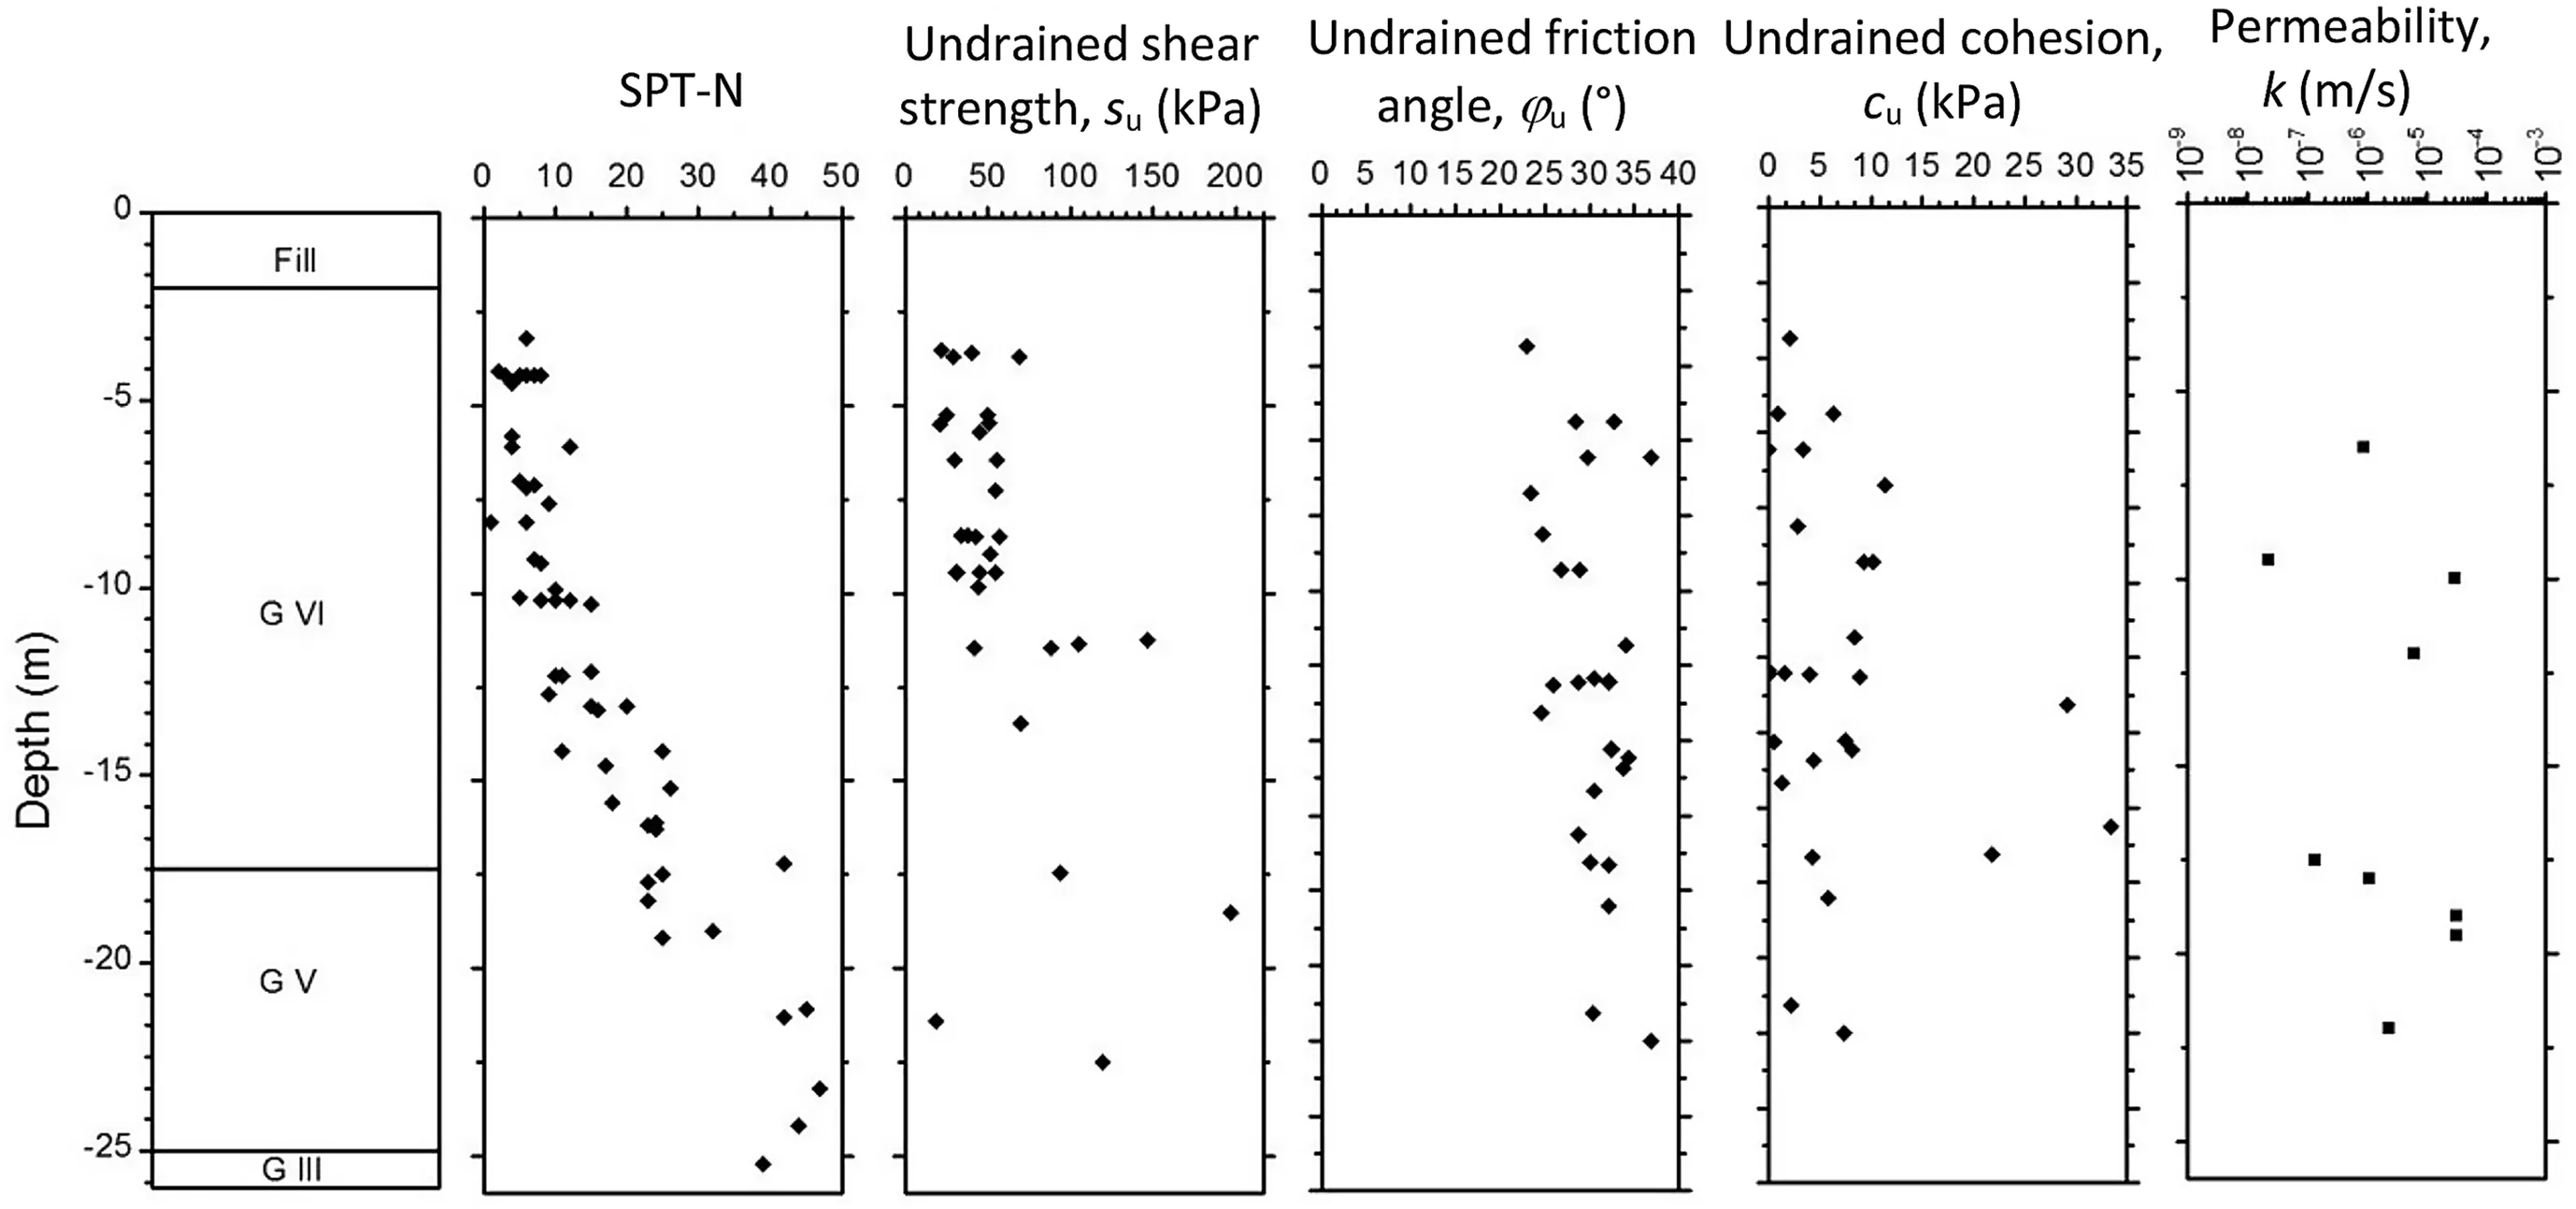
Fig.3.Typical excavation cross-section and borehole profiles with the standard penetration test(SPT)N values.
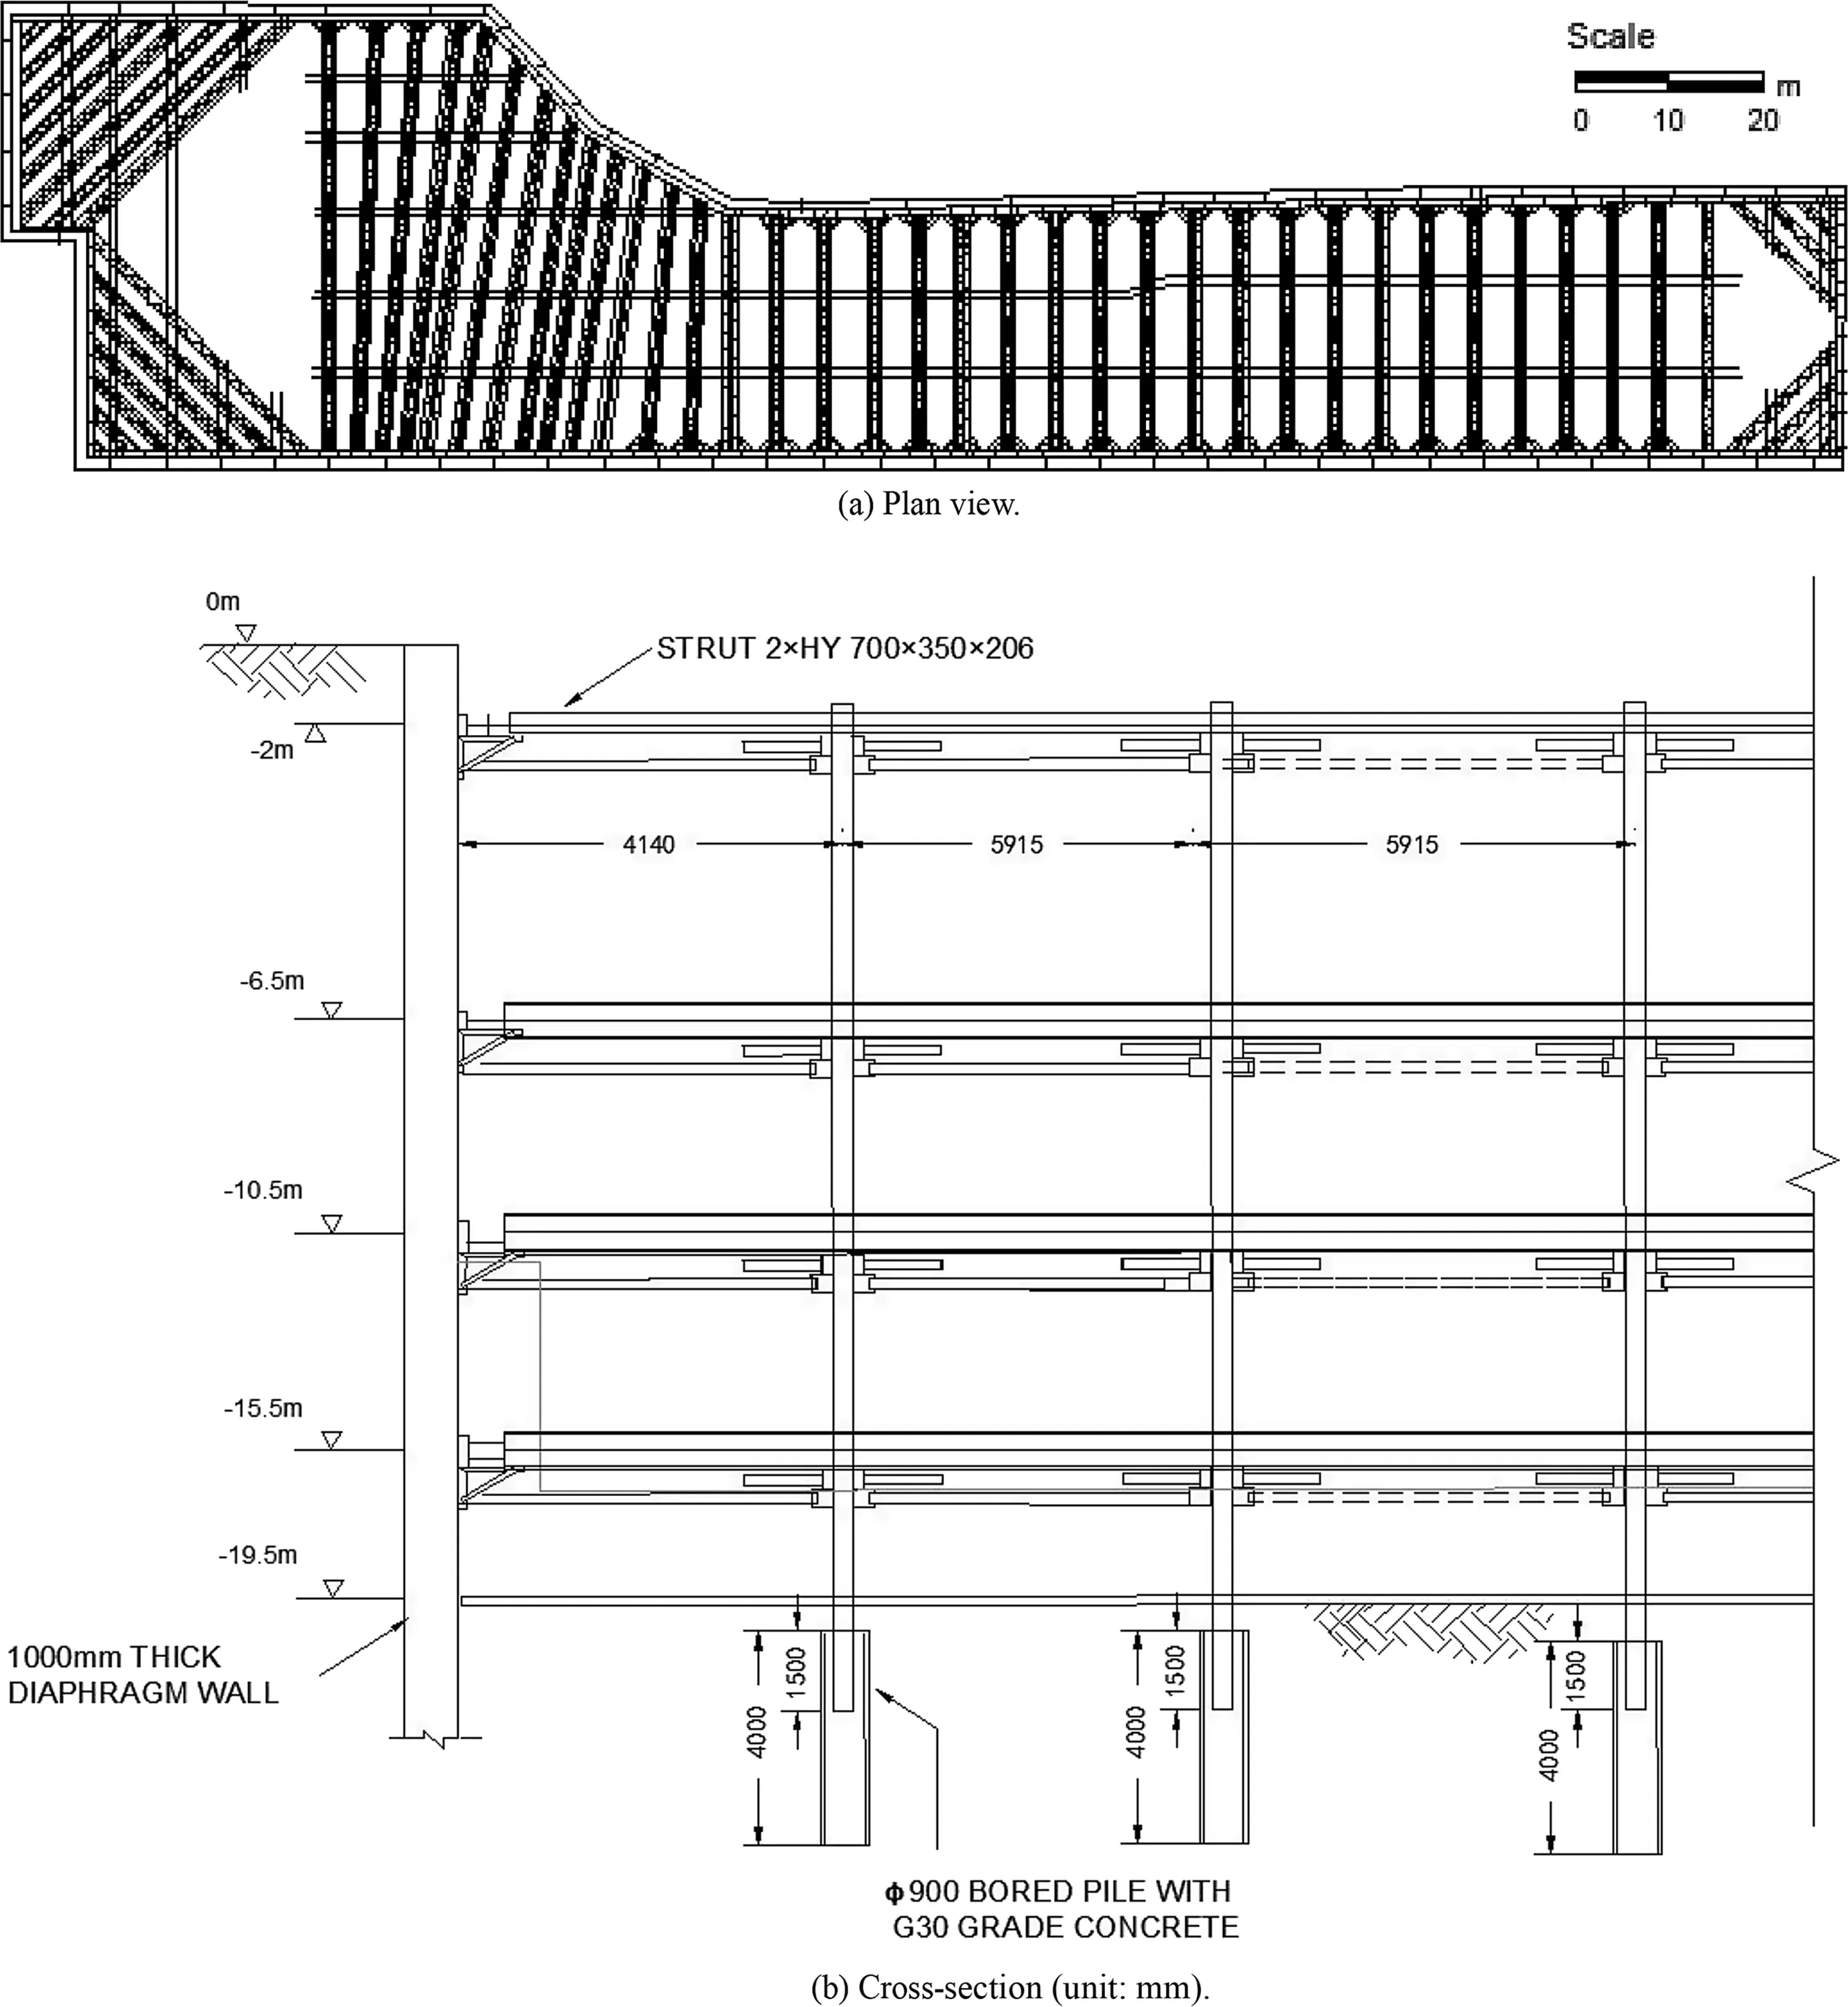
Fig.4.Plan layout of supporting system.
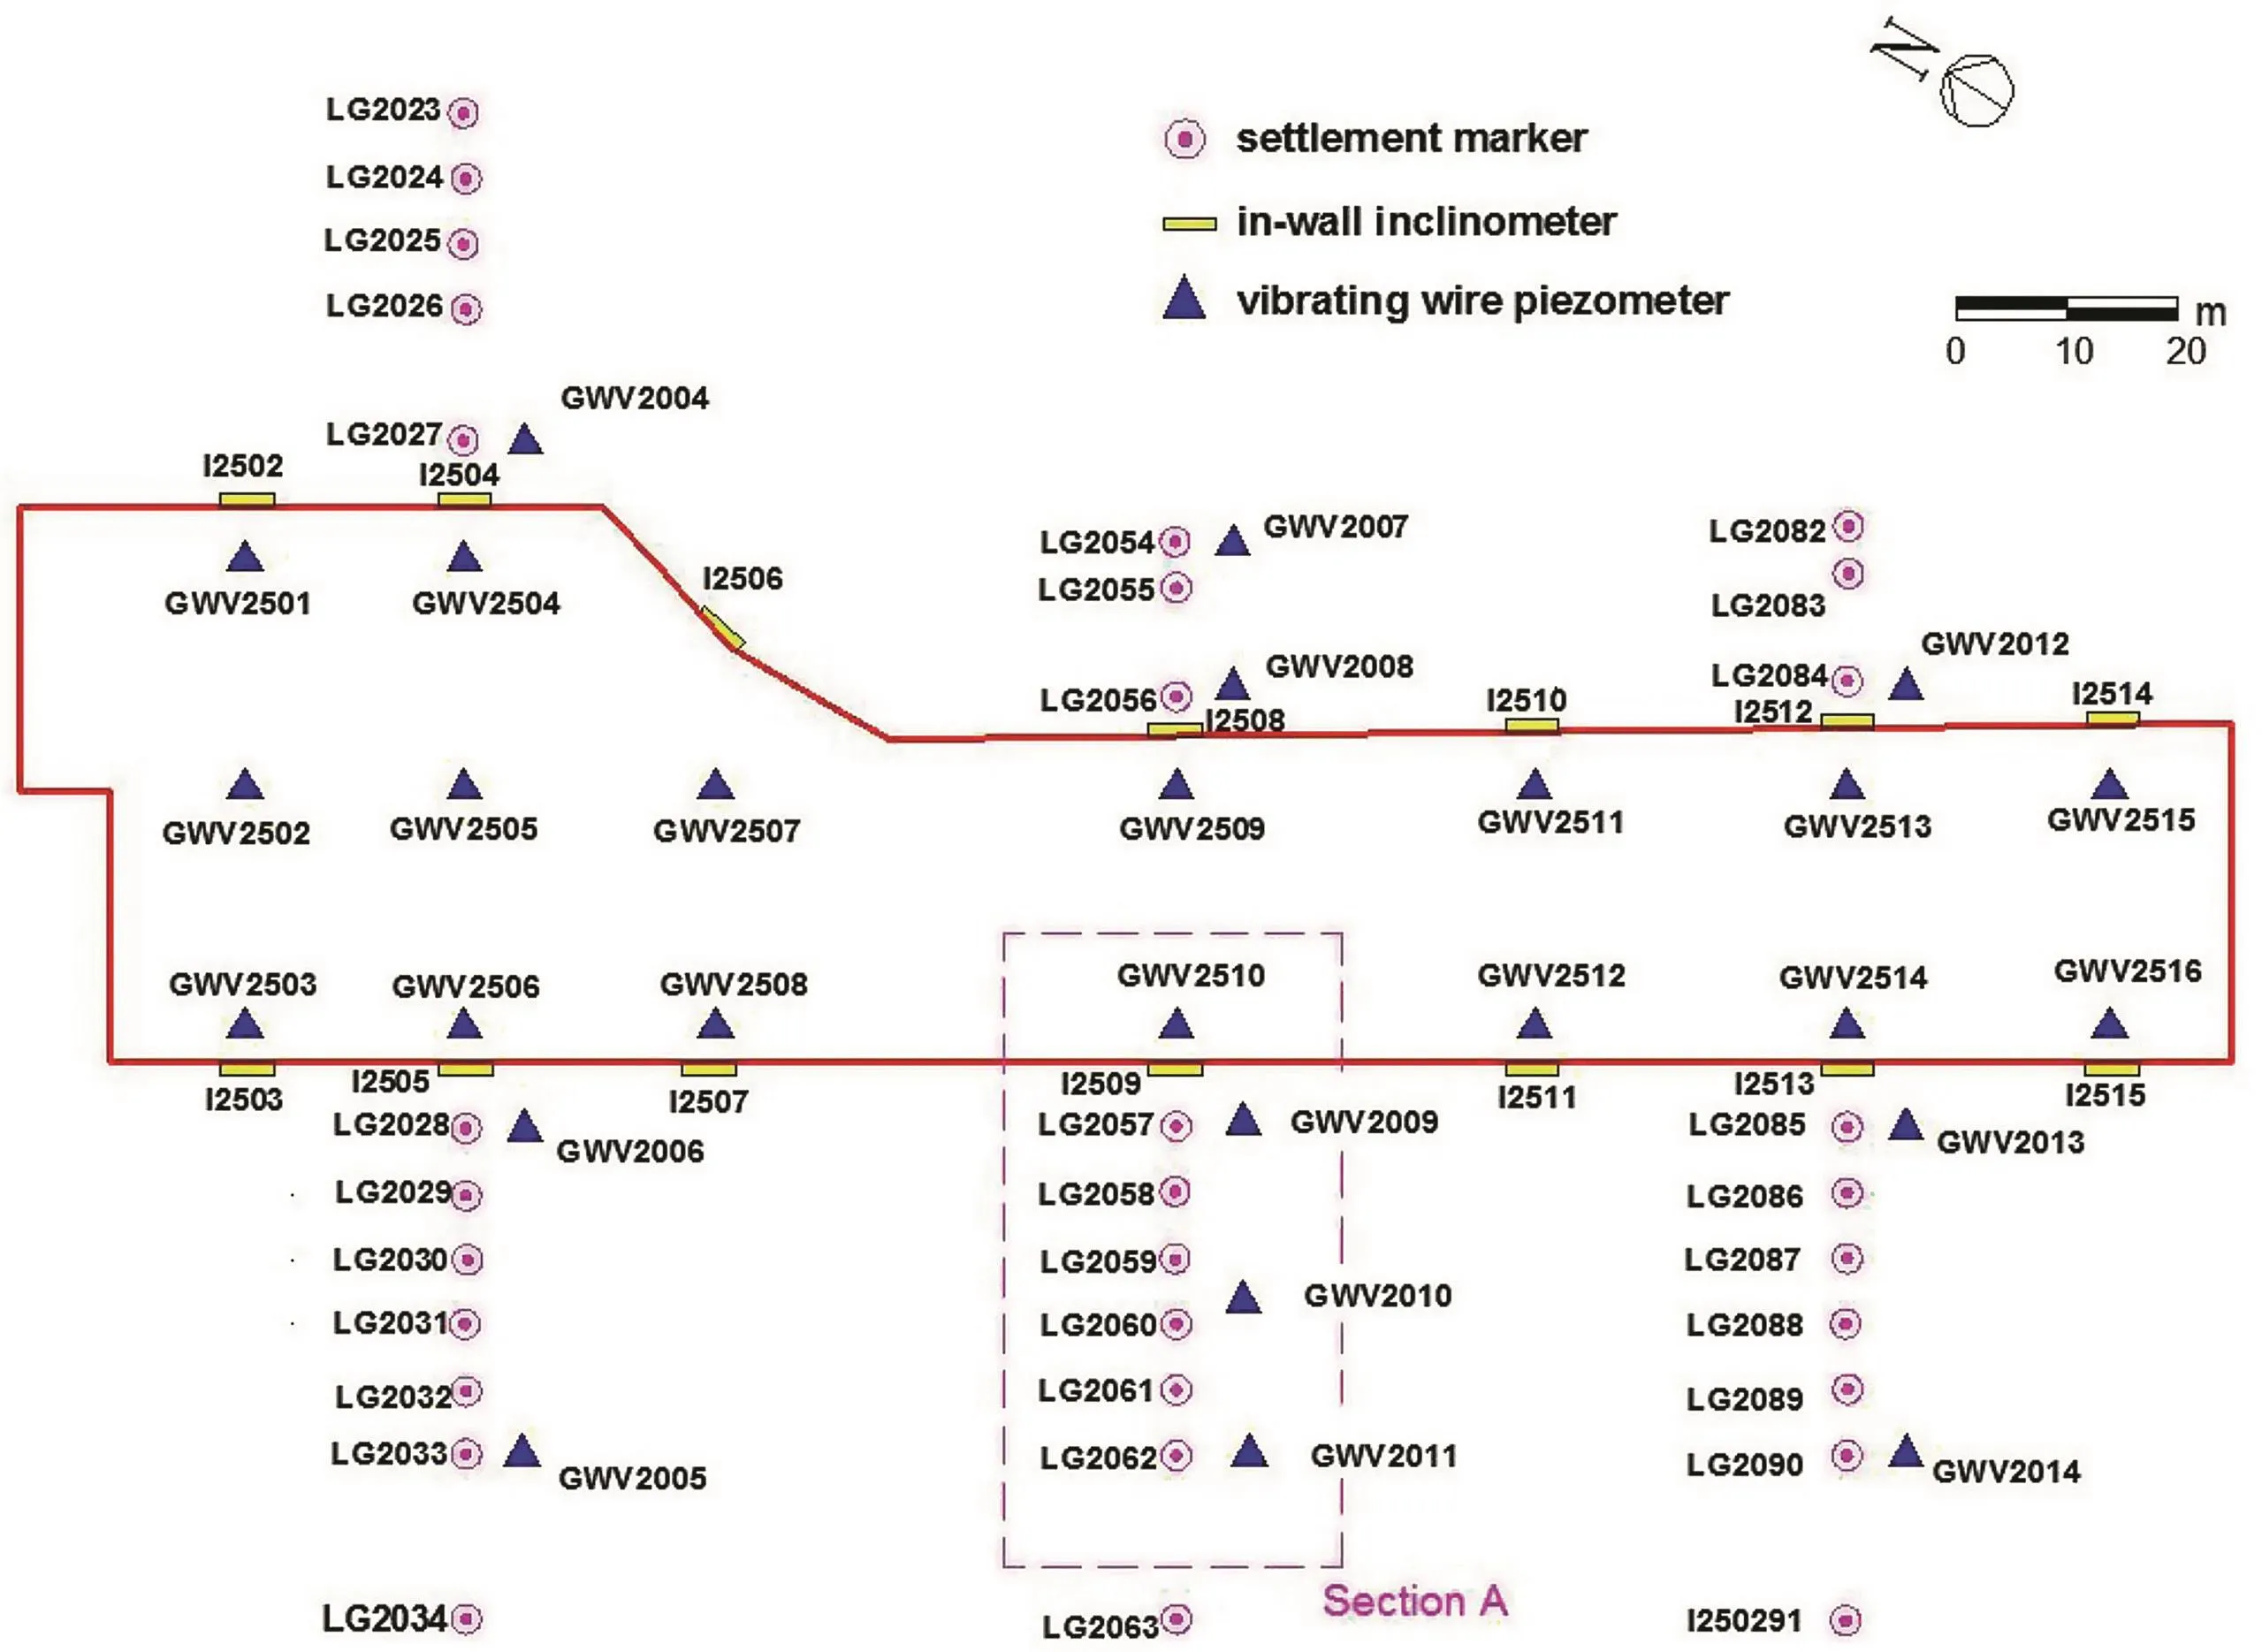
Fig.5.Plan layout of monitoring system.I-in-wall inclinometer;GWV-vibrating wire piezometer;LG-ground settlement marker.
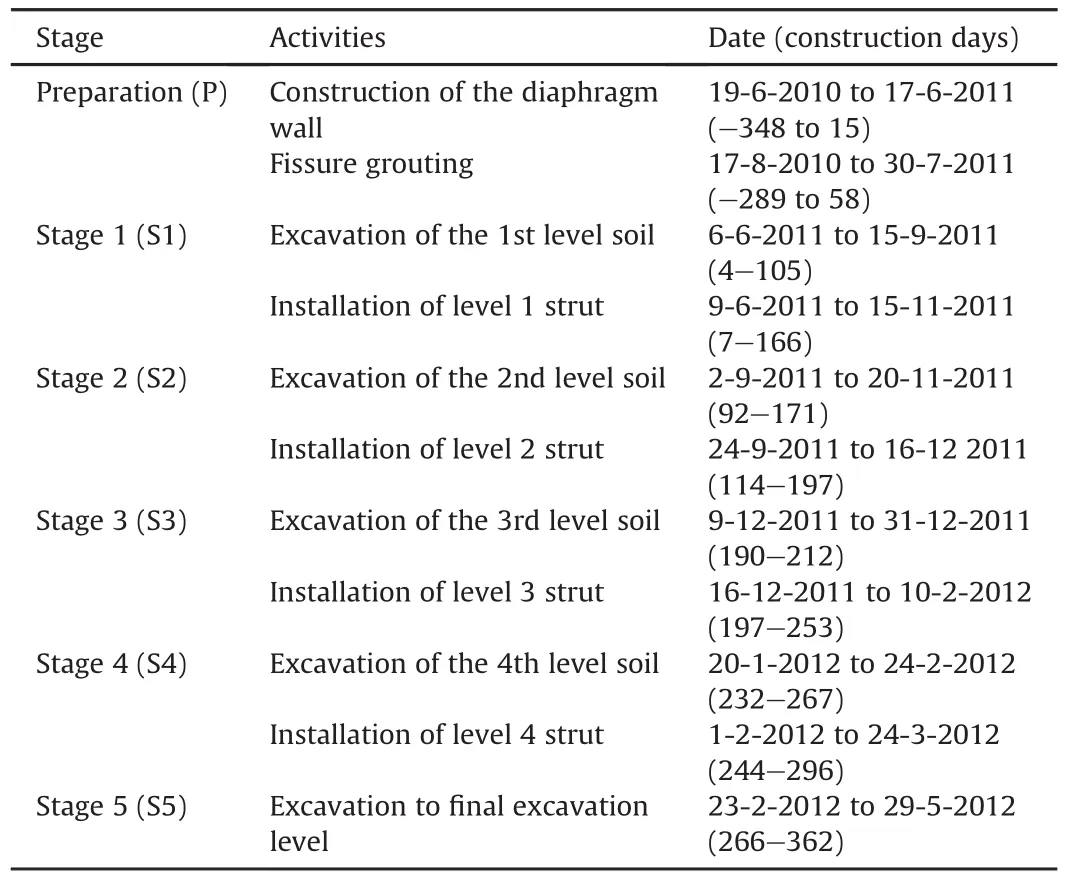
Table 1Excavation activity schedule.
During excavation,it was observed that the piezometer head sharply dropped and a large amount of groundwater discharged into the pit from both the leakage points of the diaphram wall and the bottom of the excavation.Fig.6 shows the recorded piezometric level changes versus the construction day.For GWV2009 and GWV2011,which are respectively 6 m and 34 m from the wall,it is surprising that the piezometer level curves of the two points far away from each other are quite similar,indicating that the extent of groundwater drawdown is great.Similarity can be also observed between GWV2007 and GWV2008.The reasons might be attributed to the following aspects:(1)due to the less satisfactory quality of the diaphragm wall,the groundwater leaks through the poor seams and connections of the wall;(2)the diaphragm wall may not penetrate into the impermeable layers fully,therefore,the groundwater could bypass the toe of the wall and seepage into the excavation;and(3)more permeable,porous and loose silty sand of BTG residual soils or sand pocket provides channels for relatively rapid seepage.Meanwhile,significant ground settlements,which are not allowed in densely built-up urban areas,were also observed.
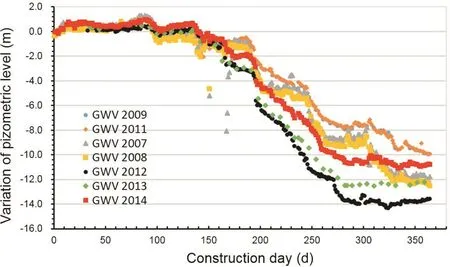
Fig.6.Piezometer records during excavation.
3.Numerical back analysis
3.1.Geometric properties and boundary conditions
A two-dimensional plane-strain finite element(FE)model was developed using the software PLAXIS 2D(PLAXIS,2018)based on section A(Fig.5)since this section is of better instrumentation and can provide more reasonable and accurate data helpful to validate the numerical model.For simplicity,it was assumed that the length of east and west walls is equal to 29 m and different soil layers are horizontal instead of inclined.Thus only half of the excavation model was built due to symmetry.Fig.7 shows the sketch of the FE model used in this study.Both the left and right side boundaries were constrained by roller fixities which do not allow displacement in the perpendicular direction,i.e.horizontal displacement.The bottom boundary was restrained in all directions while the top boundary was free.Considering extra load from surrounding circumstances,a surcharge of 20 kPa was applied on the ground surface within the zone of 20 m away from the excavation.Initial groundwater level was 2 m below the ground surface,i.e.112 mRL(reduced level).
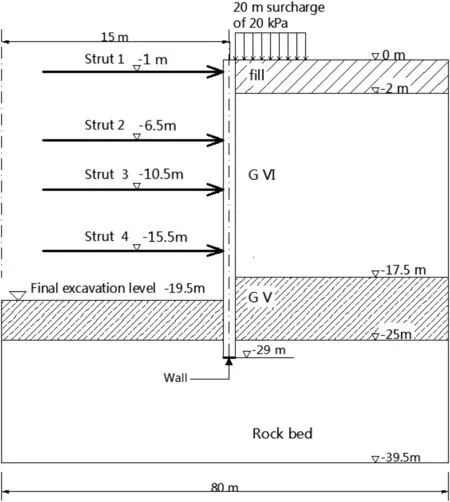
Fig.7.Numerical model for back analysis.
3.2.Constitutive models and parameters
The soils were simulated by fourth-order 15-node triangular elements with hardening soil(HS)elastoplastic constitutive model adopting Duncan-Chang hyperbolic model and Mohr-Coulomb failure criterion,which is proper in simulation of excavations in view of its hardening behaviors that the stiffness depends on stress and loading-unloading stiffness behaves differently(Schanz et al.,1999).The parameters obtained according to both the soil tests and the numerical back analyses are presented in Table 2.The diaphragm wall was modeled by linear elastic plate element,with EA=2.8×10⁷kN/m and EI=1.8×10⁶kN m2/m,where EA is the axial stiffness,and EI is the bending stiffness.Ignoring the potential bending behavior,struts were considered as liner elastic fixed-end anchors,as listed in Table 3 (negative preloading indicates compression).

Table 2Material parameters used for numerical simulation.

Table 3Strut parameters.
3.3.Simulation of excavation and dewatering
The groundwater drawdown is significant due to the possible reasons mentioned above.However,it is quite difficult to set the hydraulic boundary conditions during excavation since the real discharge field was unclear in view of the limited number of piezometers installed.Procedure controlling the static pore water pressure was adopted to simulate the process of groundwater drawdown.The excavation procedures are listed in Table 4,the excavation depth H for each stage was 2 m,6.5 m,10.5 m,15.5 m and 19.5 m,respectively,while the corresponding drawdown outside the excavation,Hd,was 4 m,6 m,9.5 m,11 m and 13 m,respectively,which was in accordance with the instrumented piezometer records in Fig.6.
3.4.Comparison between computed results and field measurements
Observed lateral wall deflection profile at the middle of west side of the excavation(most typical of plane-strain analysis)was obtained from the in-wall inclinometer I2509(Fig.5).Both the measured and computed wall deflection profiles at the final stage of excavation are shown in Fig.8a.The magnitudes of the computed lateral displacement are generally in good agreement with the measured results.However,the trends of profiles are slightly different.As shown in Fig.8a,for the measured results,the profile shows distinct concave at depths of 1 m and 10 m where the first and third-level struts are located,respectively,while the profile of the computed results is more smooth.The difference is most probably due to the assumption that the diaphragm wall wasassumed as linear elastic in the numerical analysis,but the actual behaviors of the reinforced concrete walls were elastoplastic and the wall was partially yielded.
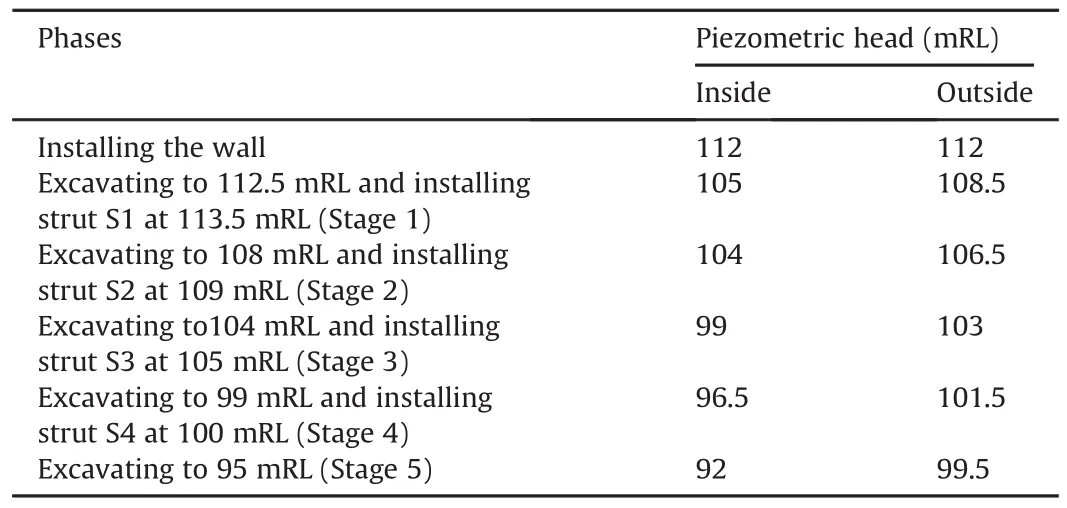
Table 4Excavation and dewatering procedures of field case.
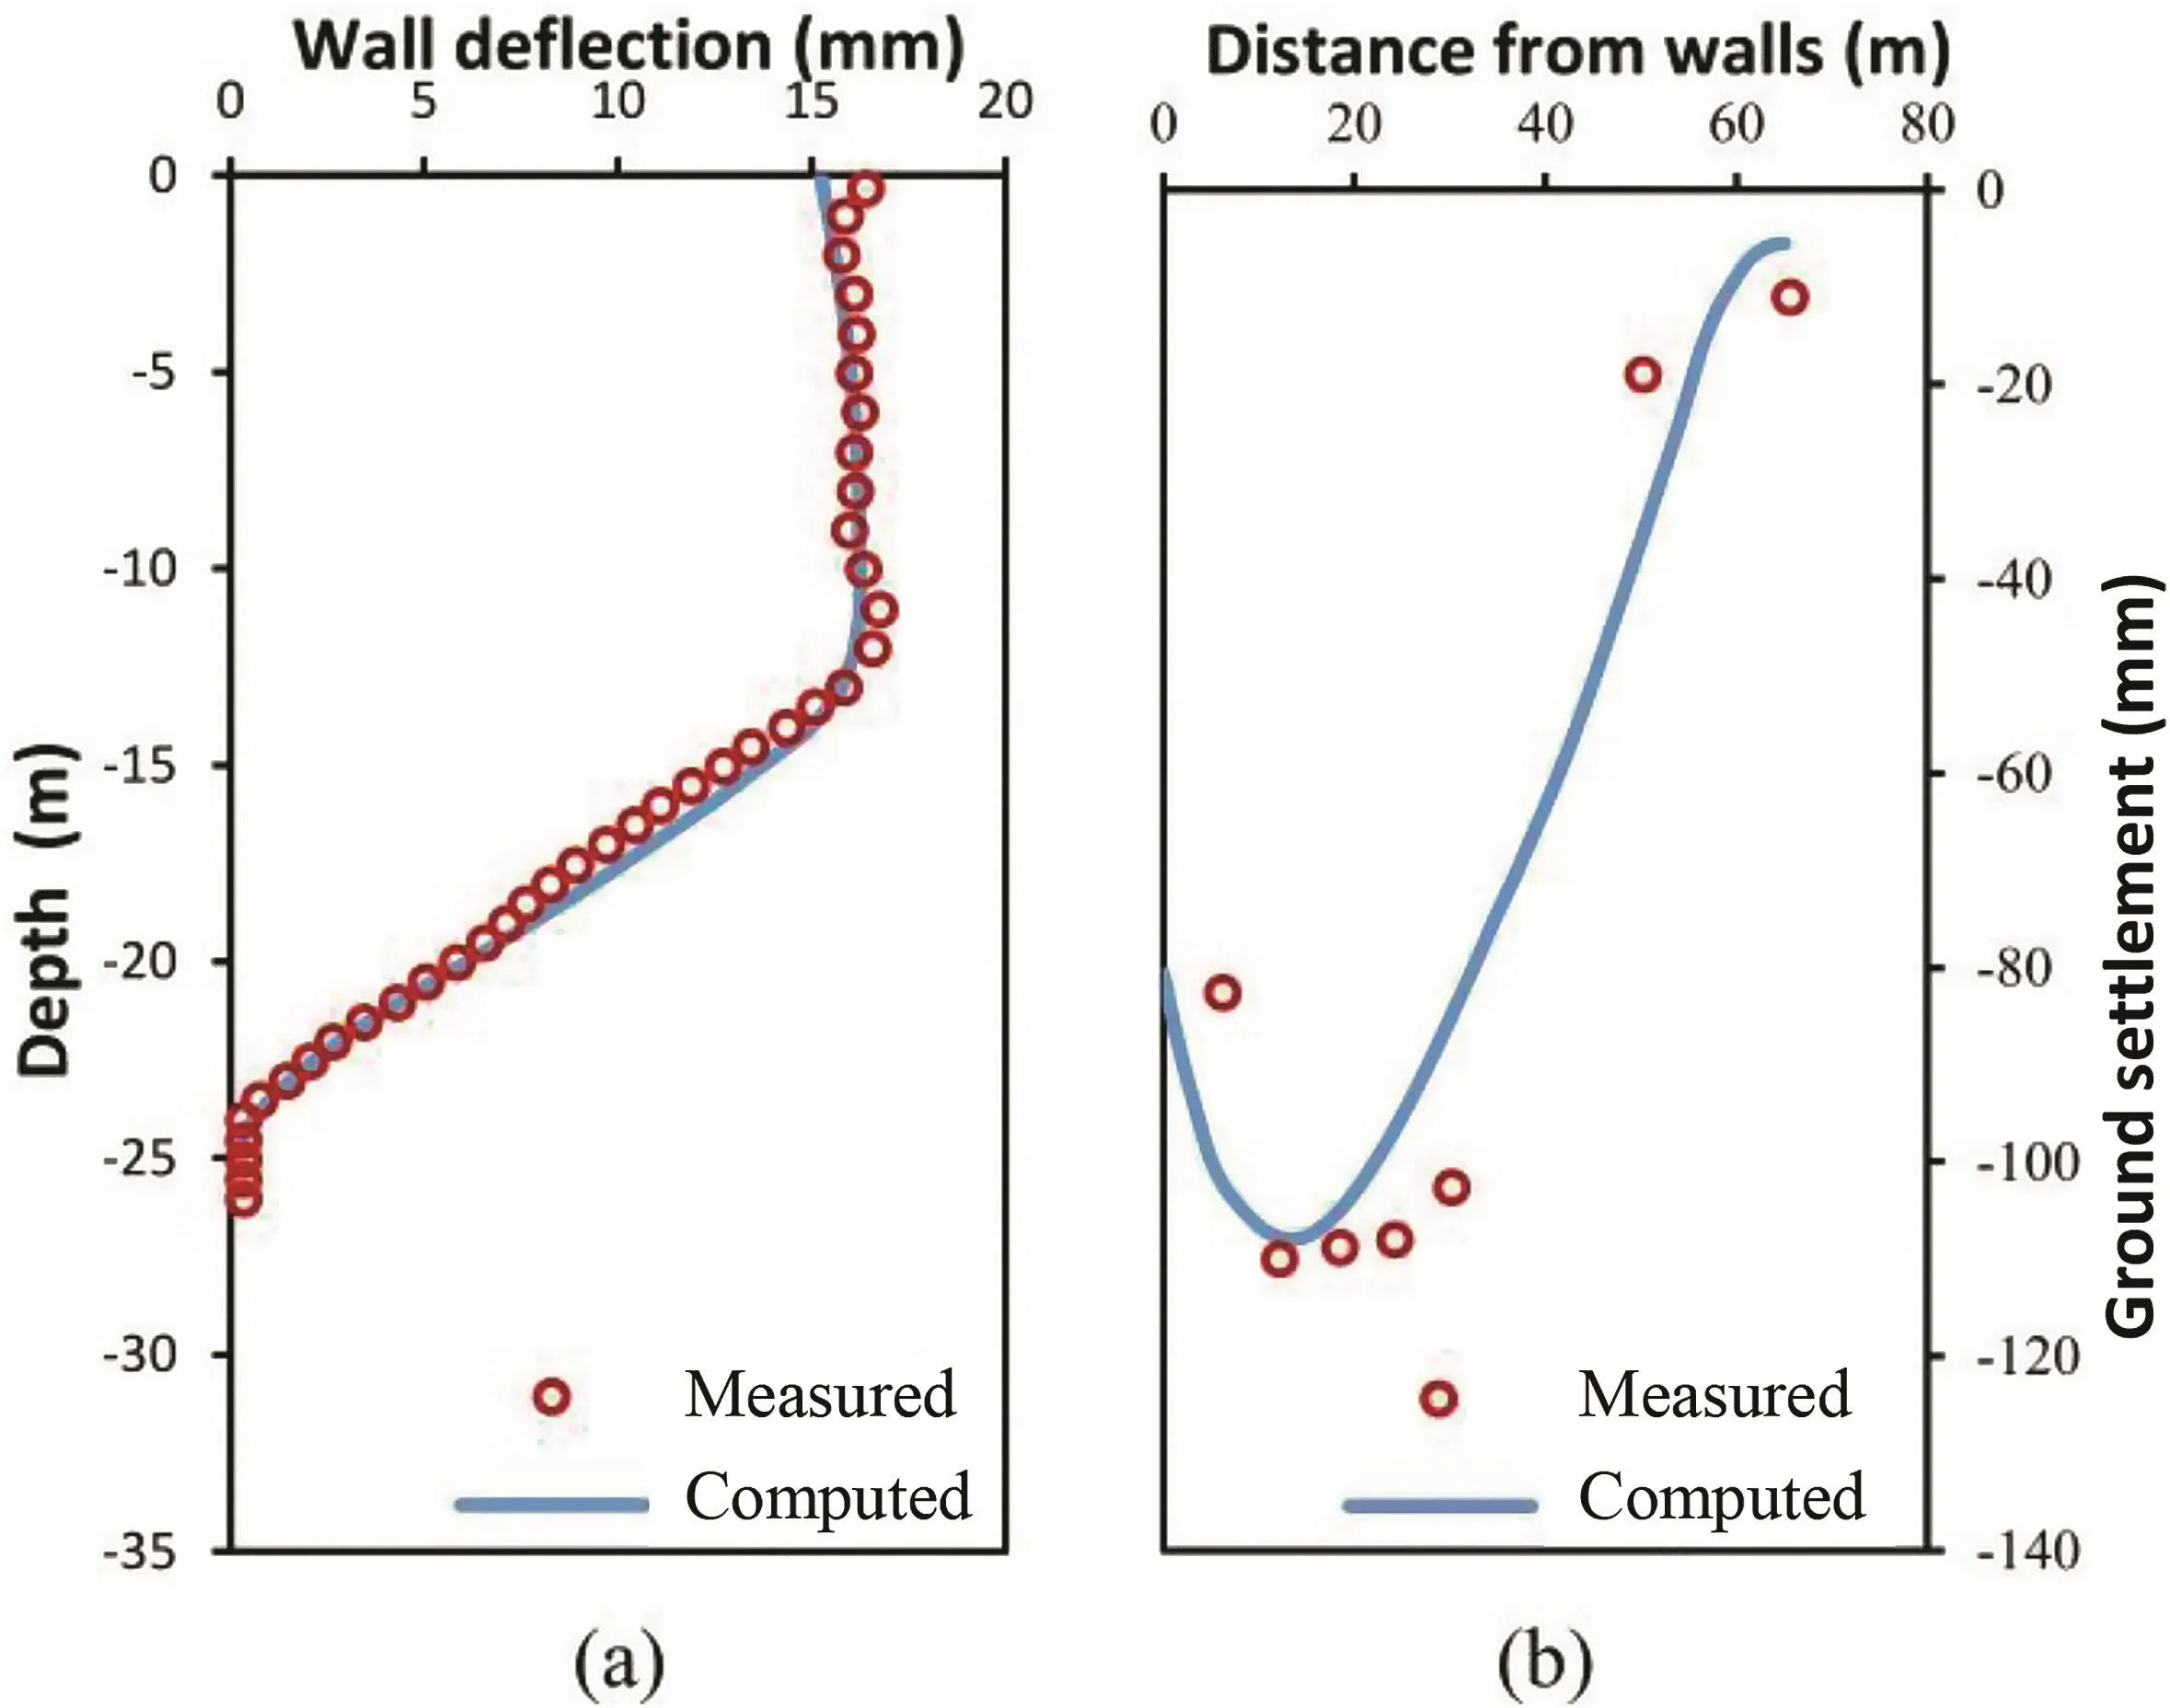
Fig.8.Comparisons of measured and computed excavation responses.
Data of the measured ground settlements are well documented.Settlement markers denoted by LG2057,LG2058,LG2059,LG2060,LG2061,LG2063 and LG2064(LG2062 was missing),which were 6.2 m,12.2 m,18.5 m,24.2 m,30.2 m,50.2 m and 65.6 m away from the wall(Fig.5),respectively,were adopted for ground settlement monitoring.Fig.8b shows the comparison of the measured and computed ground surface settlements,indicating a slight underestimate of both the maximum ground settlement and the width of the settlement trough.It is probably due to that the seepage force,which influences the ground settlements more or less,was ignored in the numerical calculation.However,considering that the underestimate of the maximum ground settlement is less than 2%,it is deemed that the numerical simulation results are fairly consistent with the measured data.
3.5.Influences of drawdown depth on wall deflection and ground settlement
To evaluate the influences of drawdown on excavation responses,4 cases with different dewatering conditions were simulated.In case 1,the groundwater drawdown outside the excavation is 0 and the groundwater level is kept 3 m below the formation level.In cases 2-4,the water drawdowns outside the excavation are 1 m,2 m and 3 m for each stage,respectively,with the total drawdown in the final stage,Hd,of 5 m,10 m and 15 m accordingly.These cases are summarized in Table 5.
For simplicity,only the results of final stage for different cases are demonstrated in Fig.9.It is obvious that with the increase in groundwater drawdown,less hydraulic pressure is exerted on the retaining wall,resulting in much smaller wall deflections.However,the location(depth)where the maximum wall deflection takes place is almost not influenced by the magnitude of drawdown and the profiles are also similar to each other since the wall penetrates into rock bed(Fig.9a).
The ground settlement outside the excavation increases by a large amount due to the consolidation induced by the increased effective stresses resulting from the significant groundwater drawdown(Fig.9b).It is obvious that both the maximum settlement and the settlement trough of case 2 are much greater than those of case 1.With the same increase in groundwater drawdown of 5 m,the difference in the maximum settlement and the settlement trough between cases 2 and 3 is less than those between cases 1 and 2.From cases 3 to 4,the maximum settlement increases only by 5 mm and the increase of the settlement trough width iscritical.That is,the first 5 m drawdown induces the largest settlement.With the same increase in effective stress of 50 kPa,the following 5 m drawdown causes less settlement since the thickness of the compressible layer becomes smaller.
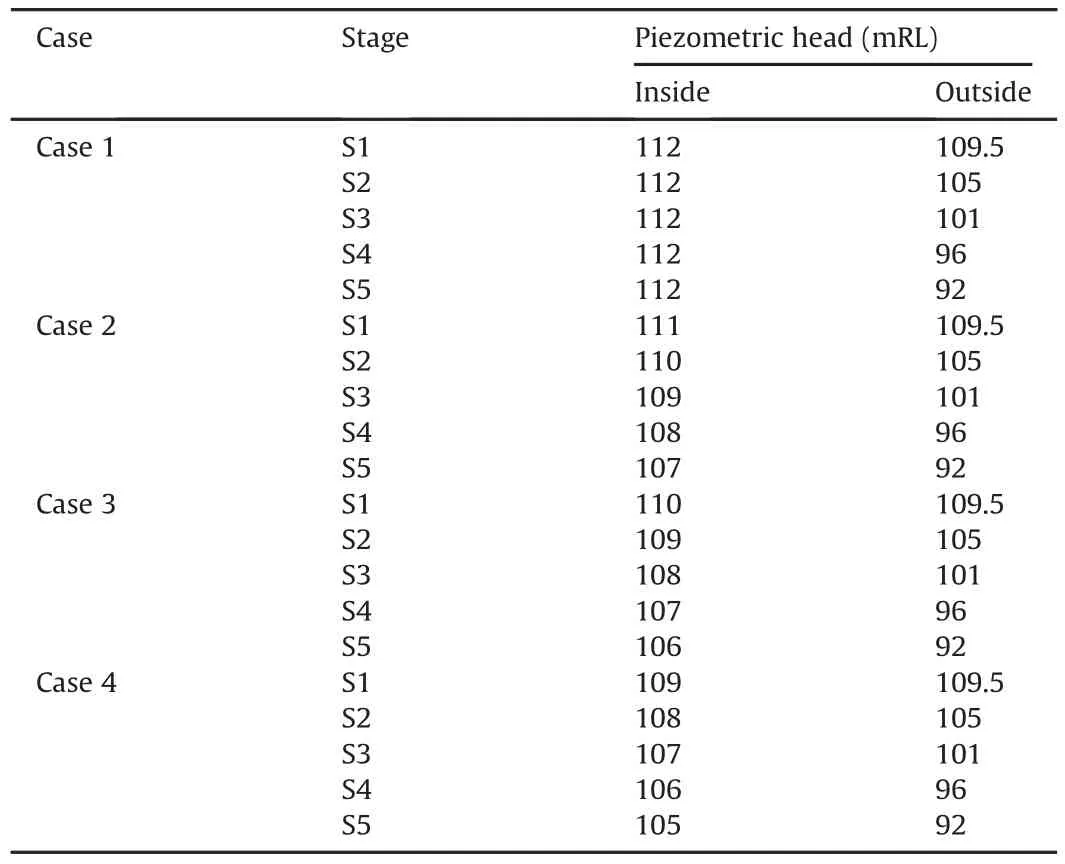
Table 5Cases for parametric study of different drawdown depths.
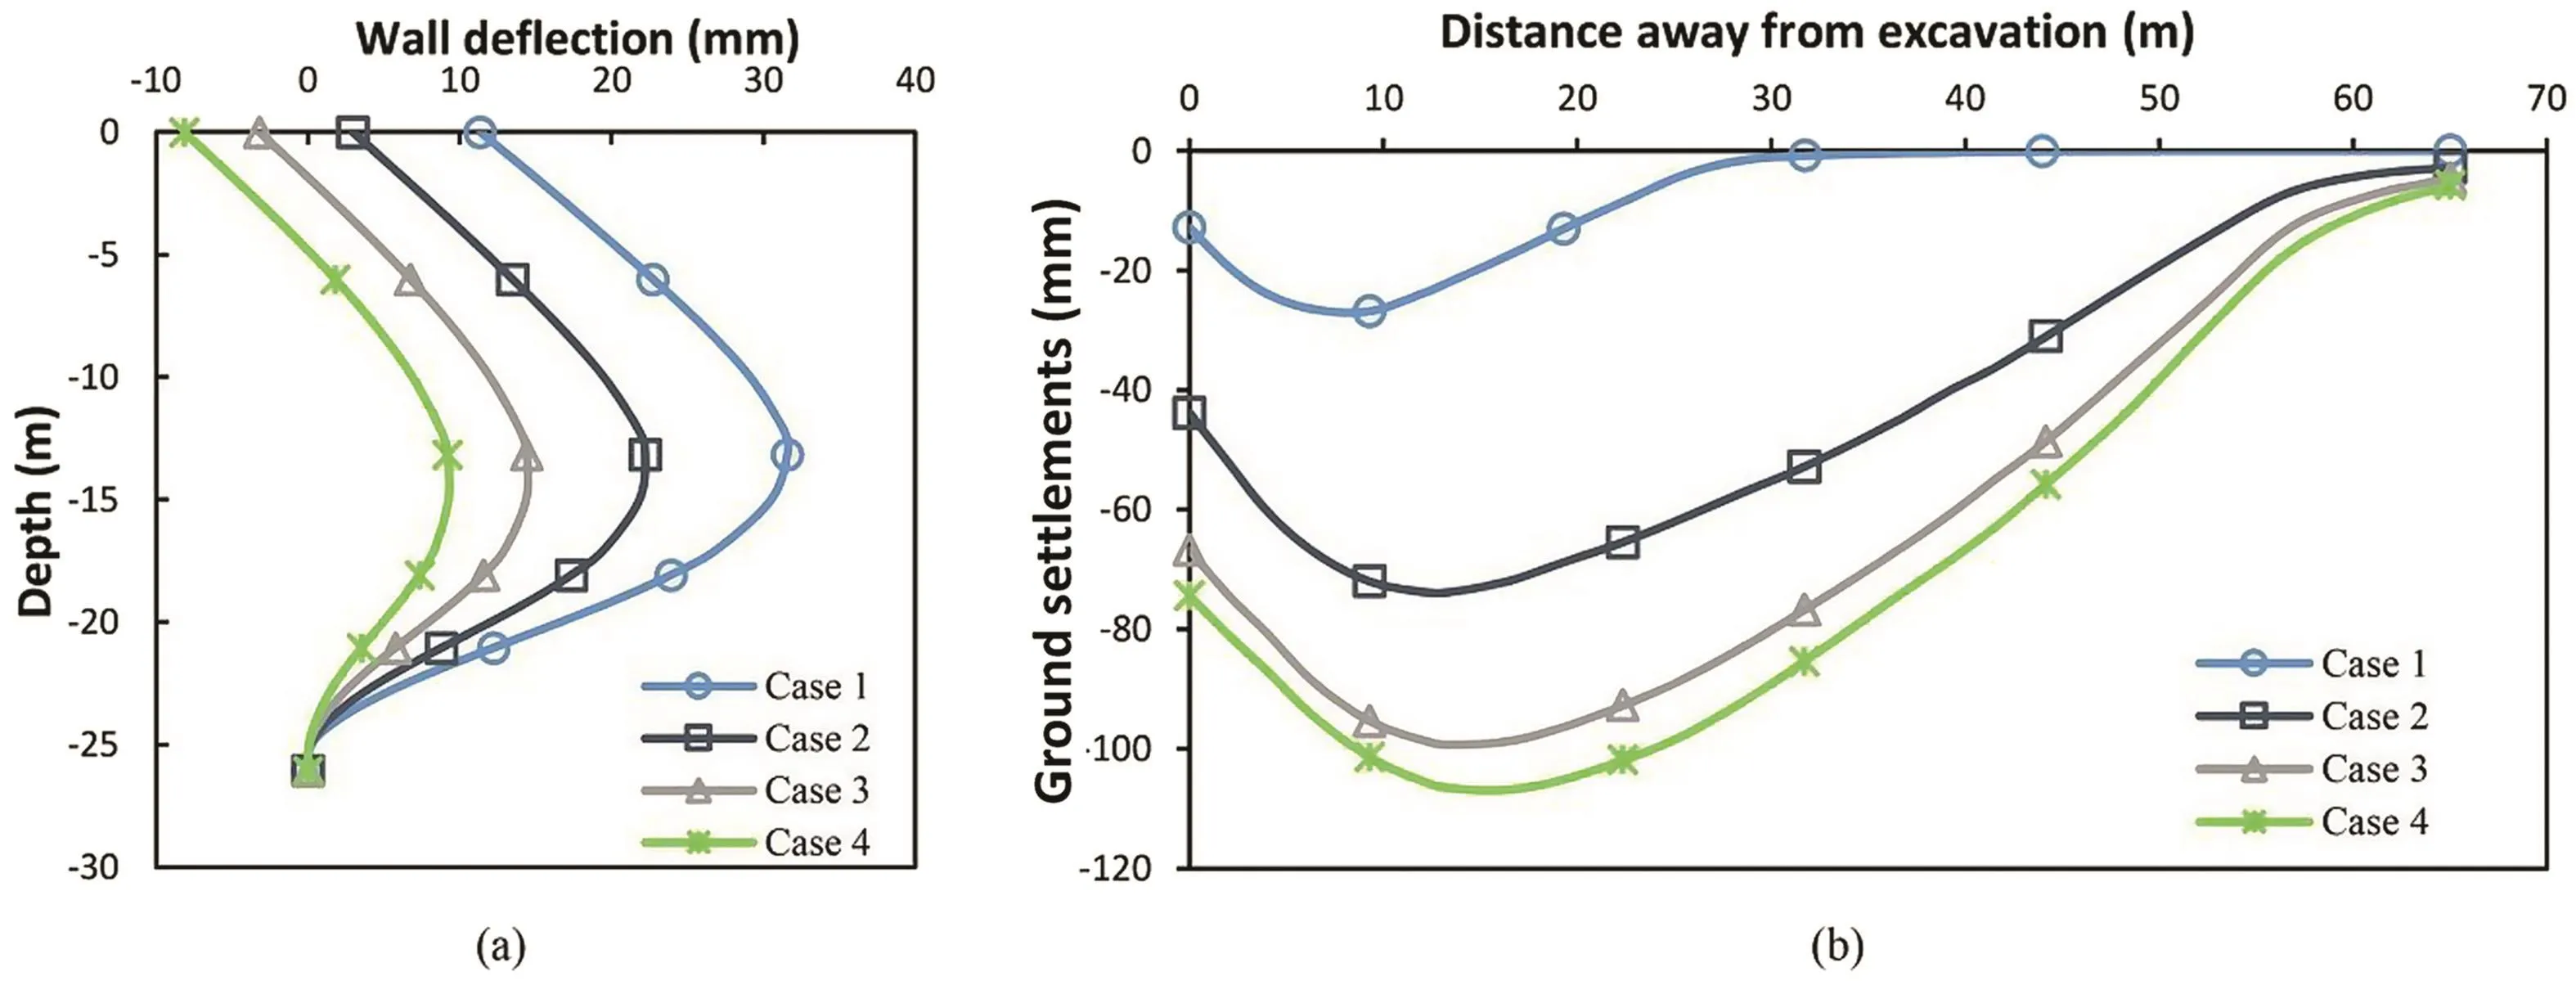
Fig.9.Excavation responses under different drawdown depths.
3.6.Comparison with the empirical methods and case histories
The measured data and the numerical results of the final stage were compared with the empirical charts.Clough and O’Rourke(1990)indicated thatδhm/H is around 0.2%with the upper bound of 0.5%,whereδhmis the maximum wall deflection.Ou et al.(1993)summarized a large number of historical cases and concluded that δhm/H generally ranges from 0.2%to 0.5%.Wong et al.(1997)reported a braced excavation in residual soils in Singapore and suggested an average value of 0.2%and an upper bound of 0.35%.However,the information of groundwater drawdown was not mentioned in these researches.As shown in Fig.10,the measured and calculated wall deflections are consistent with each other and the values are relatively small,withδhm/H generally less than 0.1%,suggesting that the normalized values in the literature are less applicable for cases considering the groundwater drawdown effect.
Compared with the large excavation(Tan et al.,2018)conducted in Suzhou stiff clay overlying a sandy confined aquifer with dramatic artesian level drawdown(maximum of 14 m)outside the pit,the magnitude of wall deflection was also much smaller.It was attributed to the more flexible earth retaining system and the unaltered lateral pressure on the wall,because the drawdown did not occur in phreatic layer beyond the wall toe in Suzhou stiff clay.
Clough and O’Rourke(1990)also summarized the relationship between the maximum ground surface settlement and excavation depth and concluded that δvm/H(where δvmis the maximum ground settlement)is averaged at 0.15%with the upper limit of 0.5%,as shown by the green dashed line in Fig.11.According to the worldwide database compiled by Long(2001),the averageδvm/H is around 0.39%,while Wong et al.(1997)reported that it is almost less than 0.35%.The measuredδvm/H agreed well with that obtained by Long(2001)although the groundwater conditions were treated separately.The result of case 1 agrees with the averageδvm/H value of 0.15%predicted by Clough and O’Rourke(1990).For the measured and numerical results with significant groundwater drawdowns,δvm/H exceeds the line of 0.35%and even moves to the upper bound of 0.5%.
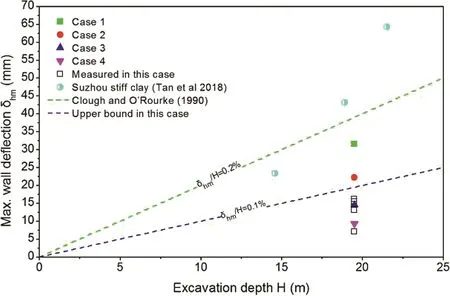
Fig.10.Comparison of the maximum wall deflection with empirical methods and history cases.
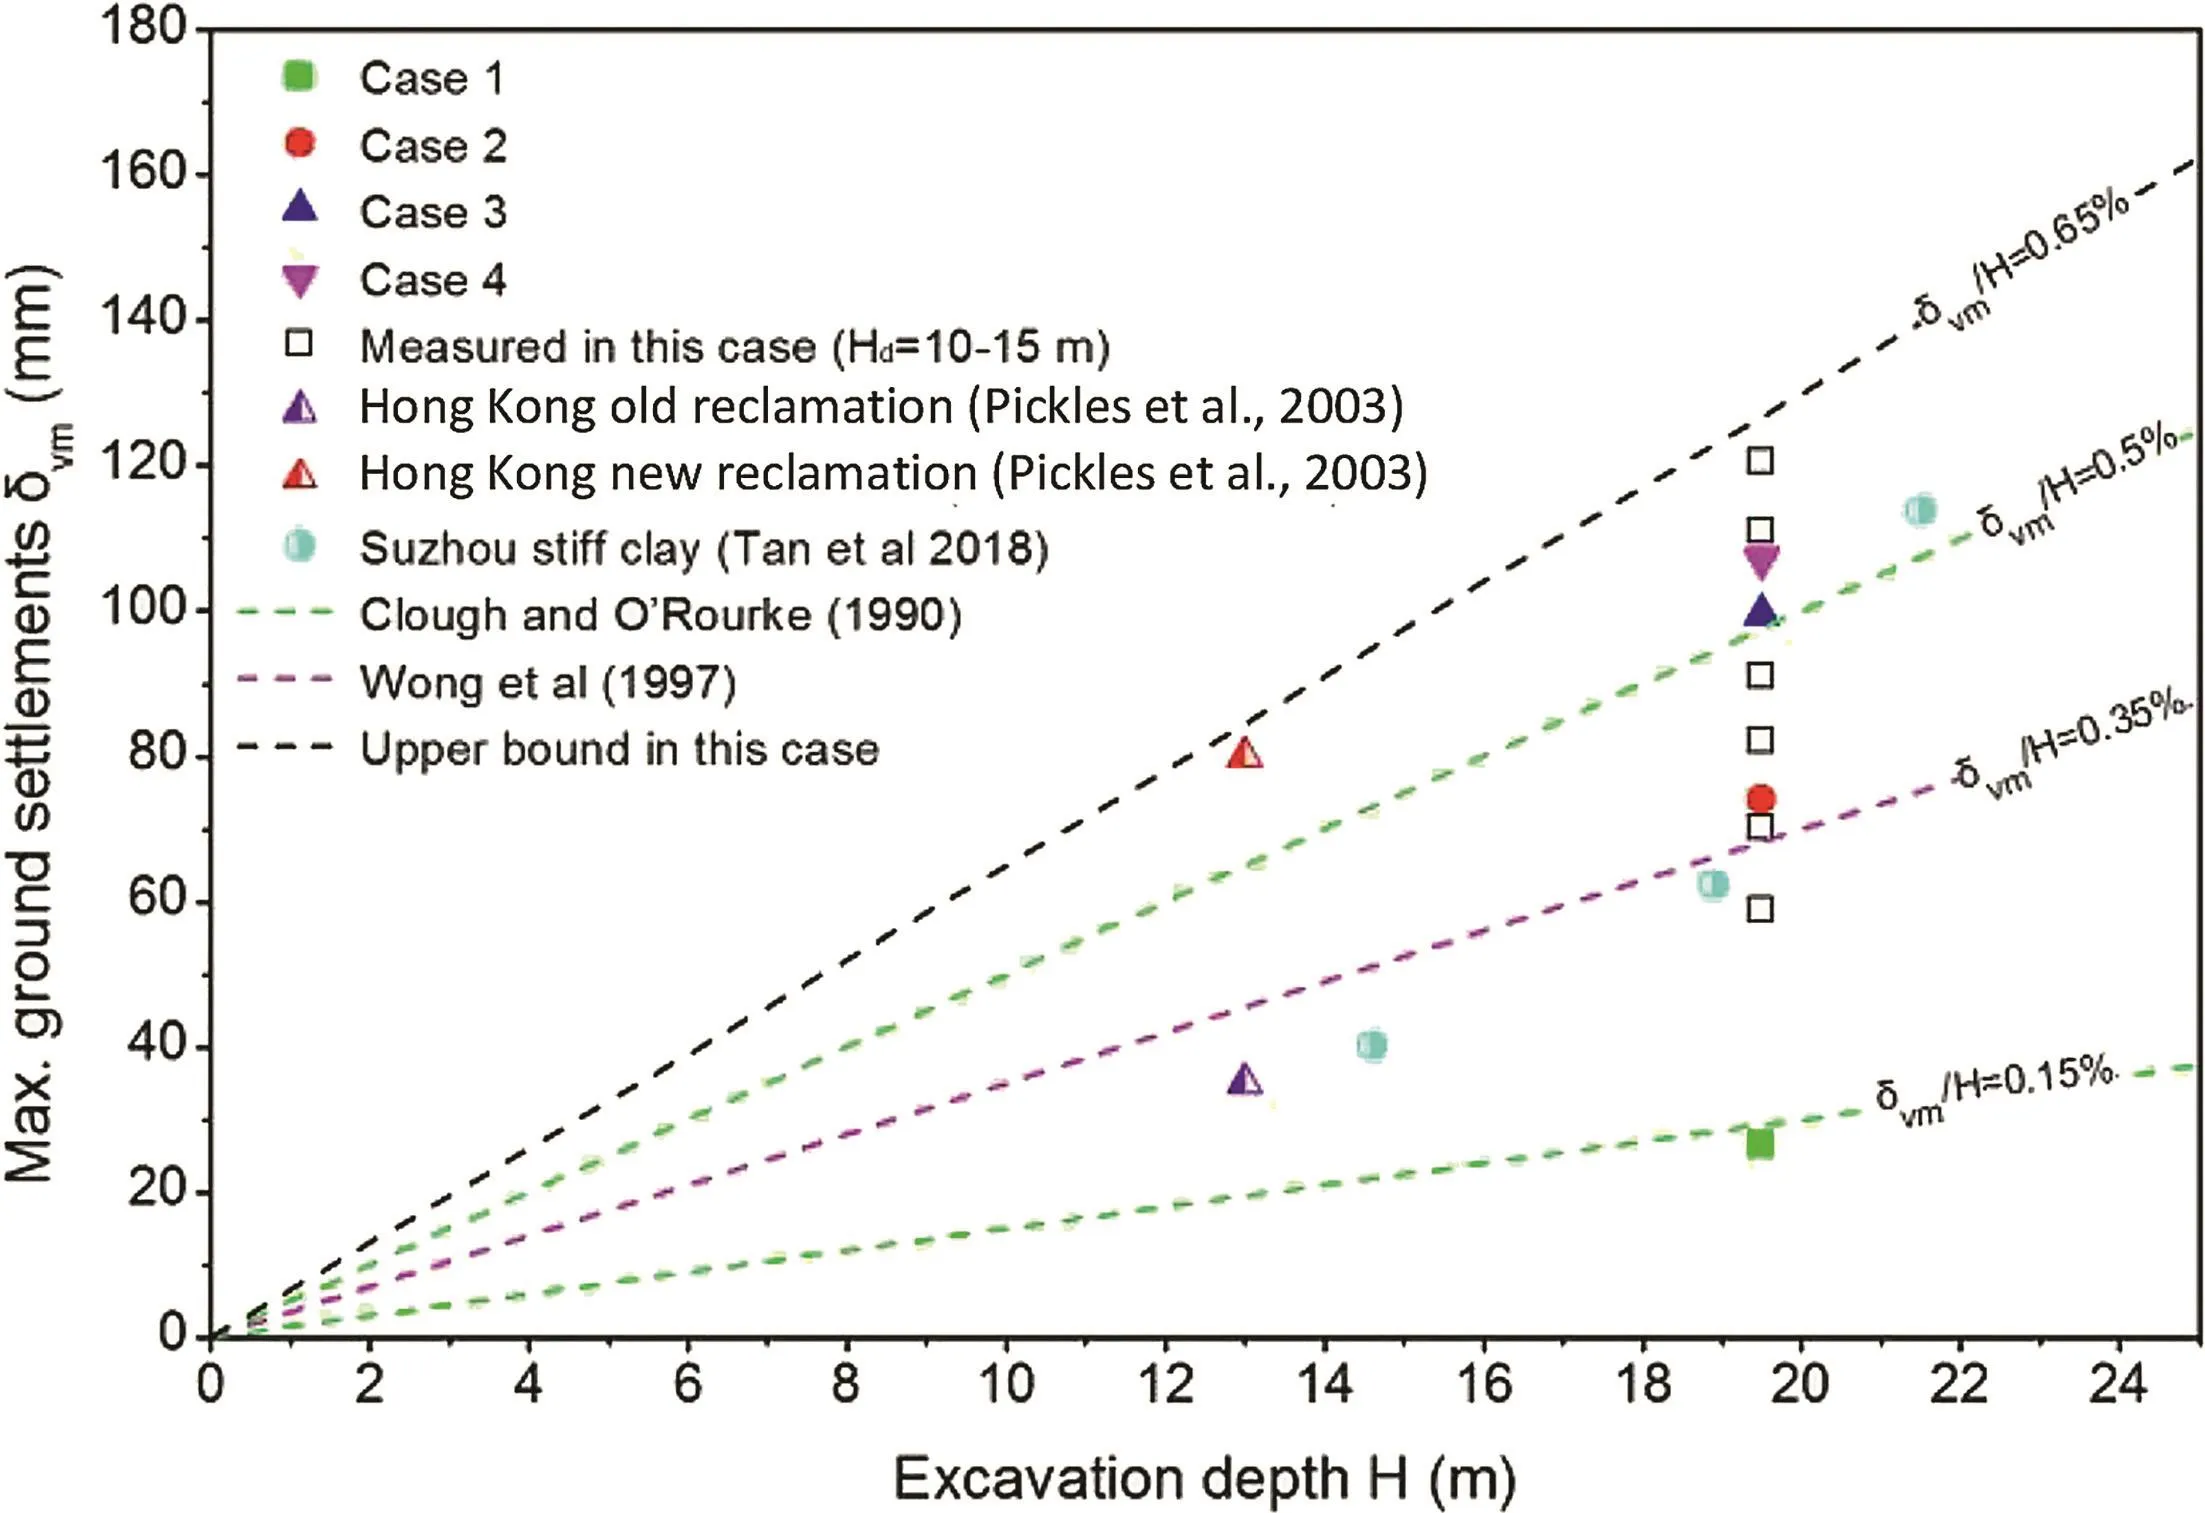
Fig.11.Comparison of the maximum ground settlement with empirical methods and historical cases.
For the case in Suzhou stiff clay(Tan et al.,2018),the magnitude of the maximum settlement was smaller than that in BTG residual soil,since the consolidation was mainly performed in a 6 m-thick confined aquifer.For another case conducted in Hong Kong reclamation(Pickles et al.,2003)with a maximum drawdown of 4 m,the maximum normalized settlementδvm/H in old reclamation area is close to 0.35%agreeing with the result of case 2,while in under consolidated new reclamation,δvm/H rises to around 0.6%,which is close to the upper bound in BTG residual soil under the effect of groundwater drawdown more than 10 m.
4.Conclusions
This paper presented the numerical back analysis of groundwater drawdown influence on excavation responses based on the case history in BTG residual soils.The numerical procedures were firstly calibrated by the instrumented results and then the parametric analyses were carried out to investigate the influence of water drawdown on the maximum wall deflection as well as the ground surface settlement.Finally,the measured and calculated results were compared with the empirical charts and limited history cases in the literature.The main conclusions of this study are drawn as follows:
(1)Groundwater drawdown outside the excavation has a considerable impact on magnitudes of maximum wall deflection.The more the drawdown is,the less the wall deflects.Drawdown also has a significant influence on the ground surface settlement,as well as the width of settlement trough.The more the drawdown,the more the ground settlement.
(2)The magnitudes of deflection and settlement are not linearly proportional to the drawdown magnitude,also depending on the thickness of compressible layers.
(3)Considering the groundwater drawdown,the ratio ofδhm/H moves to the lower bound line of the empirical charts while δvm/H shifts to the upper bound line.More case histories worldwide with groundwater drawdown records should be compiled for better illustration of the effects of wall type,water drawdown,excavation depth,etc.,on ground movements and wall deflections for the empirical charts.
Conflicts of interest
We wish to confirm that there are no known conflicts of interest associated with this publication and there has been no significant financial support for this work that could have influenced its outcome.
Acknowledgments
The authors would like to acknowledge the financial support from Land Transport Innovation Fund(LTIF)project funded by the Land Transport Authority(LTA),Singapore.Special thanks are given to Dr.Goh Kok Hun and Mr.Otard Chew Yuen Sin of LTA for the helpful discussions and communications.The first author is also grateful to the support from General Financial Grant of the China Postdoctoral Science Foundation(Grant No.2017M620414),Special Funding for Postdoctoral Researchers in Chongqing(Grant No.Xm2017007),as well as the Advanced Interdisciplinary Special Cultivation Program of Chongqing University (Grant No.06112017CDJQJ208850).
 Journal of Rock Mechanics and Geotechnical Engineering2018年5期
- Journal of Rock Mechanics and Geotechnical Engineering的其它文章
- Pullout behavior of polymeric strip in compacted dry granular soil under cyclic tensile load conditions
- A comparative study between gravel and rubber drainage columns for mitigation of liquefaction hazards
- Bearing behavior and failure mechanism of squeezed branch piles
- Experimental evaluation of mechanically stabilized earth walls with recycled crumb rubbers
- Dynamic properties and liquefaction behaviour of cohesive soil in northeast India under staged cyclic loading
- Saturated anisotropic hydraulic conductivity of a compacted lateritic soil
