Experimental evaluation of mechanically stabilized earth walls with recycled crumb rubbers
Matin Jalali Moghadam,Amirali Zad,Nima Mehrannia,Nader Dastaran
Department of Geotechnical Engineering,Islamic Azad University,Central Tehran Branch,Tehran,Iran
Keywords:Mechanically stabilized earth(MSE)wall Plate anchor Recycled crumb rubber(RCR)Particle image velocimetry(PIV)
A B S T R A C T Traditional techniques for treatment of waste rubber,such as burning,generate some highly nondegradable synthetic materials that cause unrepairable environmental damages by releasing heavy metals,such as arsenic,chromium,lead,manganese and nickel.For this,scrap tires are used as lightweight alternative materials in many engineering applications,such as retaining wall back filling.In the present study,90 laboratory models were prepared to evaluate the stability of mechanically stabilized earth(MSE)walls with plate anchors.Then,the bearing capacity and horizontal displacements of the retaining walls were monitored by exerting a static loading to investigate the effects of adding different contents(5 wt%,10 wt%,15 wt%and 20 wt%)of recycled crumb rubber(RCR)to the fill of a mechanically stabilized retaining wall with plate anchors.To visualize the critical slip surface of the wall,the particle image velocimetry(PIV)technique was employed.Results showed that the circular anchor plates almost continually provided a higher bearing capacity and wall stability than the square plates.Moreover,the back fill with 15 wt%RCR provided the maximum bearing capacity of the wall.Increasing the weight percentage of RCR to 20 wt%resulted in a significant reduction in horizontal displacement of the wall,which occurred due to the decrease in lateral earth pressure against the whole walls.An increase in RCR content resulted in the decrease in the formation of failure wedge and the expansion of the wall slip surface,and the failure wedge did not form in the sand mixtures with 15 wt%and 20 wt%RCRs.
1.Introduction
Waste tires are used for various applications because they can provide homogenous materials with different physical characteristics,such as geometry,size,and removable fibers and wires.Generally,waste tires are recycled by converting them to tire shred,tire chips,tire crumb,and tire buffing for use as lightweight filling materials(Edinçliler et al.,2010).Combining recycled tires with soil(mainly sand)leads to a considerable decrease in fill compressibility and flammability compared with the one-piece crumb rubber mode(Ahmed and Lovell,1993;Humphrey et al.,1993).Among the advantages of recycled tires are their low weight,satisfactory thermal insulation(eight times better than soil),high permeability,and shock absorbance.Recycled tires can be applied as an alternative for back fills of mechanically stabilized earth(MSE)walls and bridge abutments,aggregate in leach beds for septic systems,additive to asphalt,substitute for leachate collection stone in land fills,sound barrier,admixture in bituminous concrete,scraptire pad as a low-cost seismic base isolation pad,infrastructure for train roads for damping vibration,and insulation to reduce the freezing effect(Humphrey,2003;Salgado et al.,2003;Edinçliler,2007;Balunaini et al.,2009;Mashiri et al.,2016).
Different experiments have already been conducted on scrap tire-soil mixes,for example,direct shear test,static and dynamic triaxial tests,consolidation test,specific gravity test,density test,and permeability test,among others(Ahmed,1993;Edil and Bosscher,1994;Foose et al.,1996;Zornberg et al.,2004;Ghazavi and Sakhi,2005;Attom,2006;Srivastava et al.,2014;Bali Reddy et al.,2015;Xiao et al.,2018).Ahmed(1993)and Foose et al.(1996)performed several shear tests on a tire-derived materialsand mixture in different sizes and reported an increase in internal friction angle(φ)of up to 65°.Edil and Bosscher(1994)suggested tire particle sizes smaller than 50 mm to deal with unauthorized compaction.Zornberg et al.(2004)suggested 35 wt%as the optimal content by evaluating sand-crumb rubber mixture and proved that an increase in overall shear strength resulted in an increase in the aspect ratio(proportion of length towidth)of crumb rubber in a given weight percentage.Ghazavi and Sakhi(2005)and Attom(2006)performed a direct shear test on a sand-crumb rubber mixture and reported increases in the internal friction angle φ and the aspect ratio by increasing the crumb rubbercontent and mix compaction.Srivastava et al.(2014)proved a reduced swelling potential by adding crumb rubber to expansive black cotton soil and demonstrated the better performance of coarse crumb rubber(2-4.75 mm)than that of small crumb rubber(0.075-2 mm).Bali Reddy et al.(2015)showed a 43%decrease in void ratio by adding 40 wt%tire chips to sand and found that φ values increased with the tire chip content up to 30 wt%.Their study indicated that the optimum percentage of tire chips of the selected size was 30-40 wt%(equivalent to 50%-60%by volume).Xiao et al.(2018)investigated the effectiveness of polyurethane foam adhesive(PFA)in improving the strength and ductility of a well-graded gravel soil.Using drained triaxial compression tests on the unimproved and PFA-improved soils as the basis for comparison,the peak and residual strengths of the PFA-improved soil increased significantly(from 1.5 to 7 times and from 1.4 to 5.4 times of that of unimproved soil,respectively)with increasing PFA content(from 2%to 8%)at a confining pressure of 100 kPa.Given its ductile response and stress-strain-strength characteristics,PFA-improved gravel soils could offer a promising alternative for high rock fill dams or railway embankments.
Evaluation of foundation bearing capacity was performed on reinforced and un-reinforced soil-recycled tire mixes under static and cyclic loadings by Tavakoli Mehrjardi et al.(2012),Moghaddas Tafreshi and Norouzi(2012),and Moghaddas Tafreshi et al.(2013,2016).Tavakoli Mehrjardi et al.(2012)applied a cyclic loading on buried flexible pipes in reinforced soil with geocell-tire chips and reinforced soil with geocell-tire crumbs.They demonstrated that the maximum subsidence,which is the transmission of the highest pressure to the pipe,and the maximum strain of the pipe body occurred on soil-tire chips.In addition,a decrease in subsidence level,a reduced plastic radial strain of the pipe,and less fatigue occurred in a mix of soil with 5 wt%crumb rubber.Moghaddas Tafreshi and Norouzi(2012)proved a 2.68-fold increase in bearing capacity of a square model footing for soilcrumb rubber mixes with 5%optimum content.Moghaddas Tafreshi et al.(2013,2016)investigated the effect of reinforcement on multilayer geocell in both original soil and mixes containing 8 wt%crumb rubber in a pilot scale and reported the following results:
(1)A higher bearing capacity and a lower loading plate settlement were achieved by replacing the soil of geocell layers with soil-crumb rubber mixes.
(2)The bearing capacity did not increase and the loading plate settlement did not decrease over a three-layer mix.
Only a few studies have been conducted on the effect of recycled rubber on the pullout capacity of mechanical reinforcements,such as geogrid and metal strip(Balunaini et al.,2014;Umashankaret al.,2014).Balunaini et al.(2014)and Umashankar et al.(2014)performed uniaxial pullout tests on geogrid and metal strip,and showed a significant increase in geogrid pullout strength of soilcrumb rubber mixes in comparison with that of crumb rubber.They reported a reduction in metal strip pullout strength by increasing the crumb rubber content,the apparent size of crumb rubber,and the confining pressure.
Many studies have been conducted to evaluate the effect of using recycled rubber on retaining wall back fill,trenches,embankments,roadbeds,and even pavements(asphalt)under static and dynamic loads(Humphrey and Eaton,1995;Cecich et al.,1996;Bosscher et al.,1997;Tweedie et al.,1998;Marandi,2011;Ahn and Cheng,2014;Edinçliler and Yildiz,2015;Reddy and Krishna,2015;Li et al.,2016;Ding et al.,2017;Khabiri et al.,2017;Ma et al.,2017).Humphrey and Eaton(1995)described a field trial that uses tire chips as an insulating layer to limit frost penetration beneath a gravel-surfaced road.Based on the analysis of the first two winters in service,a 152 mm-thick tire chip layer overlain by 305 mm-thick gravel reduced the depth of frost penetration by 22%-28%compared with that in the adjacent control section.Cecich et al.(1996)used retaining wall modeling with sand-crumb rubber mixes in their experiments and reported cost saving and an increased safety factor in the prepared wall compared with the one prepared using sand- fill.Bosscher et al.(1997)evaluated the use of tire chips as a highway embankment material and supported the use of tire chips as an environmentally acceptable lightweight fill in highway applications if properly confined.They provided recommendations for design procedures and construction specifications for the use of tire chips in highway fills.Tweedie et al.(1998)evaluated the stability of a 4.88 m-high retaining wall by adding tire shreds from three suppliers to the back fill.They showed that the horizontal stress for the tire shred back fill was about 35%less than the active stress for conventional granular back fill.The inclination of the sliding plane with respect to the horizon was estimated at 61°-70°for the three types of the tire shreds.Marandi(2011)conducted dynamic triaxial tests and retaining wall dynamic analyses,and reported a reduction in shear modulus,dynamic pressure,and residual displacement with increasing crumb rubber content.Ahn and Cheng(2014)found an increasing rate of wall slide and a reduced applied dynamic pressure from tirederived aggregate back fill by conducting a large-scale shaking table test.Edinçliler and Yildiz(2015)performed a dynamic test on a soil-crumb rubber mix at both cold(0°C)and room temperatures(20°C)and reported an increasing reduction of seismic hazards in the mix at 0°C.Moreover,Reddy and Krishna(2015)showed a 50%-60%reduction in horizontal displacement and lateral pressure of retaining walls made of sand-rubber chips mix compared with sand- fill.Li et al.(2016)evaluated sand-crumb rubber mixes and presented a significant effect of mix ratio and particle size on the dynamic shear modulus and liquefaction susceptibility.They found that an increase in rubber fraction leads to an increase in liquefaction strength.Khabiri et al.(2017)proved that an increase in the penetration depth of rubber powder in back fill caused an increase in safety factor against road slip.In similar researches conducted on asphalt,Ding et al.(2017)and Ma et al.(2017)demonstrated that normal crumb rubber and desulfurized crumb rubber have obvious positive effects on the properties of neat asphalt and asphalt-rubber mixtures.Compared with the normal crumb rubber asphalt,the desulfurized crumb rubber asphalt showed lower viscosity and better storage stability.They indicated that the plant-produced crumb rubber asphalt exhibited good storage stability and satisfied road properties compared with other binders,and the asphalt mixture prepared with plant-produced crumb rubber asphalt showed satisfactory road performance.
Plate anchors are mechanical reinforcements that have one or multiple load-bearing plates along with a bar or cable.These reinforcements have widespread applications in onshore and offshore activities,such as constructing mechanical retaining walls,dealing with foundation uplift, fixing reservoirs and offshore floating platforms against sea waves,and protecting buried and submerged pipelines.Examples of mechanical anchors include simple horizontal,inclined,and vertical plate anchors;dead man anchors;multi-plate anchors;cross-plate anchors;expanding pole key anchors;helical anchors;drag embedment anchors;vertically loaded anchors(VLAs);suction-embedded plate anchors(SEPLAs);dynamically embedded plate anchors(DEPLAs)such as OMNI-max and torpedo anchors;and duckbill,manta ray,and stingray anchors(Randolph and Gourvenec,2011;Randolph et al.,2011;Das and Shukla,2013;Blake et al.,2015;Tian et al.,2015;Han et al.,2016).
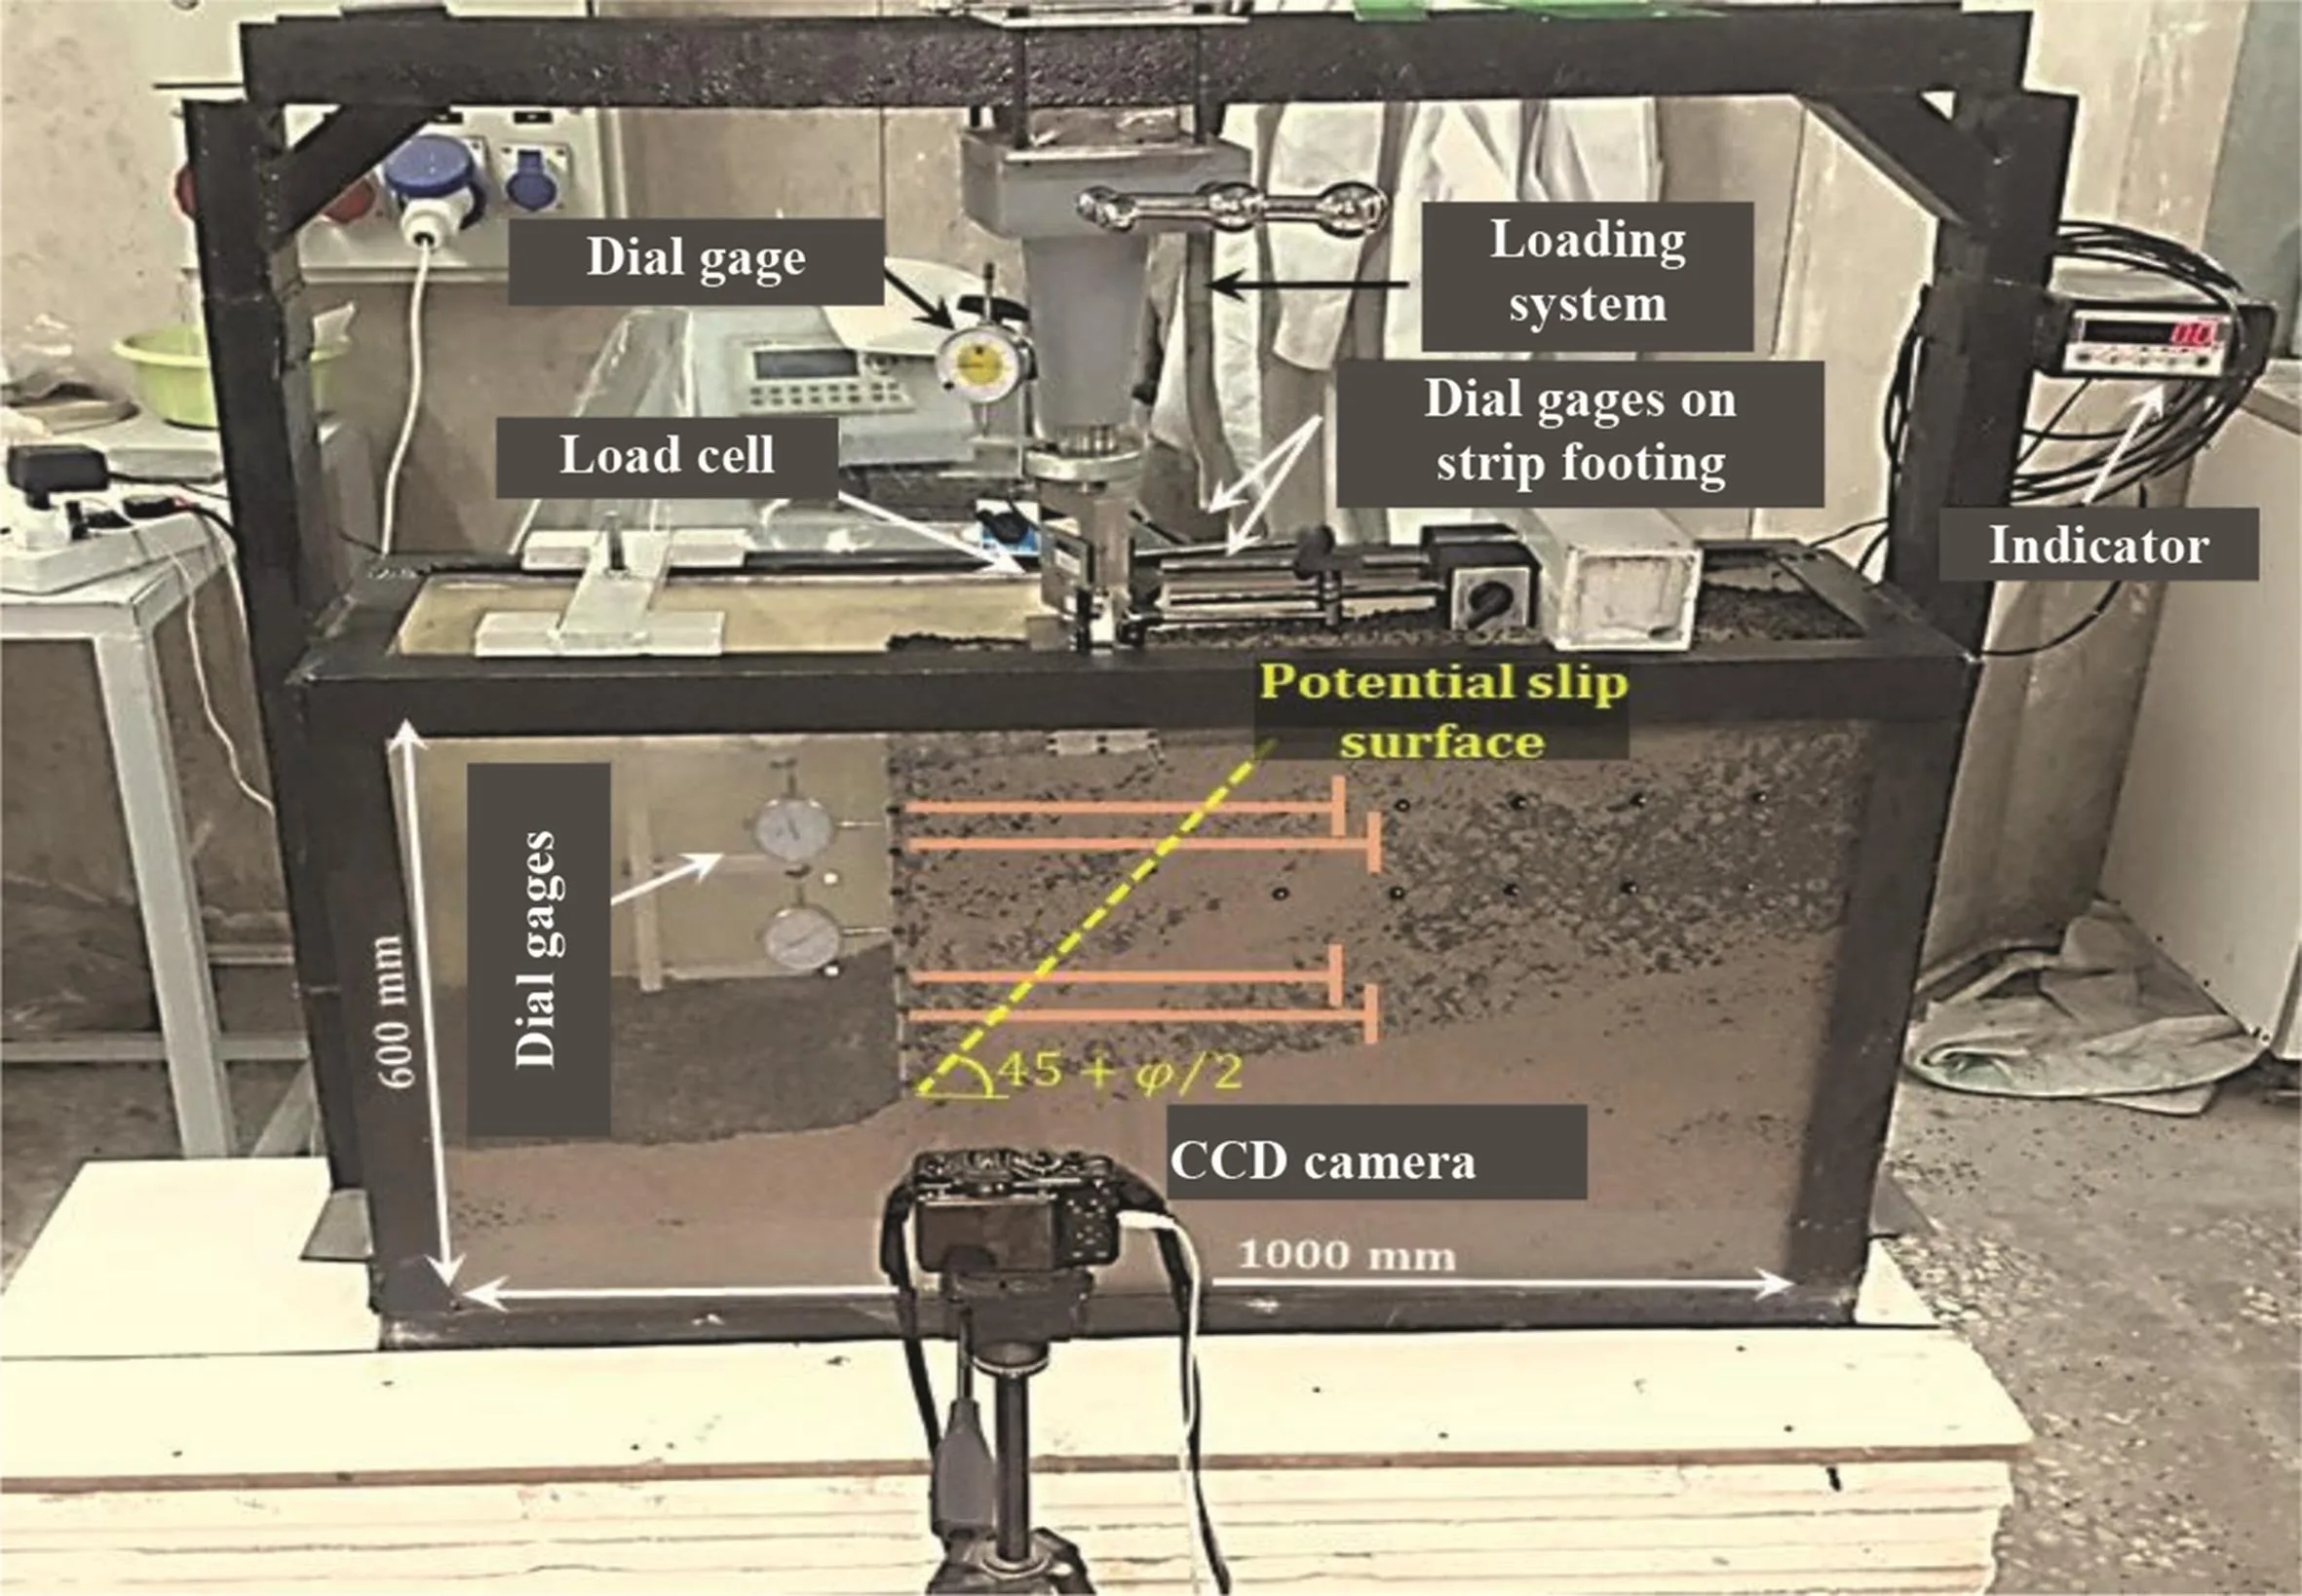
Fig.1.Test box with instrumentation(φ is the internal friction angle).
The simultaneous use of plate anchors as retaining wall reinforcement and recycled tires as lightweight filling material can be a suitably combined method in terms of economic,environmental,and safety aspects of wall stability under static and dynamic loadings.Plate anchors with one or multiple buried plates in soil have a high pullout capacity.Unlike in metal strips and geogrids,the bearing of which is caused by surface friction and locking with soil particles,the presence of recycled tires either independently or mixed with soil has no devastating effect on the pullout capacity of plate anchors due to their direct relation with the end plate.Therefore,the present research investigated the effect of adding different weight percentages(5 wt%,10 wt%,15 wt%and 20 wt%)of recycled crumb rubber(RCR)to the back fill of a retaining wall and the effect of anchor plate geometry,dimensions,and reinforcement configurations on the overall stability of MSE walls.To observe the critical slip surface during each experiment,the particle image velocimetry(PIV)technique was employed to detect soil particle displacement in a laboratory setting.Commonly applied in fluid mechanics as well as in tracing gas and liquid particle flows,this method was initially performed by White et al.(2003)in a laboratory modeling to solve geotechnical problems(Keane and Adrian,1992;White et al.,2001,2003;2005;Adrian, 2005;Ahmadi and Hajialilue-Bonab,2012).
2.Test materials
A series of reduced scale model tests was conducted to investigate the behavior of MSE walls subjected to static loading.The sizes of the model walls were designed at a scale ratio of 1:10,which were similar totypical field walls.Thus,a retaining wall with the size of 3000 mm×3000 mm(height×length)was reduced to the one with dimensions of 300 mm×300 mm.
The main components of the experimental apparatus included a test chamber,a loading frame,a loading system,a load cell and indicator,a CCD(charge coupled device)camera,and dial gages.The internal dimensions of the chamber,which was made of metal sheets on three sides,were 1000 mm×300 mm×600 mm(length×width×height).The greater length and height of the chamber were considered to prevent boundary effects,and the 300 mm width of the chamber was selected to ensure the complete plane-strain conditions.A row of metal strips was welded at the middle height of the outer faces of the chamber to ensure its rigidity.As shown in Fig.1,the front side of the chamber was made of a 30 mm-thick plexiglas.This thickness of the plexiglas made it suitable for resisting deformation and swelling during the loading procedure.The plexiglas wall of the test chamber allowed for the observation and photogrammetry of one side of the retaining walls to trace soil particles and identify failure modes,which were performed using the PIV technique.To minimize the side effects due to the friction of the metal sidewalls of the chamber,a 1.5 mm-thick polyethylene plastic sheet was fixed on the inside of the sidewall.Tognon et al.(1999)placed polyethylene plastic sheets on the walls of a box to minimize the friction angle between the walls and soil to less than 5°.
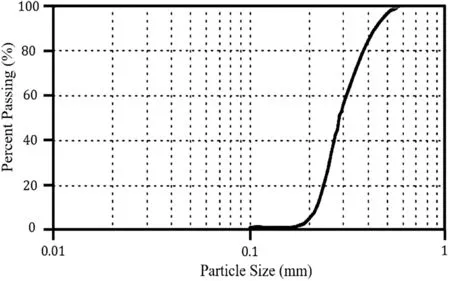
Fig.2.Grain size distribution of back fill soil.

Table 1Physico-mechanical properties of soil.
The back fill soil used in all tests was sandy soil collected in Sufian in East Azerbaijan Province,Iran.Fig.2 shows the grain size distribution of this soil.According to the unified soil classification system(USCS),the soil is poorly-graded sand(SP).The strength properties of this soil were derived by performing direct shear test according to ASTM D3080-04(2004)(Table 1).The unit weight of the back fill was achieved by compacting a fixed mass of sand or mixtures into a pre-calculated volume of each lift.The target unit weight of the back fill was 16 kN/m3.
To construct the permanent retaining wall facing,prefabricated or precast concrete blocks with a thickness of 300 mm were used.Wood(2004)conducted a dimensional analysis and introduced four types of materials with different thicknesses to be used in the 300 mm concrete facing in the laboratory model(Table 2).Herein,a 0.9 mm-thick aluminum plate was used in the experiments conducted in the present work.
The length and diameter of the applied tie rods were 300 mm and 4 mm,respectively,which were calculated by applying a scale ratio of 1:10 in a bar with length and diameter of 3000 mm and 40 mm,respectively.The failure wedge was evaluated on the basis of Rankin theory.The results showed that the minimum length needed for the anchor plates to be placed outside the failure wedge was 200 mm.Thus,satisfactory results were achieved by selecting a length of 300 mm for the reinforcements to bury the anchor plates in the passive zone of the wall and by having an adequate distance from the failure wedge to deal with the lateral soil pressure.
The two sides of the tie rods were threaded to the plate anchors and the wall facing,respectively.Depending on the required bearing capacity of the mechanical plate anchor reinforcements,plates with different dimensions were designed and implemented.In this study,square plates with three common dimensions of 300 mm,400 mm and 500 mm were selected for the real conditions.According to the scale ratio of 1:10,reduced model plates of 30 mm×30 mm,40 mm×40 mm and 50 mm×50 mm were obtained to simulate laboratory conditions.The areas of the small,medium,and large square plates were equivalent to the areas of the small,medium,and large circle plates,respectively.Fig.3 illustrates the polished anchor plates and tie rods,and Table 3 shows the detailed properties of these reinforcements.
The horizontal and vertical distances of passive reinforcements(not post-tensioned),such as the grouted and helical(screw)soil nails,and of active reinforcements(post-tensioned),such as grouted and helical(screw)soil anchors,were previously reported to be 1000-3000 mm(Sabatini et al.,1999;Perko,2009;Lazarte et al.,2015).In this study,the horizontal and vertical distances were both set to 1500 mm because no post-tensioning occurs in these plate anchors.By applying the scale factor of 1:10,a 150 mm centerto-center distance was obtained for the reinforcements.Accordingly,three reinforcement configurations,including 5-anchor,diamond,and square configurations,were applied,as shown in Fig.4.
To create a perfect plane-strain condition and to prevent any friction between the footing and the lateral sides of the test box,the footing length was set to be 1 mm smaller than the 300 mm width of the test chamber.Thus,the length,width and thickness of the footing were 299 mm,70 mm and 30 mm,respectively.Note thatthe 70 mm width and the 30 mm thickness of the footing were selected to simulate the scaled 700 mm and 300 mm dimensions of a strip foundation,respectively.In addition,all sides of the footing were polished to minimize the friction between the footing surfaces and the back fill soil.

Table 2Equivalent materials for simulating a 300 mm-thick concrete facing(Wood,2004).
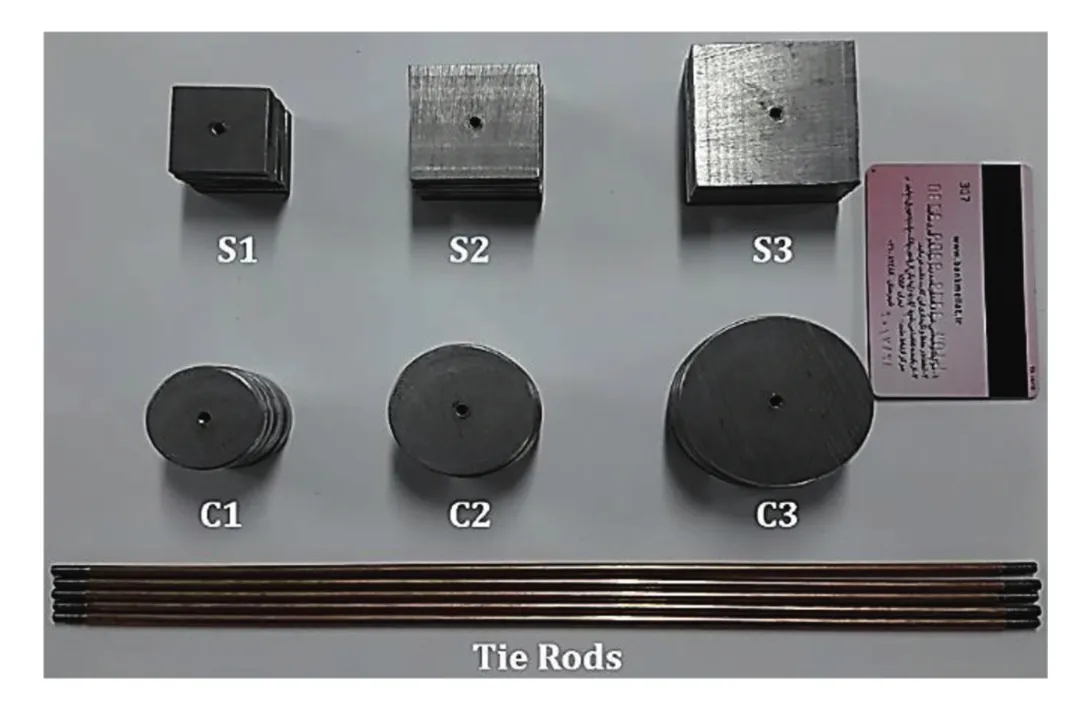
Fig.3.Mechanical plate anchor reinforcements.
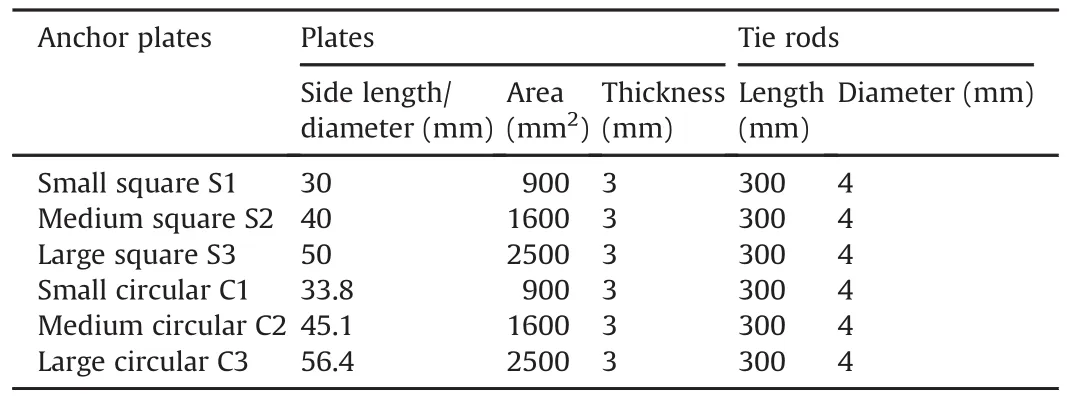
Table 3Properties of anchor plates.
According to ASTM D6270-08(2012),the tire pieces used in this research are classified as granulated rubber.All the RCRs were sieved,and those passing through sieve#4(4.75 mm)and remaining on sieve#6(3.35 mm)were added to the soil mixture.Fig.5 illustrates a sample of the sieved RCR.This RCR size was selected in accordance with the previous work that reported a size of 50 mm or less for dealing with unallowable compaction.Moreover,coarse RCR(2-4.75 mm)showed more satisfactory results compared with the fine one(0.075-2 mm)(Edil and Bosscher,1994;Srivastava et al.,2014).All RCRs prepared for experiments were washed and were free from steel wires.The average unit weight and specific gravity values of the RCRs were 12 kN/m3and 1.21,respectively.
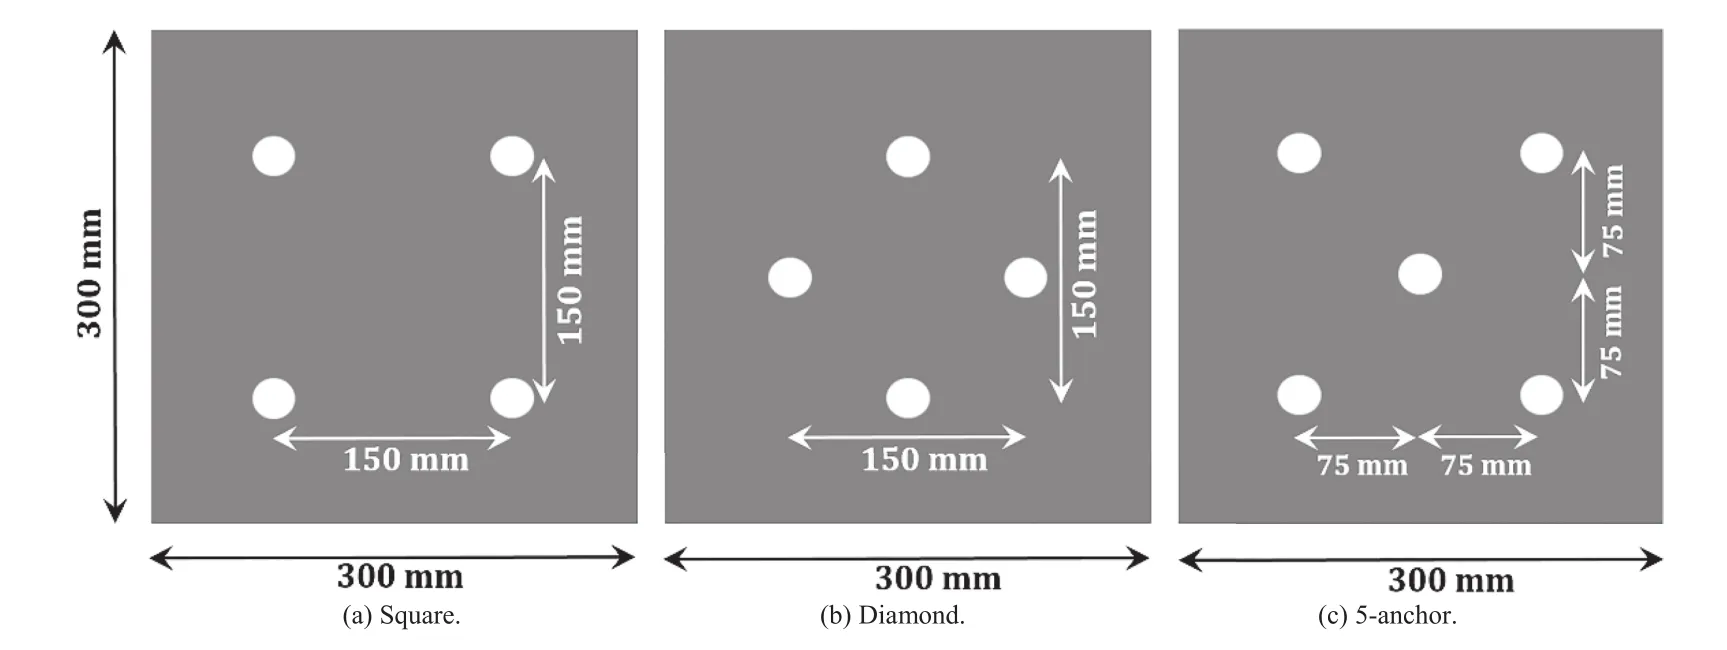
Fig.4.Reinforcement configurations.
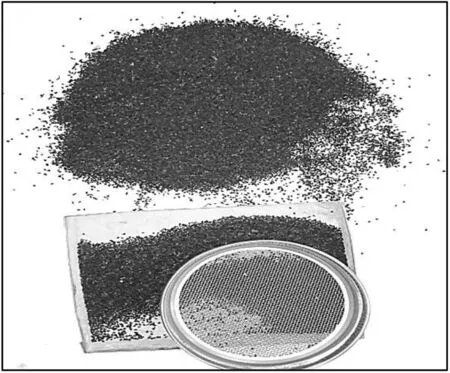
Fig.5.Sample of sieved RCR.
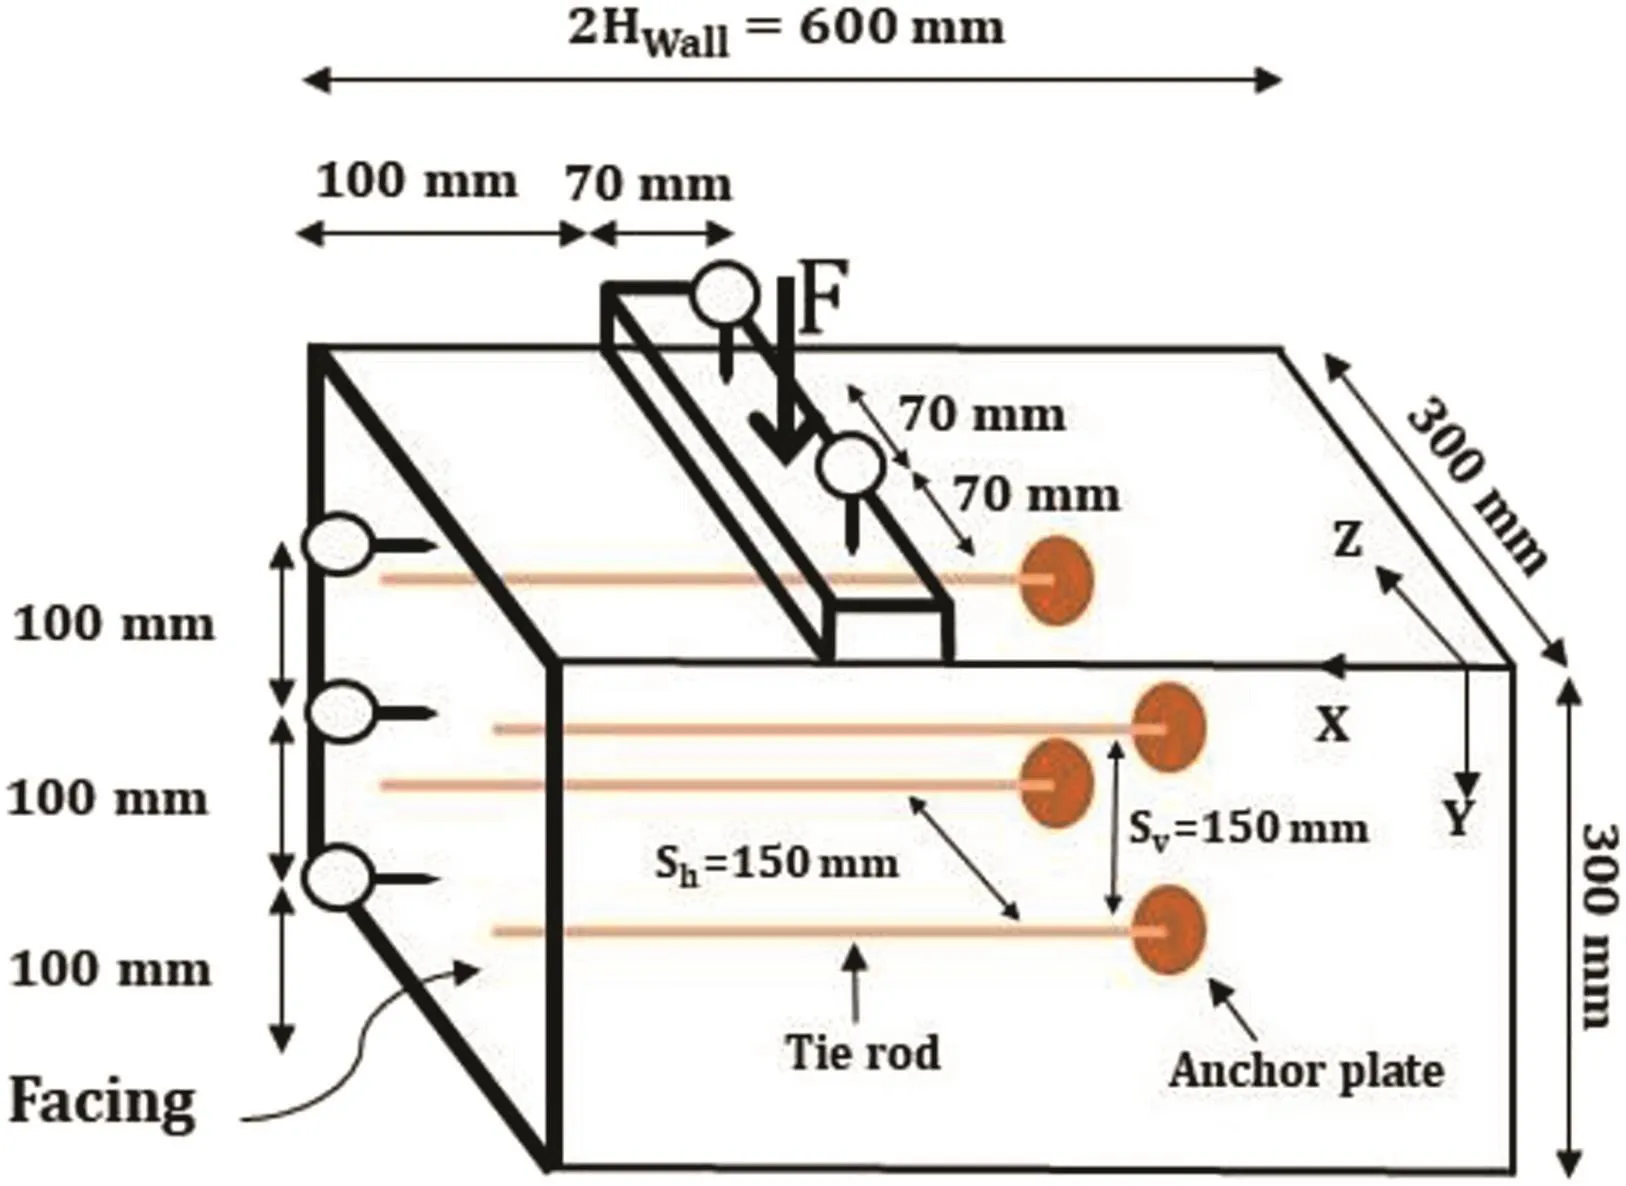
Fig.6.Schematic diagram of retaining wall.
3.Test program
The test design for all models in the present work was applied through the same steps:installing the facing,dropping the mixtures from a fixed height,embedding the reinforcements at each elevation,and connecting them to the facing.Through this plan,filling for each layer started from the bottom of the box till the preassigned facing levels.The reinforcements were installed at specified levels,attached to the facing,and then back filled.This procedure was repeated for all layers in the back of the facing until the elevation of the uppermost reinforcement and their attachment to the facing was reached.Eventually,the wall construction process was terminated by further back filling up to the wall crown.To achieve a constant unit weight of 16 kN/m3during the tests,back fill construction was performed through unit weight control.For this purpose,the inner sides of the chamber were graded in 50 mm intervals,and a uniform compaction effort was applied on the entire surface of each mixture layer to reach a 50 mm height and uniform unit weight required.The same method was used in all tests to prepare retaining walls.
To achieve the desired accuracy,a constant displacement loading mode was applied.For this purpose,a dial gage was installed on the moving shaft of the loading system(Fig.1).The loading rate was constant and equal to 1 mm/min.Loading was applied until the footing reached a 24 mm ultimate settlement,which was 35%of the footing width.
The first image was taken before loading,after which the wall surface was imaged.Imaging of the wall surface was repeated after every 3 mm settlement until the 24 mm ultimate settlement of the footing was reached.The wall surface was imaged nine times during each experiment.All seven dial gages had the least count of 0.01 mm.Fig.6 illustrates the schematic diagram of the retaining wall,strip footing with a constant spacing from the facing,the embedded reinforcements in the wall under a square configuration,and the applied dial gages and their distances.Table 4 presents all the tests as well as the constant and variable parameters of each test.

Table 4Specifications of performed tests.
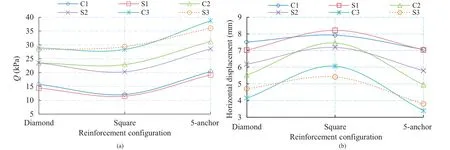
Fig.7.Comparisons of(a)footing bearing capacity and(b)wall horizontal displacement for six reinforcements.
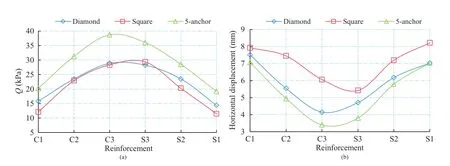
Fig.8.Comparisons of(a)footing bearing capacity and(b)wall horizontal displacement.
By changing the fill type from RCR-free sand to the ones with different RCR contents,the early tests were conducted twice.Although the difference in the pair tests was negligible,the test was repeated when unreasonable results were obtained.Factors such as deviation from the vertical position during the wall construction or soil particle evasion from the facing sides were among the main sources of test error.
4.Results and discussion
The results of the tests conducted on the RCR-free soil with anchor plates and reinforcement configurations are summarized in Figs.7 and 8,respectively.The main reason for mentioning only the test results in the RCR-free soil is the presence of a routine trend in the results during the change in anchor plate dimensions and configurations of different back fills.The results of all the experiments conducted to evaluate the effect of RCR with four different weight percentages on wall stability are presented in Fig.9.
4.1.Effect of anchor plates
Based on reinforcement types,the test results conducted on a soil without RCR are summarized in Fig.7.As expected,the maximum bearing capacity was found for the walls built using the large,medium,and small anchor plates in the order of their appearance.The bearing difference of the small and medium anchor plates(for both square and circle shapes)was about 63%,that between the medium and large plates was 27%,and that between the small and large plates was 108%.The noteworthy points here are the significant improvement of the bearing capacity with the changing plate dimension from small to medium and the small improvement of the bearing capacity with the changing plate dimension from medium to large.Thus,the small plates had negligible strength and limited locking against lateral soil pressure.
Comparing the horizontal displacement curves of the walls indicates that the small plates not only give a minimum bearing capacity but also show the maximum horizontal displacement.The minimum horizontal displacements are for the large,medium,and small anchor plates in the order of their appearance,suggesting the suitable anchorage of active zone(failure wedge)to the passive zone through the medium and large plates.The rates of reduction in wall displacement changing with plate dimensions from small to medium,medium to large,and small to large(for both square and circle shapes)were 17%,26%and 39%,respectively.
In 77%of the experiments,the circular plates caused a larger bearing capacity than the square plates in the footing.In 55%of the experiments,the horizontal displacement of the retaining walls in these plates was less than that in the square plates.
4.2.Effect of reinforcement configuration
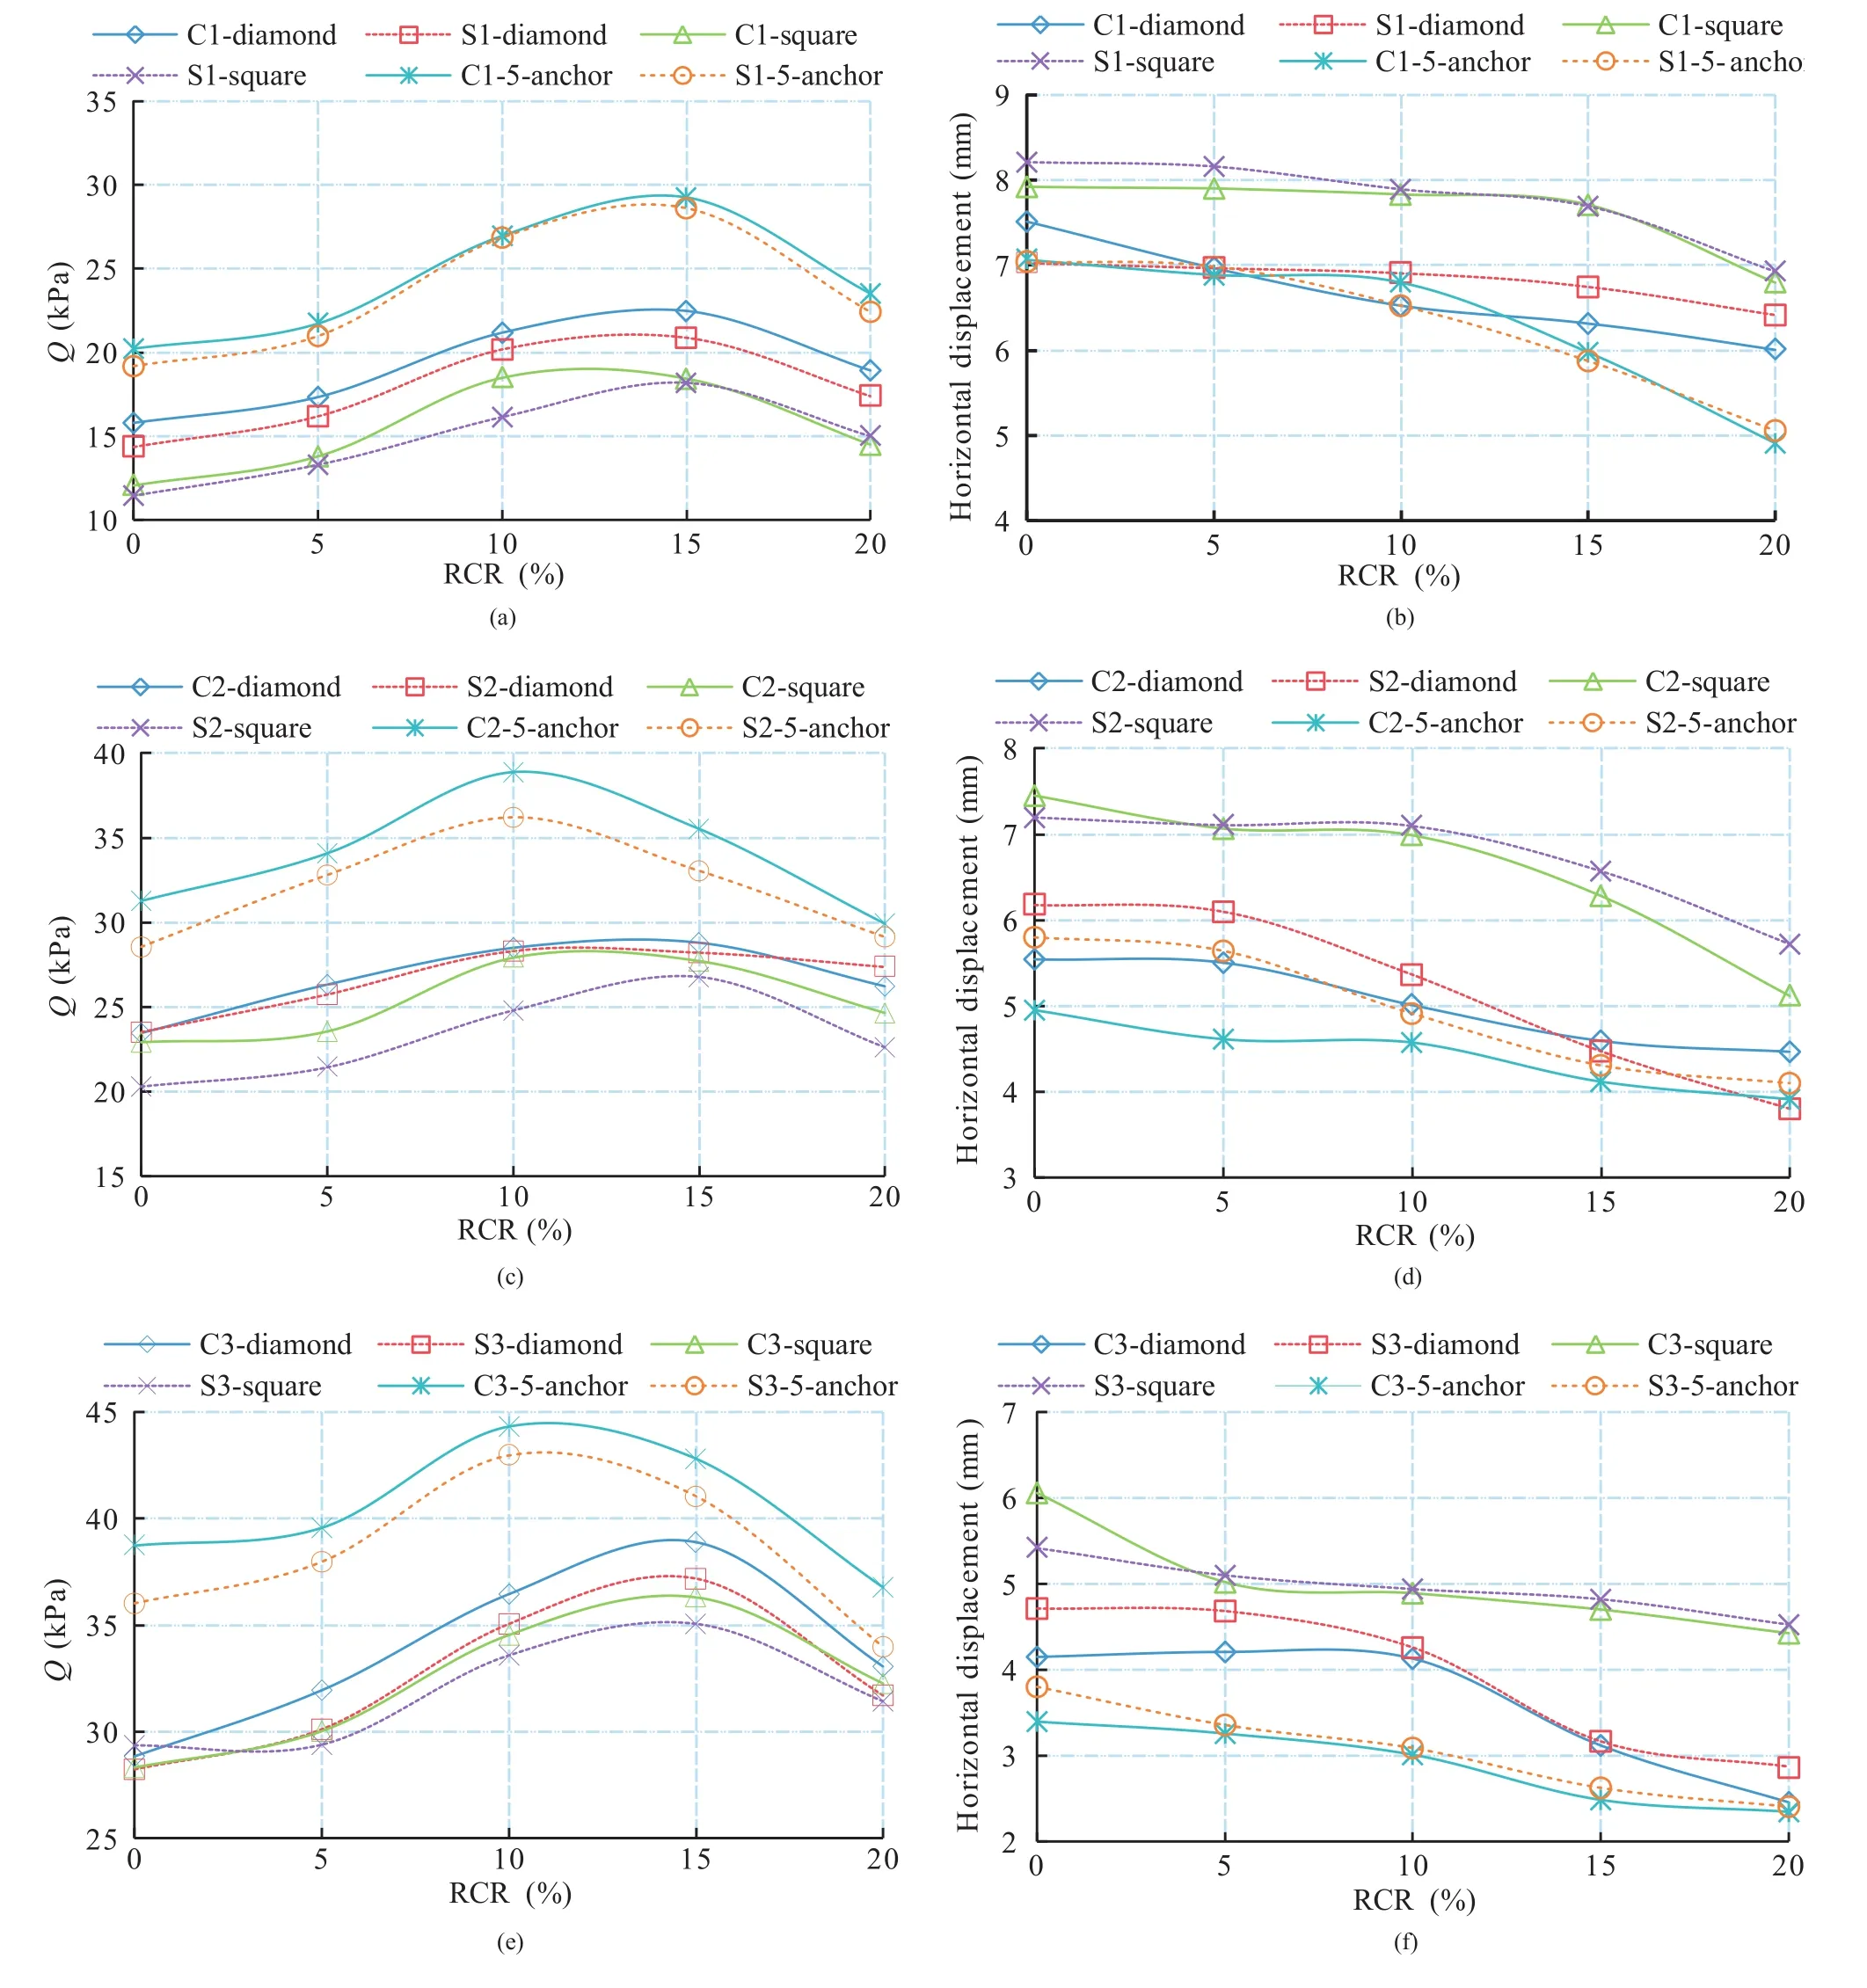
Fig.9.Footing bearing capacity and wall horizontal displacement versus content of CRC in the back fill.
To compare the effect of reinforcement configuration,the obtained results for all three configurations were categorized for the soil without RCR,as shown in Fig.8.Among all configurations shown in this figure,the 5-anchor configuration provided the highest wall stability as it had one more reinforcement.The diamond configuration gave a higher bearing capacity than the square configuration in all tests except in one experiment(S3 reinforcement in the square configuration).The rates of increase in the footing bearing capacity with the change of the reinforcement configurations from square to diamond,diamond to 5-anchor,and square to 5-anchor(for all of the anchor plates)were 12%,30%and 45%,respectively.A comparison of these percentages revealed that the increase in bearing capacity of the wall was dramatically higher for the 5-anchor reinforcement configuration than that for the diamond configuration.
The interpretation and comparison of the curves for all three configurations showed that the curves became similar either in the circular or square plates when the reinforcement dimensions increased,thus reducing the difference in bearing capacity of the wall in the square and diamond configurations in the large plates.In other words,the effect of reinforcement configuration on the bearing capacity decreased with an increase in plate dimensions.
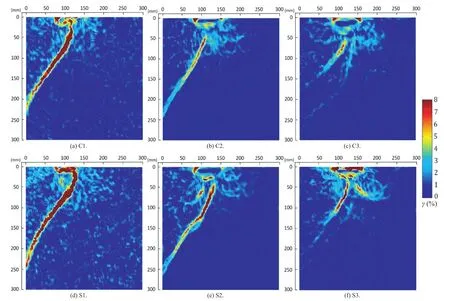
Fig.10.PIV results for six reinforcements with 5-anchor configuration in the original(RCR-free)soil.
The minimum horizontal displacement was observed for the 5-anchor configuration,followed by the diamond configuration.The small difference between wall displacements for the diamond and the 5-anchor configurations despite one less reinforcement for the former configuration should be noted.Aside from having the minimum bearing capacity,the square configuration also obtained the maximum wall horizontal displacements(with a high difference),implying its lower efficiency than the other two configurations.The rates of decrease in the wall horizontal displacement with the change of the reinforcement configurations from square to diamond,diamond to 5-anchor,and square to 5-anchor(for all of the anchor plates)were 17%,10%,and 25%,respectively.
The results showed that changing the reinforcement configuration from square to diamond and from square to five-anchor led to a remarkable drop in the horizontal displacement of the wall.Moreover,a change from the diamond configuration to the 5-anchor configuration resulted in only a 10%decrease in wall displacement,suggesting the satisfactory performance of the diamond configuration and a proper distribution pattern of the installed reinforcements on the wall for dealing with unallowable displacements.
4.3.Effect of RCR

Fig.11.PIV results for C2 reinforcement embedded in the original soil with three configurations.
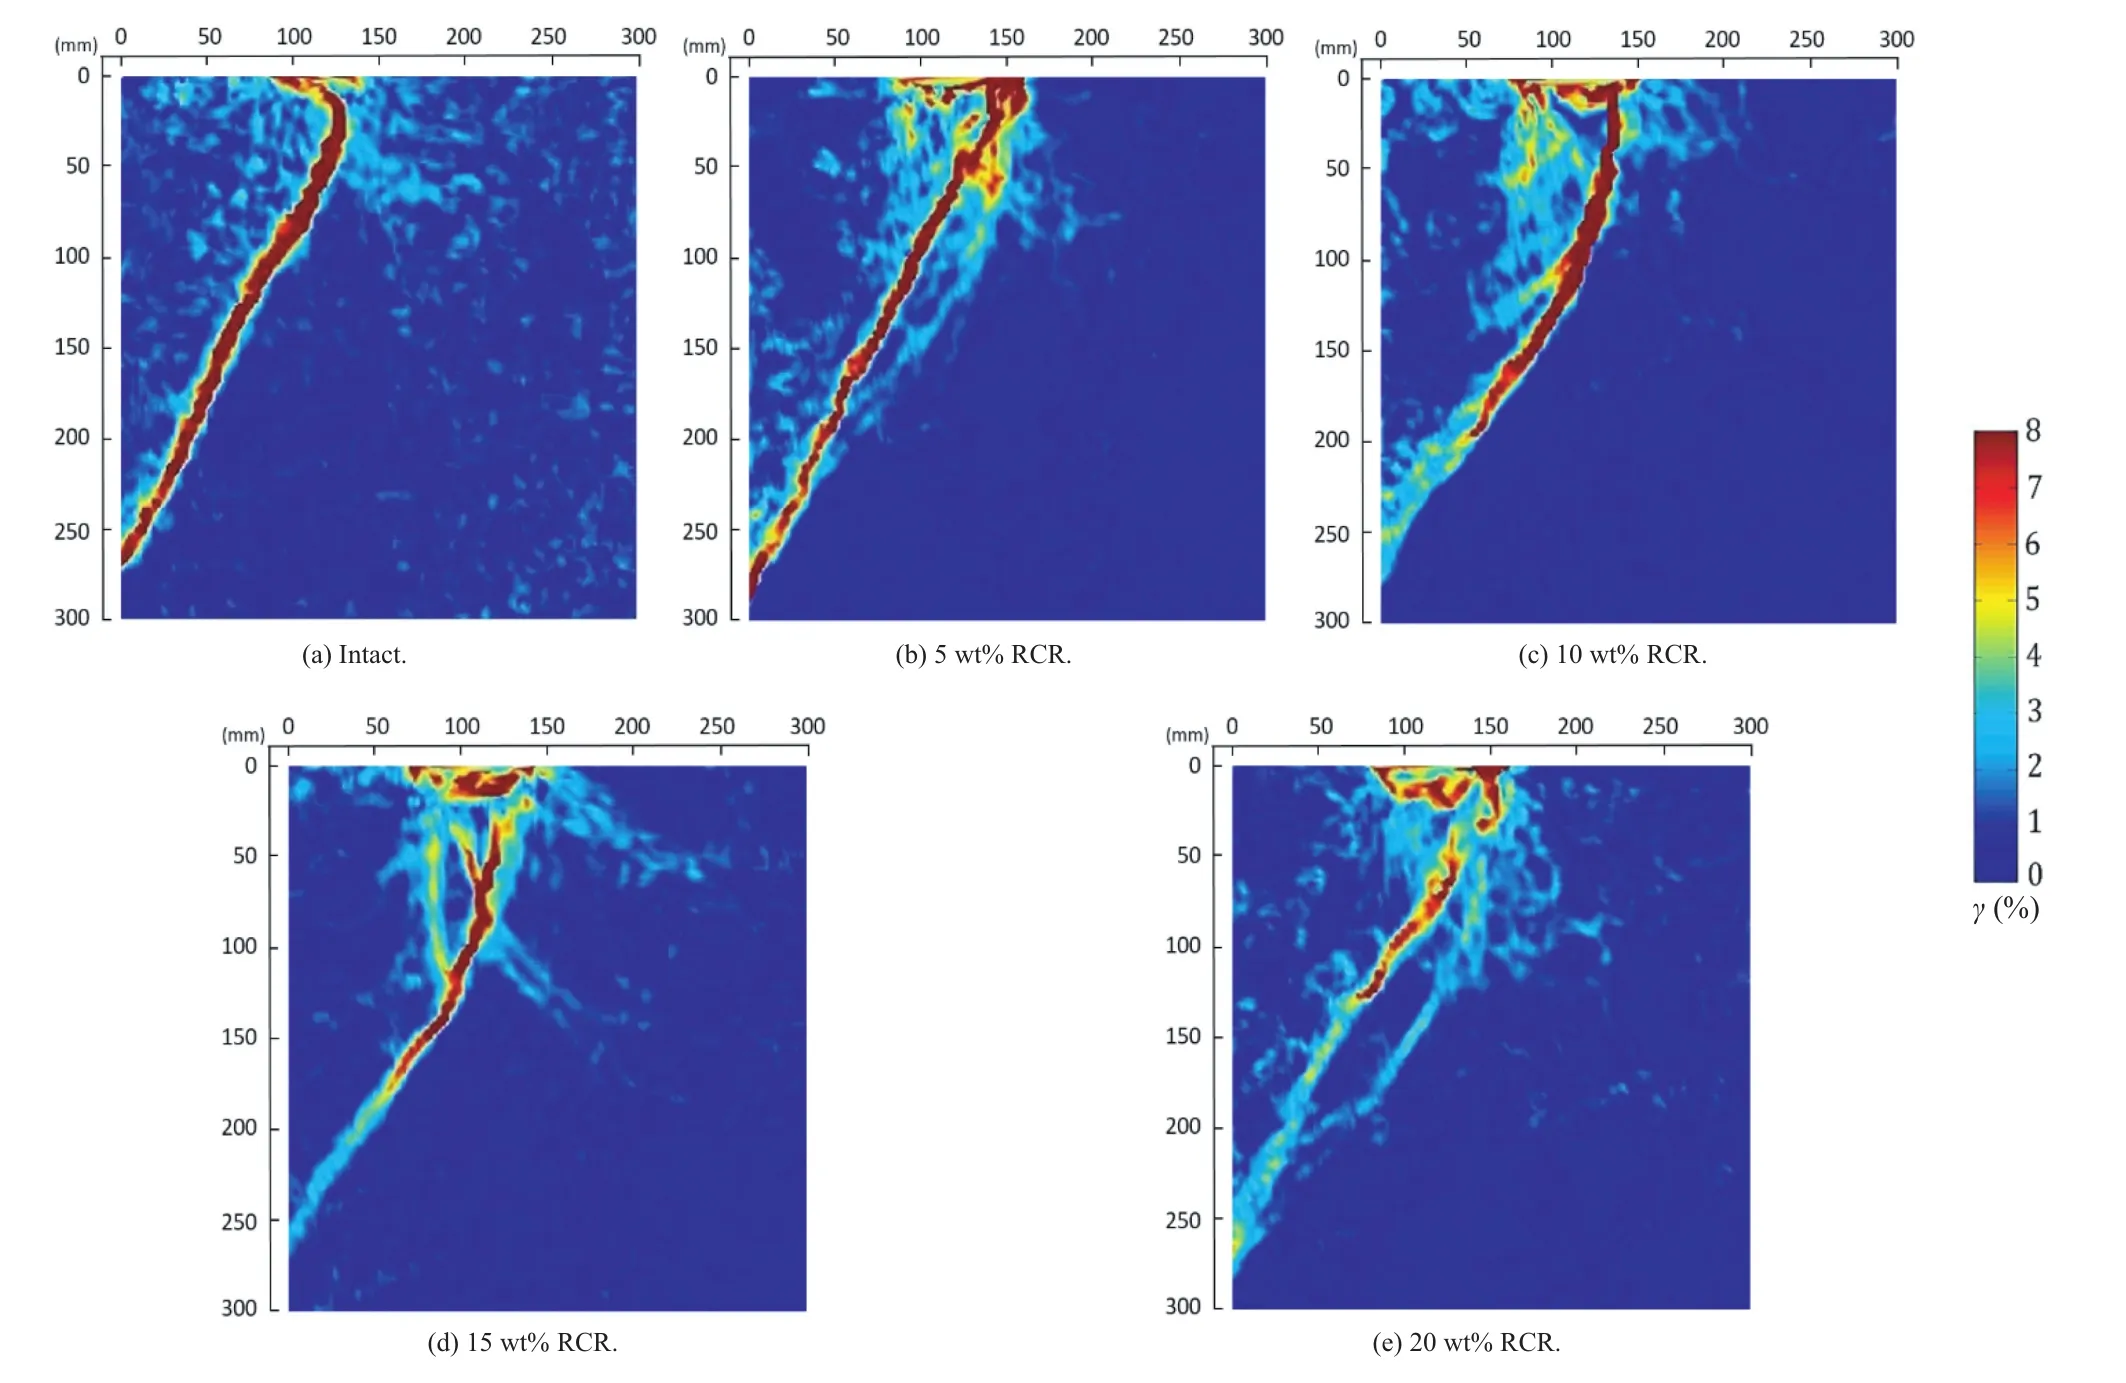
Fig.12.PIV results for S2 reinforcement with the diamond configuration in five mixtures.
The results of the footing bearing capacity and the wall horizontal displacement for all the RCR contents in the back fills are shown in Fig.9.The comparison of all the tests for the back fills with various RCR contents showed an 8.5%increase in bearing capacity of the sand mix with 5 wt%RCR compared with the RCR-free sand,a 17%increase of the sand mix with 10 wt%RCR compared with the sand mix with 5 wt%RCR,a 2.3%increase of the sand mix with 15 wt%RCR compared with the mix with 10 wt%RCR,and a 14.5%decrease of the sand mix with 20 wt%RCR compared with the mix with 15 wt%RCR.The maximum and minimum increases in bearing capacity of the wall were obtained for the mixes with 10 wt%and 15 wt%RCRs,respectively.However,addition of 5-15 wt%RCR exhibited a devastating effect on the bearing capacity of the wall.
The maximum bearing capacity was observed for the mixtures with 15 wt%RCR.Conversely,the maximum bearing capacity was observed in 61%of tests on the mixtures of sand and 15 wt%RCR and in 39%of the tests on the mixtures of sand and 10 wt%RCR.The mean increases in footing bearing capacity compared with sand fill were 31%and 27%for the mixtures of sand+15 wt%RCR and sand+10%RCR,respectively.
In all the tests,addition of 20 wt%RCR led to the elimination of the ascending trend of the bearing capacity increase because it was reduced in comparison with the fills with 10 wt%and 15 wt%RCRs.However,in 83%and 77%of the tests,the bearing capacity of back fill containing 20 wt%RCR was higher than that of back fill with 0 and 5 wt%RCRs,respectively.
The horizontal wall displacement revealed a descending trend with increasing RCR content.Such a behavior could be due to the reduced lateral pressure applied to the facing and the reinforcements.The average reductions of the wall horizontal displacement in fills containing 5 wt%,10 wt%,15 wt%and 20 wt%RCRs compared with that of sand- fill were 3.8%,8.4%,17.8%and 26%,respectively.These percentages showed are markable decrease in wall displacement for fills with 15 wt%and 20 wt%RCRs compared with those with 5 wt%and 10 wt%RCRs.Moreover,each 5%increase in RCR content of the fill led to 3.8%,4.85%,9.7%and 9.9%decreases in the wall displacement in comparison with the previous wall.The wall displacement decrease rate was not considerable when the sand- fill was changed to the mix with 5 wt%RCR and when the mix with 5 wt%RCR was changed to the one with 10 wt%RCR.Thus,addition of 5 wt%RCR did not cause a considerable change in the wall displacement.However,the wall displacement decrease was considerable between the mix with 10 wt%RCR and that with 15 wt%RCR.Furthermore,the wall displacement in the mix with 20 wt%RCR slightly decreased in comparison with that in the mix with 15 wt%RCR.Thus,the addition of 15 wt%RCR to the fill layers had a maximum effect on the wall displacement decrease,and it could thus be considered as the optimum weight percentage.
4.4.PIV results
The PIV results were compared in terms of the effects of the geometry and dimensions of the plate anchors,reinforcement configuration,and RCR content on the development of critical slip surface.Fig.10 illustrates this comparison for six reinforcements with the 5-anchor configuration embedded in the fill without RCR.The right-hand side of this figure depicts the strain range of particles.The wedge failure is fully formed in both small square and circular plates,which also have the highest strain on their slip surfaces.In the medium-sized square and circular anchor plates,the failure wedge is not fully formed,and the slip surfaces fade at fill depths and at a short distance from the facing.The strains on the failure surface of the walls stabilized with such reinforcements are limited,and small strains occur in the middle height of the wall.For square and circular anchor plates with large dimensions,the failure wedge is not practically formed,and only small slip surfaces are formed in the fill depth,which fades by moving a short distance from the footing.Regarding the geometry of the plate anchors,smaller strains occur on the slip surfaces of the circular plates in comparison with the square plates,proving their better performance in terms of wall stability.
The PIV analyses of anchor C2 embedded in the original soil with three configurations are presented in Fig.11.In agreement with the horizontal displacement,the slip surfaces for both the square and diamond configurations are fully developed.Nevertheless,the strain values on the slip surface of the diamond configuration are noticeably lower than those in the square configuration.This result could prove the lower displacement of this configuration than that of the square configuration.An incomplete failure wedge is developed in the soil reinforced with the 5-anchor configuration,and the strains on the critical slip surface reach their lowest value in the fill depth.
To assess the effect of RCR on the failure wedge,PIV analyses were performed for anchor S2 with a diamond configuration embedded in five different fills(Fig.12).A comparison between these designs shows that an increase in RCR content of the fills reduces the formation and expansion of the critical failure surface on the wall.Therefore,for fills with 15 wt%and 20 wt%RCRs,the failure wedge is not formed and the slip surface fades with depth.The particle strain on the critical slip surface considerably decreases with an increase in RCR content.The decrease in soil particle strain on the critical failure surface and the reduced expansion of the failure surface in the fills with 15 wt%and 20 wt%RCRs demonstrate the positive effect of RCR on the reduced lateral pressure applied to the entire wall and the lack of failure wedge formation.
5.Conclusions
In this study,90 laboratory models were prepared to investigate the stability of retaining walls reinforced with mechanical plate anchors and to evaluate the effect of adding RCR to their fills.The parameters,including the geometry,dimensions,and configurations of the plate anchors,and the addition of 5 wt%,10 wt%,15 wt%and 20 wt%RCRs,were also investigated.The main results derived from this work are highlighted as follows:
(1)In 77%of the experiments,the circular plates cause a larger bearing capacity than the square plates in the footing.In 55%of the experiments,the horizontal displacement of the retaining walls reinforced by these circular plates is less than that by the square plates.
(2)The 5-anchor configuration shows the highest bearing capacity due to its extra reinforcement,followed by the diamond and then by the square configuration.In the square configuration,the maximum displacement is observed in the middle wall height due to the large meshes(15 cm×15 cm)of the zones without reinforcement in the middle wall height.
(3)Fills with 15 wt%RCR exhibit the maximum bearing capacity.In the fills containing 20 wt%RCR,the bearing capacity is greater than those of the sand- fill and 5 wt%RCR and is less than those of the mixes with 10 wt%and 15 wt%RCRs.A descending trend of the wall horizontal displacement is observed by increasing the RCR content.The minimum wall horizontal displacement occurs in fills with 20 wt%RCR.
(4)The images of the PIV analysis indicate that the formation of the failure wedge in the 5-anchor and diamond configurations is less significant than that in the square configuration,with the large circular anchor plates having the best performance.The addition of RCR,especially at 15 wt%and 20 wt%contents,leads to a considerable decrease in slip surface propagation.
Conflicts of interest
The authors wish to confirm that there are no known conflicts of interest associated with this publication and there has been no significant financial support for this work that could have influenced its outcome.
 Journal of Rock Mechanics and Geotechnical Engineering2018年5期
- Journal of Rock Mechanics and Geotechnical Engineering的其它文章
- Pullout behavior of polymeric strip in compacted dry granular soil under cyclic tensile load conditions
- Blast-induced rock damage control in Fangchenggang nuclear power station,China
- A comparative study between gravel and rubber drainage columns for mitigation of liquefaction hazards
- Bearing behavior and failure mechanism of squeezed branch piles
- Dynamic properties and liquefaction behaviour of cohesive soil in northeast India under staged cyclic loading
- Saturated anisotropic hydraulic conductivity of a compacted lateritic soil
