Saturated anisotropic hydraulic conductivity of a compacted lateritic soil
Roberto Aguiar dos Santos,Edmundo Rogério EsquivelVárzea Grande Institute of Engineering,Federal University of Mato Grosso,Cuiabá,Mato Grosso,Brazil
bSão Carlos School of Engineering,University of São Paulo,São Carlos,São Paulo,Brazil
Keywords:Hydraulic conductivity Anisotropic behavior Lateritic soil Tropical soil Compacted soil
A B S T R A C T This study focuses on the saturated anisotropic hydraulic conductivity of a compacted lateritic clayey sandy soil.The effects of the molding water content and the confining stress on the anisotropic hydraulic conductivity are investigated.The hydraulic conductivity is measured with a flexible-wall permeameter.Samples are dynamically compacted into the three compaction states of a standard Proctor compaction curve:the dry branch,optimum water content and wet branch.Depending on the molding water content and confining stress,the hydraulic conductivity may increase or decrease.In addition,the results indicate that,when the samples are compacted to the optimum water content,lower hydraulic conductivity is obtained,except at a confining stress equal to 50 kPa.The increase of the confining stress decreases the hydraulic conductivity for each of the evaluated compaction states.In the wet branch,horizontal hydraulic conductivity is about 8 times higher than the vertical value.The anisotropic hydraulic conductivities of the dry and wet branches decrease when the confining stress increases,and the opposite is observed in the optimum water content state.
1.Introduction
Soil hydraulic conductivity is an important parameter in the evaluation of the water flow in porous media(Wang et al.,2012).Frequently,numerical water flow models consider soil as a homogeneous and isotropic material(Selim and Dabney,1986).However,the flow parallel to the layers is usually greater than that in the orthogonal direction.This can be explained by the presence of imperfections in the interface between layers or by the particle orientation caused by compaction loads(Witt and Brauns,1983;Kim,1996).Thus,the hydraulic conductivity is usually higher in the horizontal direction compared to the vertical direction(Boynton and Daniel,1985;Chen,2000).
In compacted soils,changes in compaction effort(Kim,1996),confining stress(Shafiee,2008)and dry density(Qiu and Wang,2015)interfere significantly in anisotropic hydraulic conductivity.However,the influence of the soil compaction procedure on anisotropic hydraulic conductivity is still poorly understood.The standard compaction test results in significant variation in the vertical pore profile of the samples(Fener and Yesiller,2013),which interferes with pore connectivity and,consequently,the anisotropic hydraulic conductivity along the compacted soil sample(Qiu and Wang,2015).
In compacted soil used for the construction of earth- fill dams,it is possible to measure anisotropic hydraulic conductivity.In large dams constructed in Brazil using compacted tropical soils,the anisotropic hydraulic conductivity increases with the increase in confining stress(Cruz,2004).The anisotropic hydraulic conductivity of earth dam core varies with its stress state and can be accurately measured with a flexible-wall permeameter(Zhu,1989).
The anisotropic hydraulic conductivity has been evaluated in some soil types.These evaluations have been performed in compacted clay(Kim,1996),bog peat(Beckwith et al.,2003),granuleclay mixtures(Shafiee,2008),and sandstone-mudstone particle mixtures(Qiu and Wang,2015).However,the evaluation of anisotropic hydraulic conductivity in compacted fine-grained lateritic soil has not been reported.
Recently,several studies have investigated the effect of water content on the hydraulic and mechanical properties of compacted lateritic soils(Osinubi and Nwaiwu,2002,2005,2006).When suitably compacted,the lateritic soils may display low hydraulic conductivity,which makes them an interesting alternative for contaminant retention barriers in sanitary land fills(Osinubi and Nwaiwu,2006).Land fill soils have been traditionally compacted using the water content-density criteria for compacted soil(Daniel and Benson,1990).However,some aspects related to mechanical and hydraulic responses of compacted lateritic soils are still poorly understood(Crispim et al.,2011).
Through hydraulic conductivity tests performedusing a flexible wall permeameter,this study aimed to evaluate the influences of confining stress and molding water content on the anisotropic hydraulic conductivity of a compacted lateritic sandy soil.To prevent variation of the hydraulic properties of the sample due to uneven porosity distribution,some procedures were adopted to obtain homogenous compacted samples.
2.Experimental design
2.1.Tested materials
A highly weathered lateritic soil collected in São Carlos(Brazil)was evaluated.This type of soil,widespread in tropical areas and subtropical climates,normally displays high porosity and collapsible behavior.This soil shows liquid and plastic limits and solid specific gravity of 33%,22%and 2.68,respectively.The plasticity index and liquid limit of studied soil are plotted on a plasticity chart,as shown in Fig.1.In this figure,A-line is a line that splits the chart between clays(C)above A-line and silts(M)below A-line.The vertical line(B-line)separates high-plasticity fine-grained soils(H)from low-plasticity fine-grained soils(L).
The particle-size distribution curve presents the following soil fractions:sand(59%),silt(9%)and clay(32%)(Fig.2).Thus,this material can be classified as a clayey sand(SC),according to the unified soil classification system(USCS).
2.2.Sample preparation
The effect of fabric on the behavior of compacted soils can be of great significance(Toll,1990).Compacted clays do not exist as a uniform mass of clay particles,but as a set of particle aggregations(Croney et al.,1958).Toll(2000)studied the effects of the compactive effort and degree of saturation on the degree of aggregation of a lateritic gravel from Kenya.This author noted that the degree of saturation of a compacted soil could indicate the amount of aggregation presented.Clod size has significant influence on the hydraulic conductivity of compacted soils(Daniel and Benson,1990).Therefore,samples used to obtain the compaction curve display different degrees of aggregation and pore structures.This typical compacted soil behavior justifies the choice of different compaction states to evaluate soil hydraulic properties.
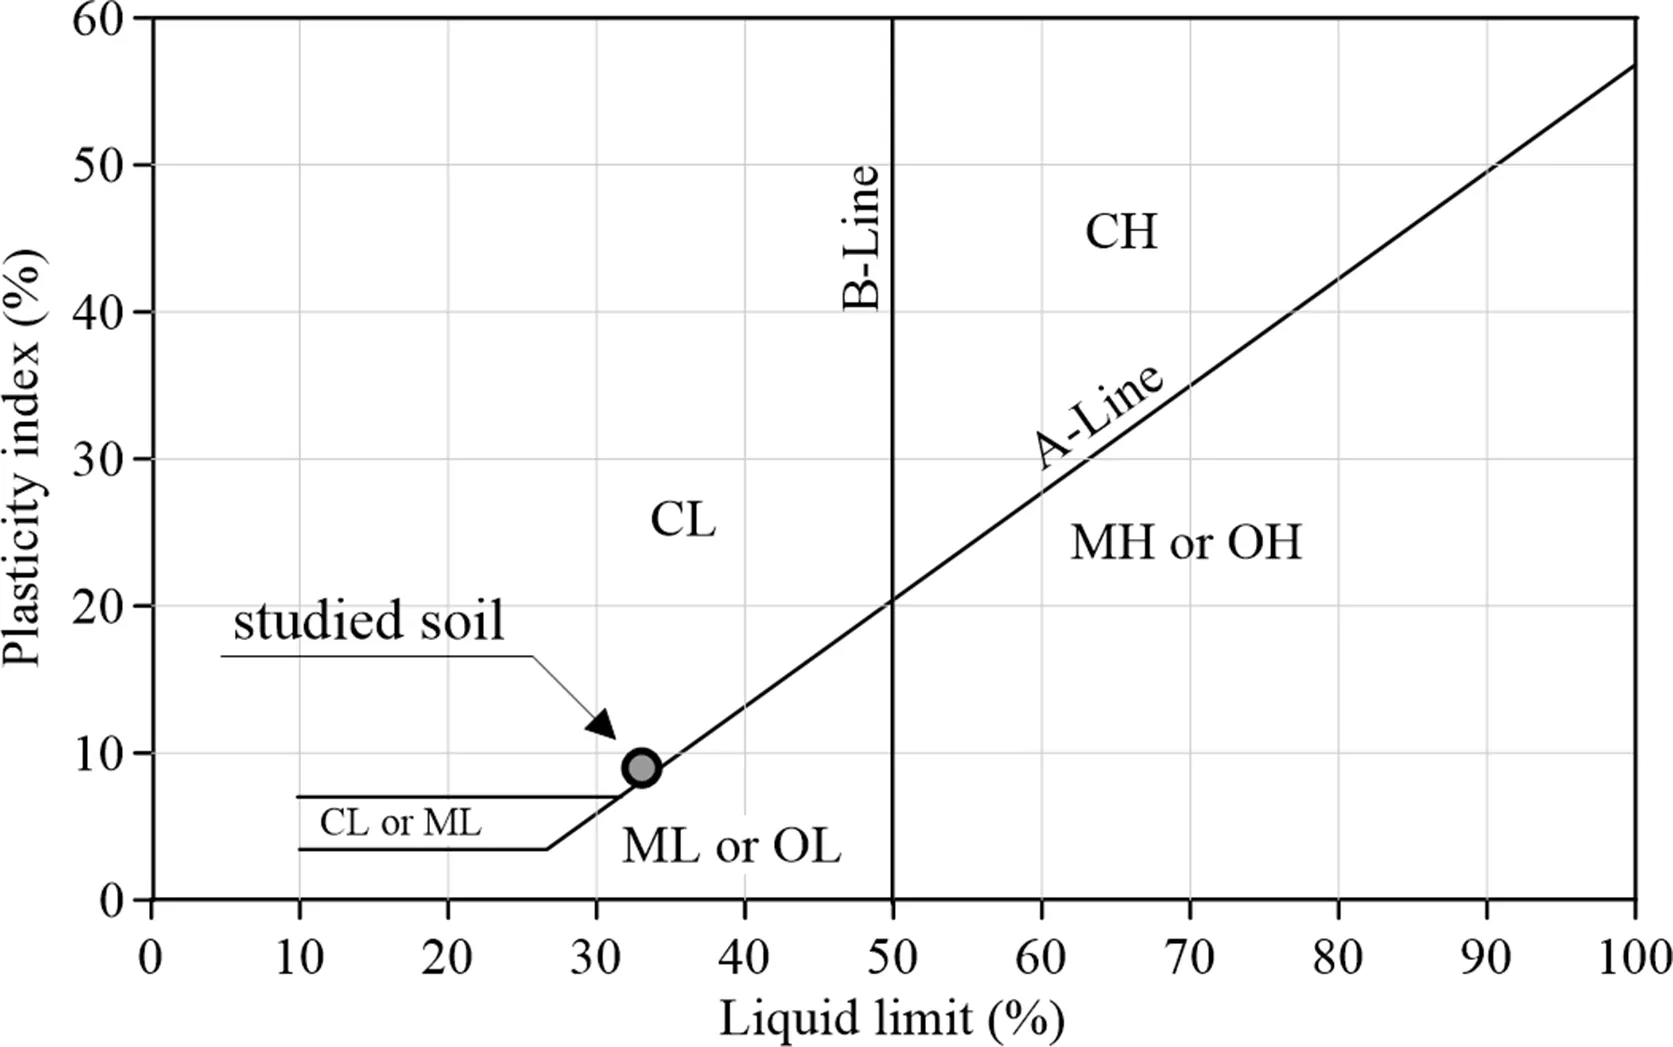
Fig.1.Plasticity chart of the soil used in this study.
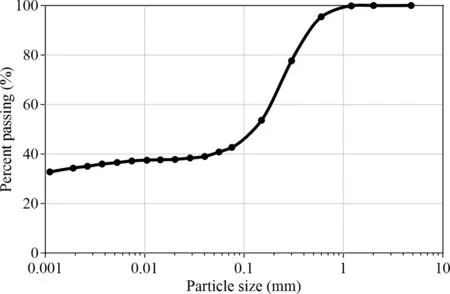
Fig.2.Particle-size distribution curve of the soil used in the present study.
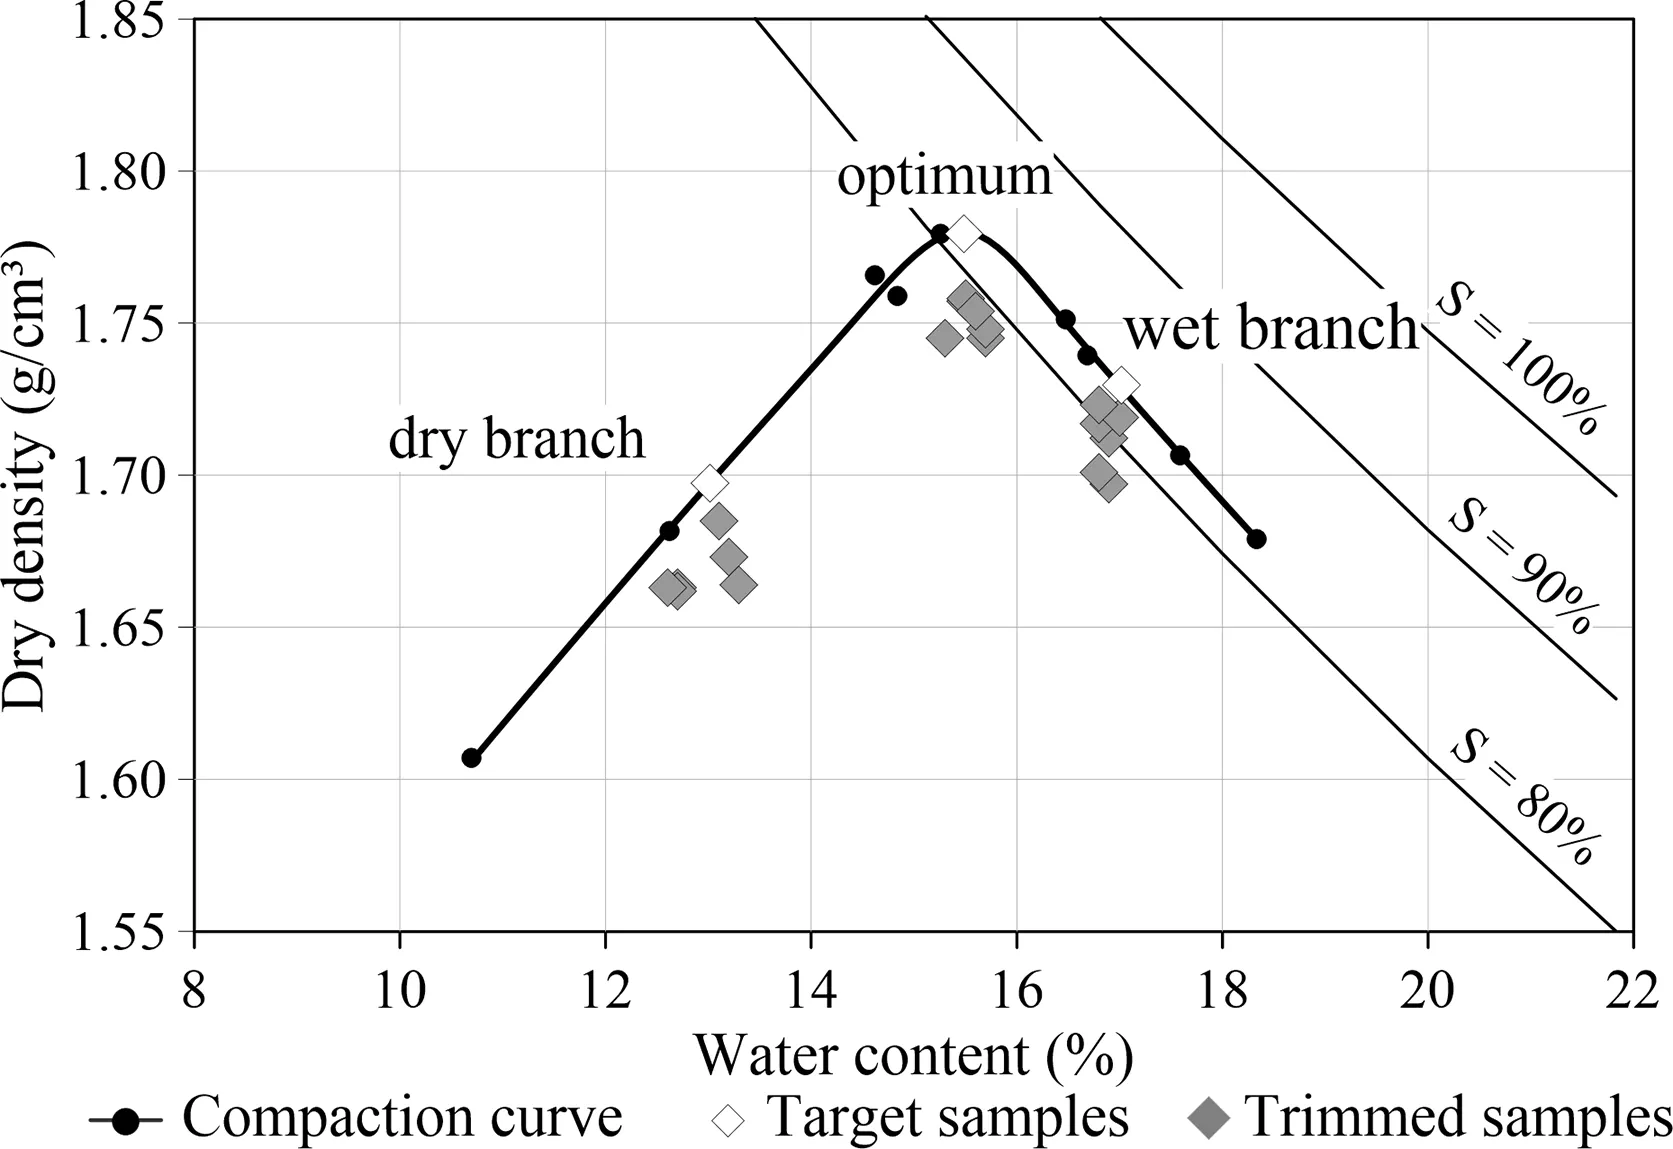
Fig.3.Compaction curve and samples used in the hydraulic conductivity tests.
Fig.3 displays the compaction curve of the target samples and trimmed samples,obtained from standard Proctor tests performed with 9 samples.In this figure,S represents the degree of saturation.From compaction curve,the maximum dry density(ρdmax)of 1.78 g/cm3and optimum water content(wot)of 15.5%were calculated.Fig.3 also displays the target samples,which are associated with the target compaction state.The three compaction states used in this research were the dry branch,optimum water content and wet branch.Each of these points was determined from the predetermined compaction curve.
To represent the conditions corresponding to the dry branch,optimum water content and wet branch,two target samples of each compaction state were compacted,at compaction degrees(ratio of compacted to maximum dry densities)of 95%,100%and 97%and molding water contents of 13%,15.5%and 17%,respectively.After compaction,samples were trimmed in vertical and horizontal directions(trimmed samples).A good agreement between the data of trimmed samples and the compaction curve was observed.
Each target sample was compacted in a metallic cylindrical mold with a diameter of 15.59 cm and a height of 12.72 cm.The samples were prepared through 7 layers of compaction.For better bonding with the next layer,each layer was scored after compaction.The molding water content of the soil and the height of each compacted layer were controlled to ensure that the target dry density was reached.To prevent excessive densification of the lowest layers,each layer was compacted at different heights.During sample compaction,the wet soil mass was the same for all compacted layers,thus the target dry density was obtained by controlling the height of each layer.The first layer was compacted at dry density 3.31%lower than the target one,while the last layer was compacted at dry density 3.31%greater than the target one.A linear increase of dry density was considered in the compaction of the intermediate layers.For each layer,the compactive effort was increased towards the top by decreasing the height of each layer.The soil was compacted by a hammer falling freely,distributing efforts across the upper face of each compacted layer inside the metallic cylindrical mold.Further details regarding the adopted compaction procedure can be found in Santos(2015).
Using the target samples,samples trimmed in vertical and horizontal directions were obtained(Fig.4).Each trimmed sample was 5 cm in diameter and 10 cm in height.In the first case,the sample was positioned in orthogonal direction from the compaction layers,i.e.the vertical direction(θ=90°).In the second case,the sample axis was positioned parallel to the compaction layers,i.e.the horizontal direction(θ=0°).
The dispersion of the dry density and water content of the compacted samples can be evaluated by the coefficient of variation,which evaluates the dispersion of data points in a series of data around the mean,evaluated by the ratio of the standard deviation to the mean.As listed in Tables 1 and 2,the coefficients of variation of dry density and water content are very low,which are less than 1%.This low dispersion indicates significant homogeneity of the samples tested.Table 1 displays the reduced variability of dry density obtained herein(0.09%-0.58%),proving the greater homogeneity of the compacted sample.The typical coefficient of variation for dry density ranges from about 2%to 13%(Phoon and Kulhawy,1999).Therefore,even without replication of the hydraulic conductivity tests,the reduced variability of dry density of the sample evaluated herein provides greater confidence in the experimental results.
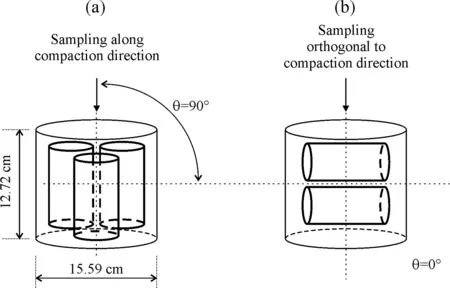
Fig.4.Schematic view of the sample trimming process in two orthogonal directions.
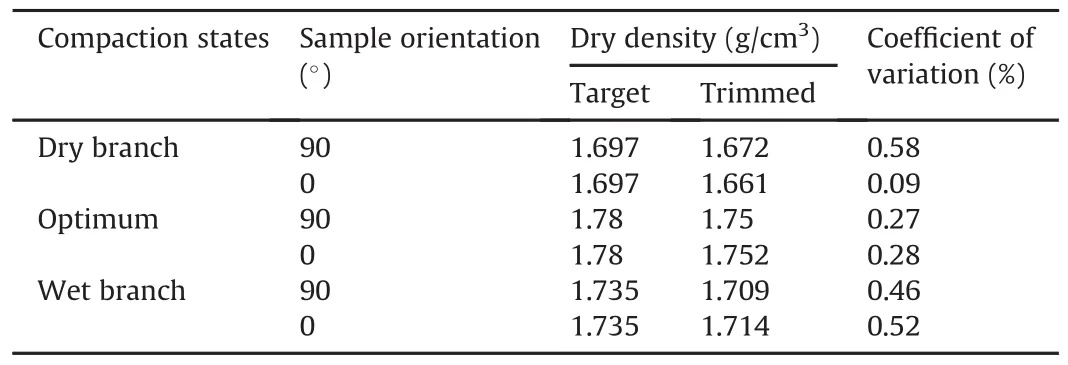
Table 1Average dry density and coefficient of variation of the trimmed samples for hydraulic conductivity tests.
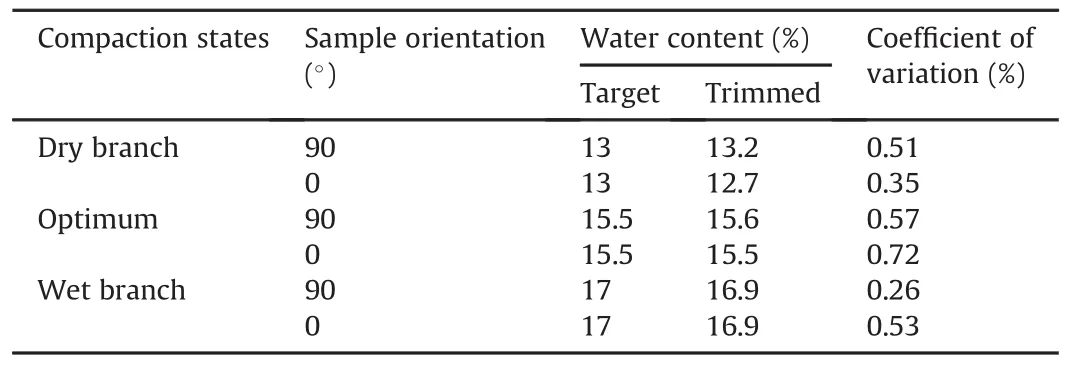
Table 2Average water content and coefficient of variation of the trimmed samples for hydraulic conductivity tests.
One of the samples was used to measure the water content and density profiles along the sample after compaction,in order to register the degree of homogeneity obtained.This sample was compacted in a cylindrical mold of 5 cm in diameter and 10cm in height at optimum water content and maximum drydensity.After compaction,the dry density in three different positions along the sample was obtained by means of the paraffin wax method,according to ASTM D4531-15(2015).Table 3 displays the dry density and water content of this sample.Similar values along the profile indicate that the variability of these properties will have slight influence on the results of hydraulic conductivity tests.Thus,this homogeneity implies a greater confidence in the hydraulic conductivity results.
2.3.Hydraulic conductivity test procedure
The hydraulic conductivity values obtained for the samples trimmed in horizontal and vertical directions,respectively,corresponded to hydraulic conductivities in the parallel(kh)and orthogonal(kv)directions of the compaction layers.The hydraulic conductivity tests were performed using a flexible-wall permeameter,according to ASTM D5084-16a(2016).This test was performed on samples saturated by back pressuring,with a Skempton B-value in excess of 98%.After the saturation process,these samples were isotropically consolidated under confining stresses of 50 kPa,100 kPa and 200 kPa.Subsequently,the water flow through the soil was allowed by upward flow.In this test,the Darcy’s law is assumed to be valid and hydraulic conductivity was calculated by

where k is the hydraulic conductivity,Q is the water flow,i is the hydraulic gradient,and A is the cross-sectional area of the sample.
During the hydraulic conductivity test,variation in water temperature was monitored.Then,the hydraulic conductivity(k)was corrected for hydraulic conductivity at 20°C(k20)by(ASTM D5084-16a,2016):

where RTis the ratio of the water viscosity at the test temperature to water viscosity at 20°C;T is the average test temperature during the stage trial((T1+T2)/2),to the nearest 0.1°C,in which T1and T2are the test temperatures at the start and the end of the permeation trial,respectively,to the nearest 0.1°C.

Table 3Water content and dry density profiles along the compacted sample.
2.4.Pore size distribution measurement using mercury intrusion porosimetry
Most studies on granular soil have shown the influence of the compaction methods on the microstructure of the compacted soil(Chapuis et al.,1989).However,less attention has been paid to the influence of the molding water content(Davoudi and Lefebvre,2005).
The microstructure experimental study is important for the understanding of the hydraulic and mechanical properties of the compacted soil(Delage et al.,1996).Mercury intrusion porosimetry(MIP)has been widely used to describe the pore network and its size distribution in compacted clayey soils(Romero and Simms,2008).This test was performed on a compacted sample at three compaction states(dry branch,optimal moisture and wet branch).PoroSizer 9320 porosimeter was utilized and it can apply the maximum mercury injection pressure of 207 MPa.With this pressure,the equipment is capable of filling all pores larger than 6 nm.
3.Results and discussion
3.1.Effect of molding water content on pore size distribution
The pores between soil particles can be classified,according to their dimensions,into two groups:inter-aggregate pores(macropores)and intra-aggregate pores(micropores)(Delage and Lefebvre,1984).Inter-aggregate pores refer to existing voids between aggregates,while intra-aggregate pores are those existing between the particles(Delage and Lefebvre,1984).Regardless of the condition of the soil(undisturbed or compacted),conventionally,micropores are considered those smaller than 0.3μm,while macropores are those larger than 0.3μm(Romero,1999).
Fig.5 displays the pore size density functions for each of the investigated compaction states.From these data,it is possible to observe that all the compacted samples display a clear bimodal curve.The molding water content causes changes in the interaggregate porosity of the samples.The macropore sizes of the compacted samples at optimum water content,dry branch and wet branch were 15 μm,17 μm and 23 μm,respectively.Thus,the wet branch is associated with a larger aggregate size.However,the intra-aggregate porosity of soil was not influenced by molding water content.
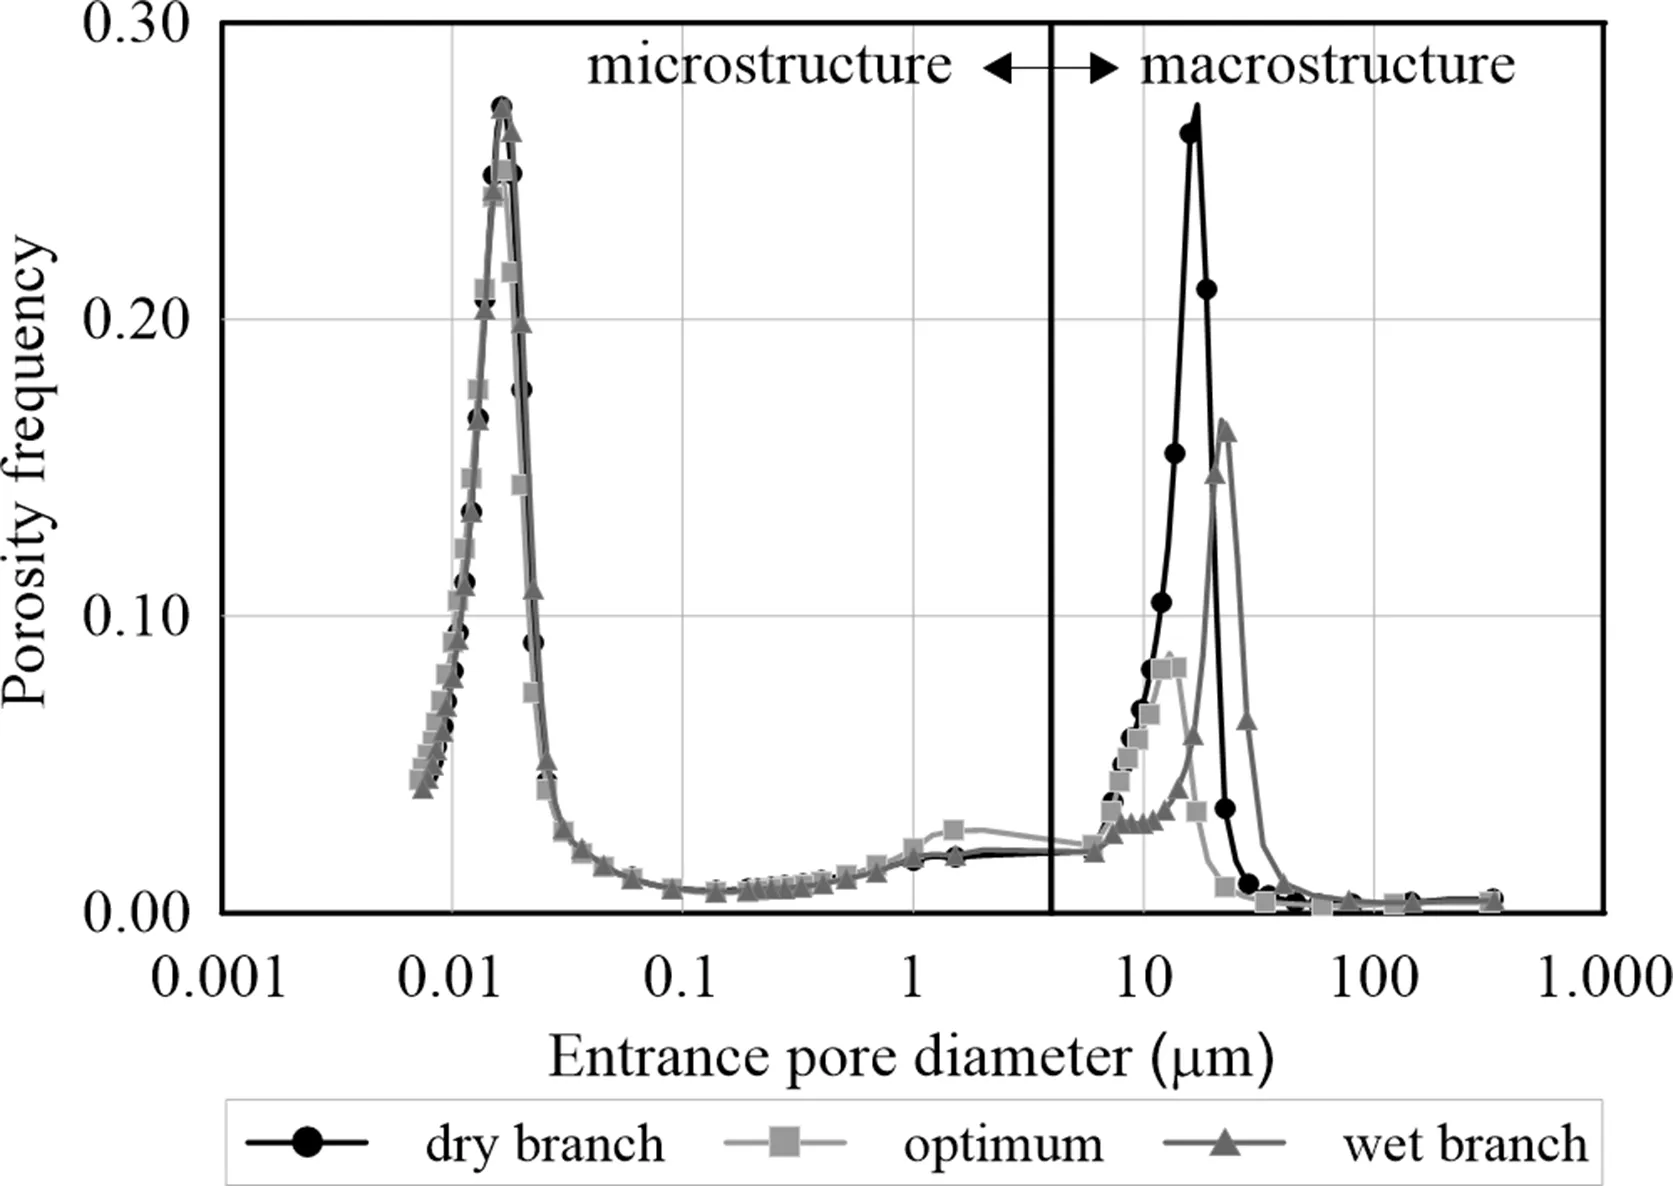
Fig.5.Mercury intrusion pore size distribution curves corresponding to the three compacted sample conditions evaluated in the present study.
3.2.Hydraulic conductivity
Fine-grained lateritic soils can be used as the core of embankment dams,pavement and barrier layers,and under such conditions,these materials are inherently anisotropic due to the compaction method applied.Confining stress also affects fabric anisotropy(Shafiee,2008).Soil confining stresses simulate loading conditions on soil elements in the field.Experimental results indicate that the hydraulic characteristic of the soil samples is strongly dependent on confining stress(Ng and Pang,2000).
3.2.1.Influence of confining stress on hydraulic conductivity
Fig.6 shows the effect of confining stress on the hydraulic conductivity of the trimmed samples.The results indicate that,when the sample was compacted at optimum water content,a lower hydraulic conductivity was obtained,except at the confining stress of 50 kPa.The smaller pore size in this molding water content implies lower hydraulic conductivity.
The increase in confining stress causes decrease in hydraulic conductivity for each of the evaluated compaction states,greater for confining stresses of 50 kPa and 100 kPa compared to 200 kPa.The increase in confining stress reduces the void ratio of the soil,contributing to the reduction of the hydraulic conductivity of the soil.Under a confining stress of 200 kPa,the void ratio reduction(caused by this confining stress)was not enough to cause a significant decrease in hydraulic conductivity.Thus,under high confining stresses,there was no significant decrease in hydraulic conductivity(Shafiee,2008).
Davoudi and Lefebvre(2005)demonstrated that the interconnectivity of intra-aggregate pores influences the hydraulic conductivity of the soil.The high reduction of the hydraulic conductivity at the confining stress of 100 kPa indicates a decrease in the connectivity of the intra-aggregate pores.This statement is independent of sample orientation.The small difference between the hydraulic conductivity at the confining stress of 100 kPa and 200 kPa is associated with soil macrostructure.In this arrangement,there is no significant decrease in the connectivity of the intraaggregate pores.
An influence of confining stress on anisotropic hydraulic conductivity was observed,as displayed in Fig.7.The hydraulic conductivity ratio measurement in the horizontal direction ranged from
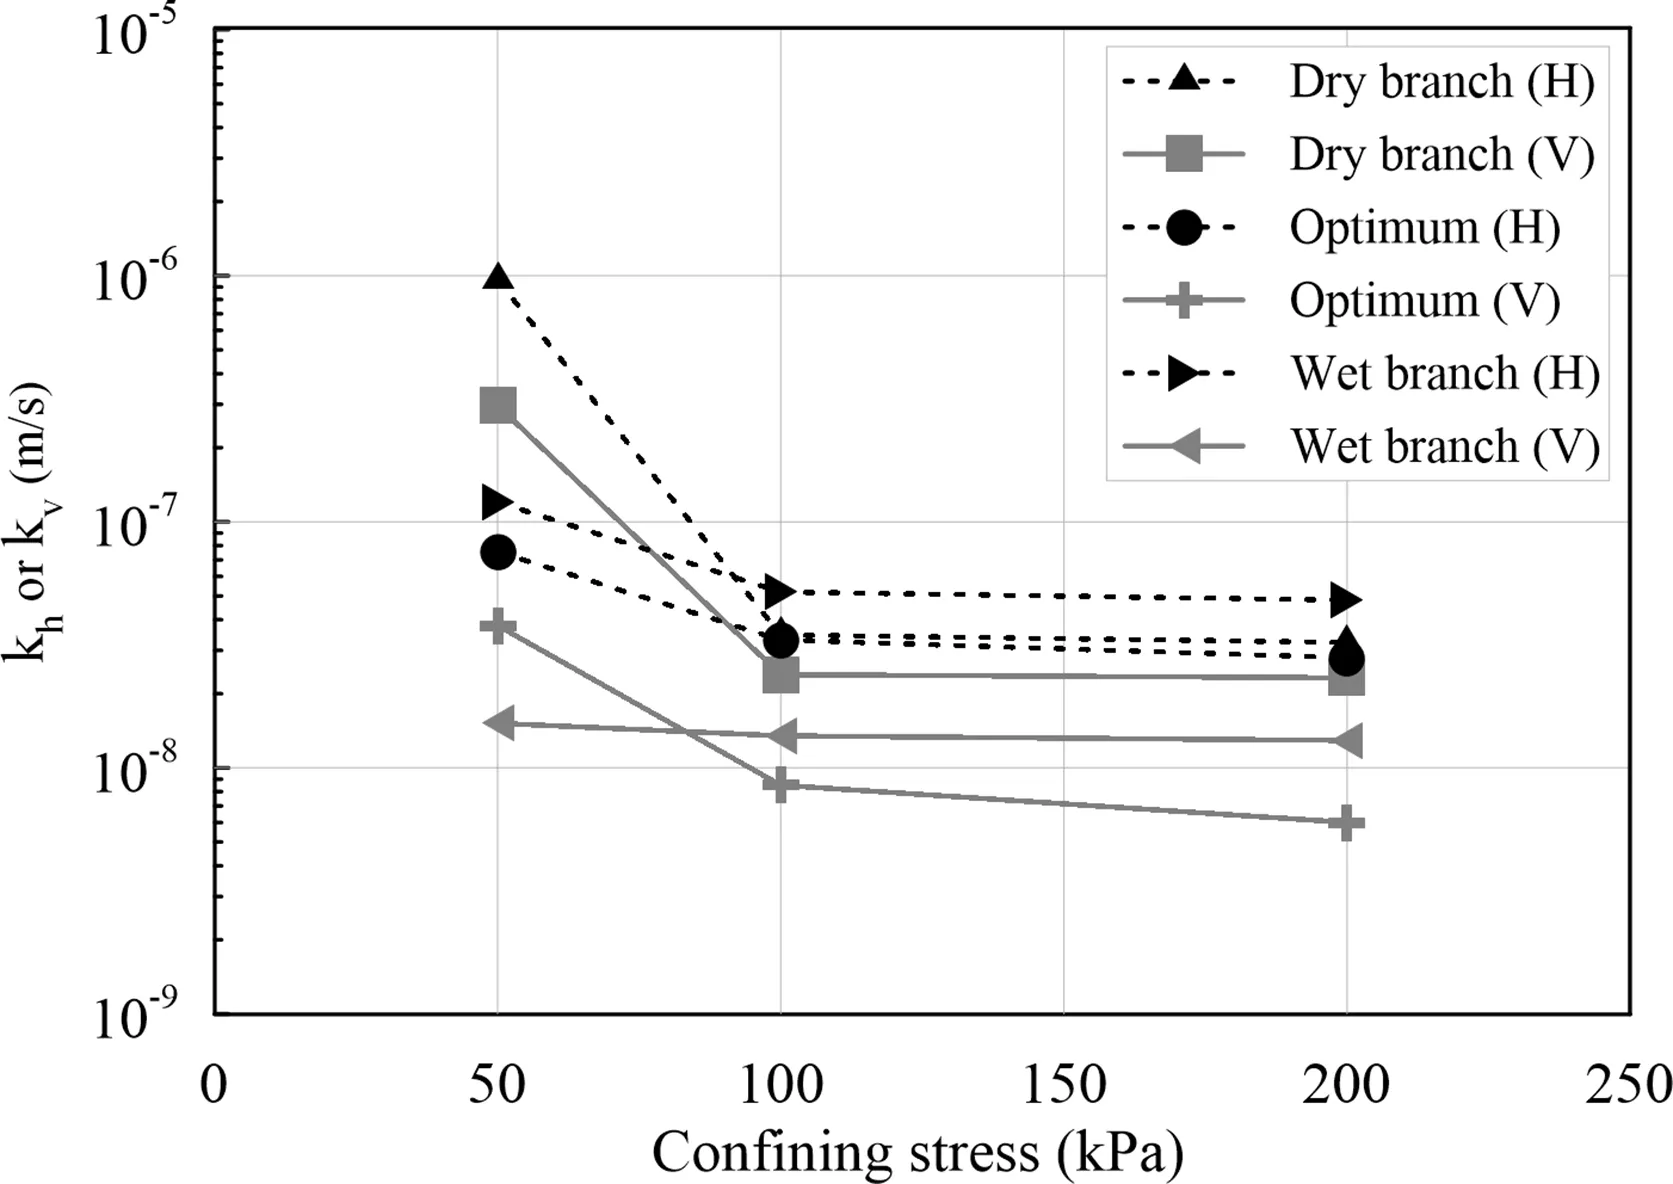
Fig.6.Effect of confining stress on hydraulic conductivity.V represents kv,and H stands for kh.
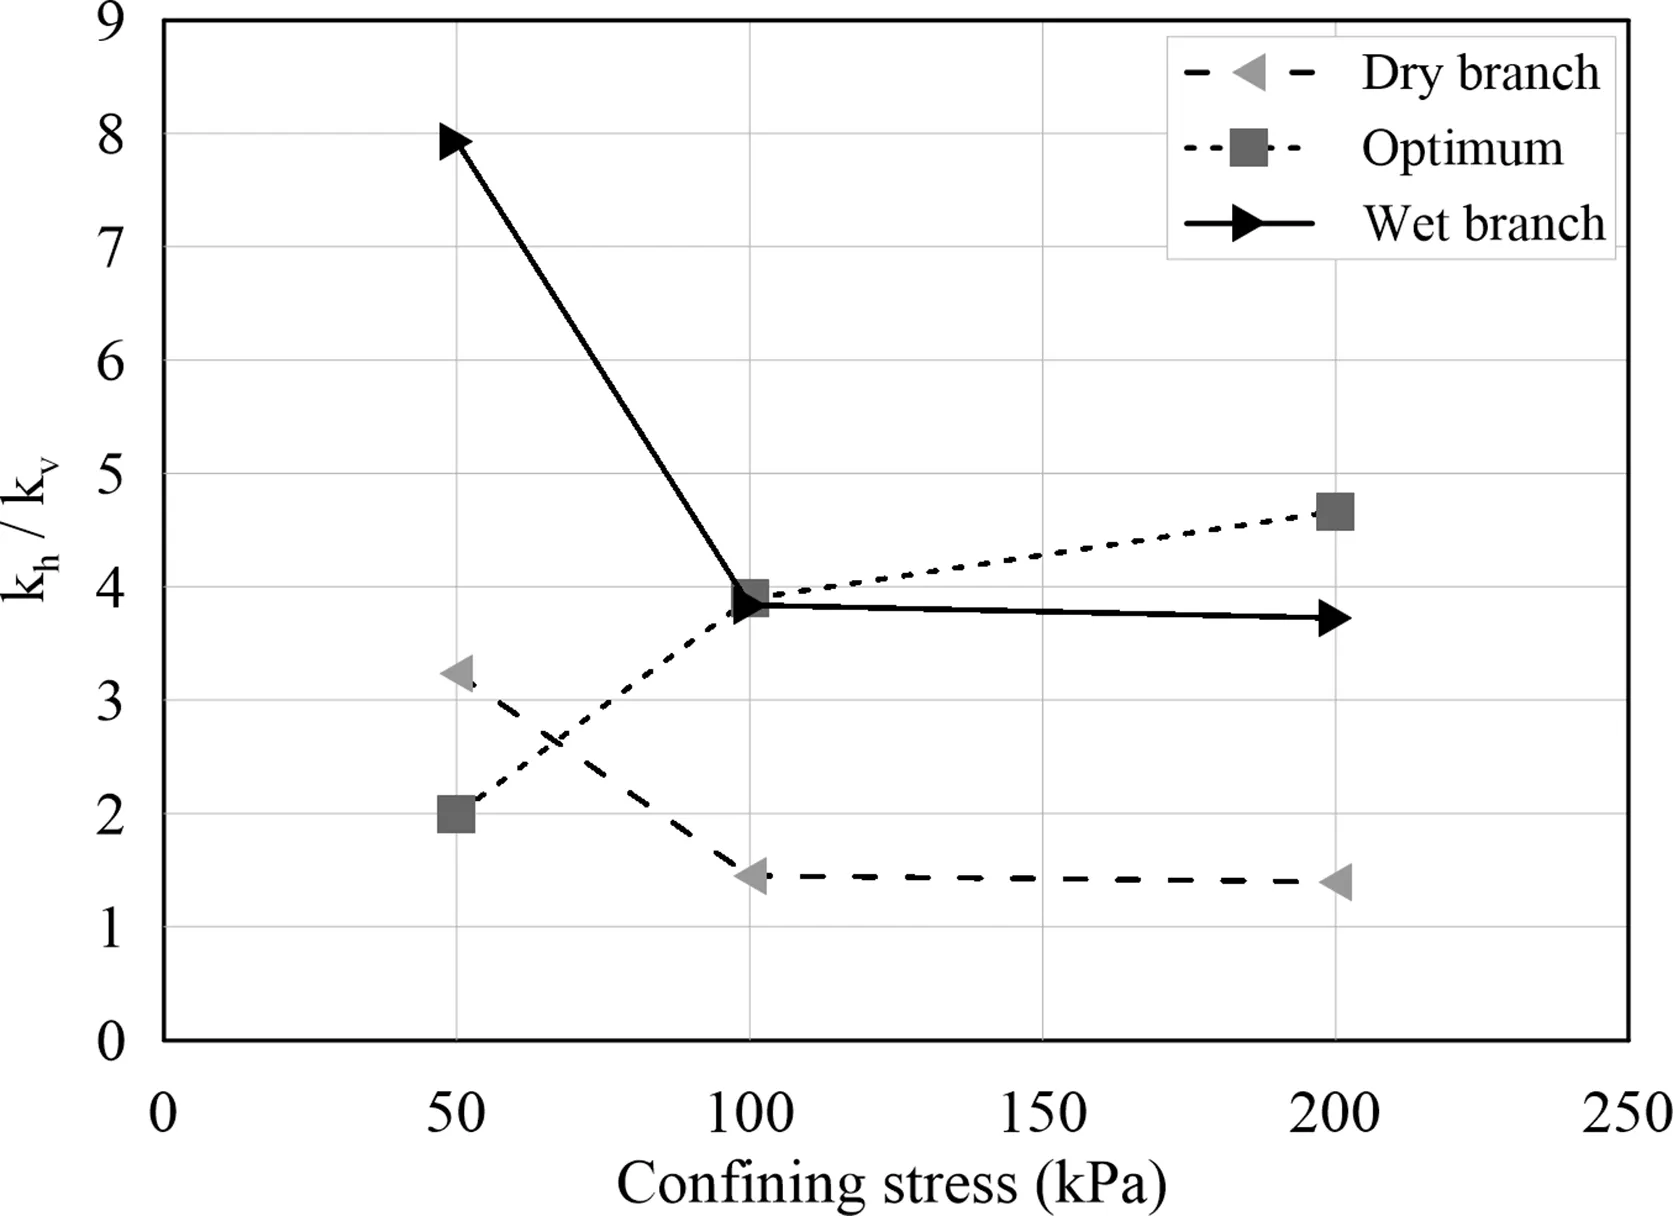
Fig.7.Effect of confining stress on anisotropic hydraulic conductivity.
3.2.2.Influence of confining stress on anisotropic hydraulic conductivity1.4 to 7.9,greater than that in the vertical direction.Greater anisotropic hydraulic conductivity in the wet branch was observed for a confining stress of 50 kPa.Moreover,greater anisotropic hydraulic conductivity in the dry branch was detected for a confining stress of 200 kPa.The anisotropic hydraulic conductivity on the dry and wet branches decreased when the confining stress increased,while the opposite occurred at optimum water content.Thus,compaction state and confining stress both affect soil hydraulic proprieties.
The effect of confining stress on anisotropic hydraulic conductivity is associated with soil microstructure.Shafiee(2008)indicated that the compaction energy transferred to the sample induces a weak heterogeneity,while the applied confining stress stabilizes this induced heterogeneity.On the dry and wet branches,when the confining stress was increased,a reduction of anisotropic hydraulic conductivity was observed.In addition,different state compactions and confining stresses result in different void ratios or porosities.According to Qiu and Wang(2015),anisotropic hydraulic conductivity is a linear function of the compacted sample porosity.They observed an increasing tendency of anisotropic hydraulic conductivity when porosity was less than approximately 31%,while this tendency decreased when porosity was greater than 31%.However,they did not evaluate the effect of confining stress.
Among the compacted states evaluated herein,anisotropic hydraulic conductivity is associated with porosity and confining stress simultaneously.Samples at optimum water content presented the lowest porosity,while the wet branch presented the highest porosity.The increase in anisotropic hydraulic conductivity with increasing confining stress could be associated with lower sample porosity.At lower porosity(optimum water content),the anisotropic hydraulic conductivity increased with increasing confining stress.On the other hand,at higher porosity(dryand wet branches),anisotropic hydraulic conductivity decreased when the confining stress increased.Therefore,the horizontal hydraulic conductivity is greater than the vertical one,although this strongly depends on the molding water content and applied confining stress.
4.Conclusions
Saturated hydraulic conductivity tests were performed on a compacted lateritic sandy soil.The effects of molding water content and confining stress on the anisotropic hydraulic conductivity were investigated.All tests were performed on the heterogeneous samples with low dry density.This behavior brings greater confidence to the test results.The MIP tests confirmed bimodal pore distribution.Molding water content causes changes in the inter aggregate porosity of the samples.However,intra-aggregate porosity was not influenced by this parameter.
Increasing confining stress with decreasing hydraulic conductivity for each of the compaction states was evaluated.The results indicate that,when the sample was compacted at optimum water content,lower hydraulic conductivity was obtained,except for the confining stress of 50 kPa.The anisotropic hydraulic conductivities of the dry and wet branches decreased with increasing confining stress,while the opposite was observed at optimum water content.This property depends on molding water content and applied confining stress,thus both parameters should be evaluated together.Higher anisotropic hydraulic conductivity was observed in the wet branch.However,the results reported herein are limited,since each test was performed on a unique sample and without replication.Thus,more testing is needed to confirm and extend our findings.
Conflicts of interest
We wish to confirm that there are no known conflicts of interest associated with this publication and there has been no significant financial support for this work that could have influenced its outcome.
List of symbols
w Water content
wotOptimum water content
ρdDry density
ρdmaxMaximum dry density
θ=90°Sampling along compaction direction
θ=0°Sampling orthogonal to compaction direction
k Hydraulic conductivity
k20Hydraulic conductivity corrected for temperature of 20°C
khHydraulic conductivity in the orthogonal to compaction direction
kvHydraulic conductivity in the parallel to compaction direction
kh/kvHydraulic conductivity ratio
Q Water flow
A Cross-sectional area of the sample
B Pore pressure coefficient
S Degree of saturation
i Hydraulic gradient
RTViscosity ratio of the water used in the test to 20°C
T Water temperature during flow application
T1Test temperature at the start of the permeation trial,to the nearest 0.1°C
T2Test temperature at the end of the permeation trial,to the nearest 0.1°C
 Journal of Rock Mechanics and Geotechnical Engineering2018年5期
- Journal of Rock Mechanics and Geotechnical Engineering的其它文章
- Dynamic properties and liquefaction behaviour of cohesive soil in northeast India under staged cyclic loading
- Blast-induced rock damage control in Fangchenggang nuclear power station,China
- A comparative study between gravel and rubber drainage columns for mitigation of liquefaction hazards
- Bearing behavior and failure mechanism of squeezed branch piles
- Experimental evaluation of mechanically stabilized earth walls with recycled crumb rubbers
- Influence of cement- fly ash-gravel pile-supported approach embankment on abutment piles in soft ground
