Numerical modeling of thermally-induced fractures in a large rock salt mass
D.T.Ngo,F.L.Pellet
MINES ParisTech,PSL Research University,Fontainebleau,France
Keywords:Fracture mechanics Thermal loading Extended finite element method(XFEM)simulation Rock salt
A B S T R A C T Numerical modeling of thermally-induced fractures is a concern for many geo-structures including deep underground energy storage caverns.In this paper,we present the numerical simulation of a large-scale cooling experiment performed in an underground rock salt mine.The theory of fracture mechanics was embedded in the extended finite element code used.The results provide reliable information on fracture location and fracture geometry.Moreover,the timing of the fracture onset,as well as the stress redistribution due to fracture propagation,is highlighted.The conclusions of this numerical approach can be used to improve the design of rock salt caverns in order to guarantee their integrity in terms of both their tightness and stability.
1.Introduction
The fracturing of rocks developed by thermally generated stress is an important subject for many geo-structures.These include geothermal systems where large temperature variations are naturally developed in the rock mass.In this case,thermally-induced fractures are beneficial as they facilitate the fluid flow and increase the exchange surface(Tarasovs and Ghassemi,2011;Ghassemi and Tarasovs,2015;Pellet,2017).In other situations,the fractures are unwanted.This is the case for underground caverns for the storage of hydrocarbons(gas and oil)or energy.
In recent years,new concepts for underground energy storage appeared to cope with the fluctuating consumer demand(Thoms and Gehle,2000).These innovative modes of energy storage(such as compressed air energy storage(CAES),and high-frequency cycled gas-storage cavern)are characterized by large withdrawal rates and high operation frequency(Ibrahim et al.,2008).The quick gas depressurization due to the withdrawal of massive amounts of gas leads to large decreases in temperature inside the storage cavern.According to Bérest et al.(2012),the temperature drop can be in the range of several dozens of degrees,depending on the withdrawal rate.
For a long time,rock salt has been considered to be an ideal medium for energy storage caverns because of its low permeability and self-healing ability(Gloyna and Reynolds,1961;Cosenza et al.,1999;Chen et al.,2013).However,the relatively low tensile strength of rock salt combined with the intense operating conditions raises concerns about the integrity of salt caverns(Sriapai et al.,2012;Missal et al.,2015;Wisetsaen et al.,2015).More specifically,the tensile stress induced by temperature drops can exceed the tensile strength of rock salt and generate fractures that create pathways for gas leakage.In severe circumstances,these fractures propagate deep inside the rock mass,triggering instabilities such as collapse of the cavern roof or walls.Actual observations of thermal fractures and several spalling events induced by temperature changes in gas caverns were documented and discussed in Pellizzaro et al.(2011),Zapf et al.(2012),and Bérest et al.(2014).Additionally,the thermal fractures may act as seeding fractures where high pressure can penetrate and cause stress concentrations at the tips of these thermal fractures pushing them to propagate further.
Several accidents occurred in underground storage caverns,which led to the development of more comprehensive approaches for the design of underground salt caverns(Bérest and Brouard,2003).Several constitutive laws or stability criteria have been derived to account for the more complex behaviors observed in rock salt(Cristescu,1993;Nazary Moghadam et al.,2015).However,these time-dependent constitutive laws are only relevant for describing the long-term behavior of rock salt under compressive stresses,whereas the short-term behavior under tensile stresses is predominantly elastic-brittle(Bérest and Brouard,2003).
Meanwhile,numerical modeling using the finite element method(FEM)has been extensively utilized for cavern design(Dawson et al.,2000;Wang et al.,2013;Deng et al.,2015).However,the classical numerical approaches(e.g.FEM)do not account for discontinuities(i.e.cracks and fractures)that can be generated due to excessive tensile stress.To address this problem,new numerical methods have emerged,such as the extended finite element method(XFEM),in which fracture mechanics theory is embedded.XFEM allows modeling generation and propagation of cracks of arbitrary geometries without the need to remesh the domain under study.
The focus of the current paper is to model the fracturing process in rock salt due to rapid cooling.A large-scale cooling test performed in an underground salt mine is modeled using XFEM.In the following,we first summarize the experiment,followed by a numerical simulation of heat transfer and fracturing.The numerical results are discussed and compared with the measurements and observations from the experiments.
2.Main outcomes of the cooling experiment
The primary objective of the cooling experiment was to verify if a temperature drop is capable of generating fractures in the walls of salt caverns.If so,the secondary objective was to quantify the characteristics of the fractures(e.g.depth and aperture)in order to assess the actual consequences for a storage facility.
2.1.Test setup
The experiment was conducted in a 120 m-deep salt mine located in a thick layer of rock salt from the Keuper lithostratigraphic unit.A full description of the experiment can be found in Hévin et al.(2016).
In the main gallery(Fig.1),a niche was purposely excavated to house the experiment.The dimensions of the niche are 17.5 m in length,12 m in width,and 4.5 m in height.The salt block used for the cooling experiment was left unexcavated and has a thickness of 1.5 m(Fig.1b).A section of the niche floor(dimensions of 3.6 m×3.6 m)was isolated by a chamber(Figs.1 and 2a),in which the temperature could be regulated by a refrigeration system and fans.
In order to release the initial horizontal stresses in the salt block,two parallel slots were dug close to the niche wall(Fig.1a).Before starting the cooling test,these two slots(1.5 m in depth)were back filled with salt powder that has a porosity of about 30%.
2.2.Testing procedure
During the experiment,three cooling-heating cycles were performed using the refrigeration system and the four fans installed in the cooling chamber.Each cycle consisted of a 28-d cooling stage,during which air temperature inside the cooling chamber was decreased from 14.5°C(initial temperature in the gallery)to around-9°C,followed by a 28-d heating phase.A fourth cooling phase,which also lasted for 28 d,followed the first 3 cycles,and the air temperature decreased to-25°C.The time evolution of the air temperature inside the cooling chamber during the first cooling phase is shown in Fig.2b.The temperature decreased to-9°C within 1 h after starting the experiment.The peaks in temperature observed on days 6,7 and 15 were due to unexpected opening of the cooling chamber’s doors and power supply failures.
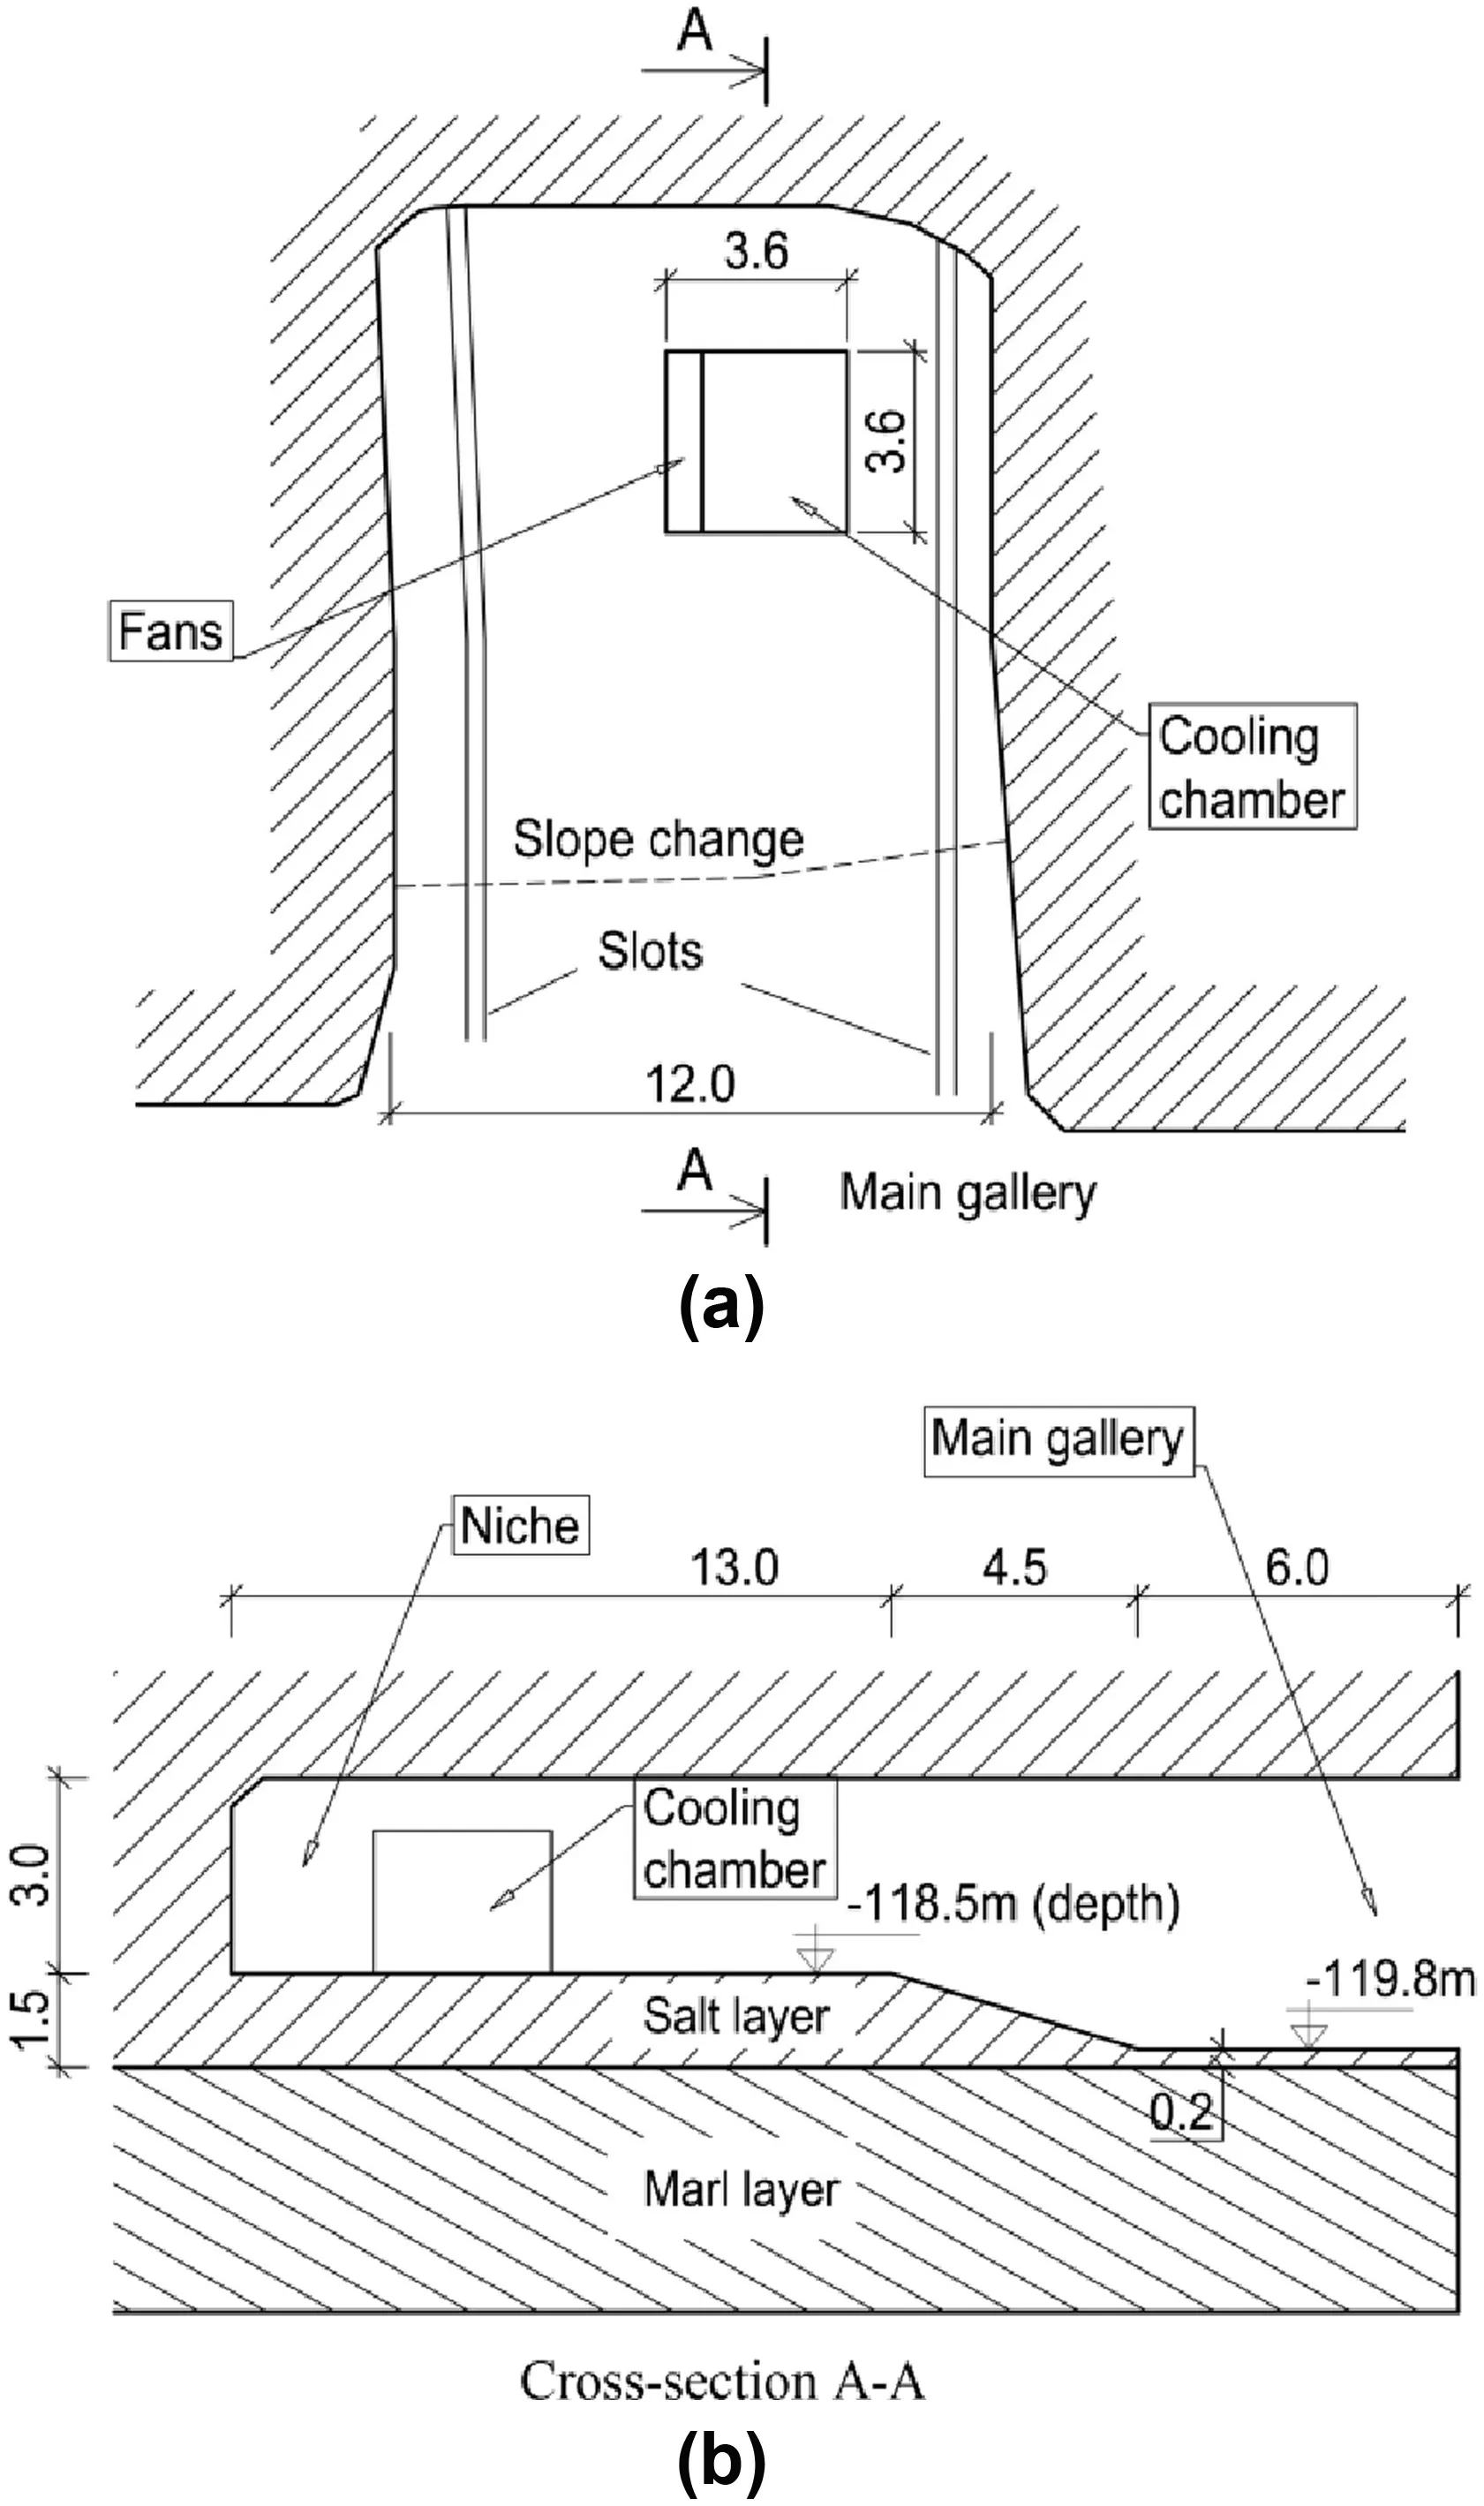
Fig.1.Geometry of the gallery and position of the cooling chamber(adapted from Hévin et al.,2016).(a)Top view;and(b)Cross-section A-A.Dimensions are given in m.
To minimize heat losses by convection,the floor around the cooling chamber was covered with an insulating material.A view of the cooling chamber including the layout of the insulation is shown in Fig.2a.
2.3.Temperature monitoring
Extensive monitoring was carried out during the test.Thermocouples were installed to monitor the temperature on the floor both inside and outside the chamber,and at different depths inside the chamber.Additionally,optical and infrared images were shot at different times to follow the initiation of cracks and their propagation.Fig.3 shows the layout of thermocouples and a view from inside the cooling chamber.The main thermocouples of interest include the ones on the floor,designated by K and S,located along the lines X=2.3 m(referred to as the main profile)and Y=1.4 m(the transverse profile);and the ones at depths of 0.2 m,0.4 m and 0.8 m from the floor’s surface,respectively designated T3,T4 and T5.
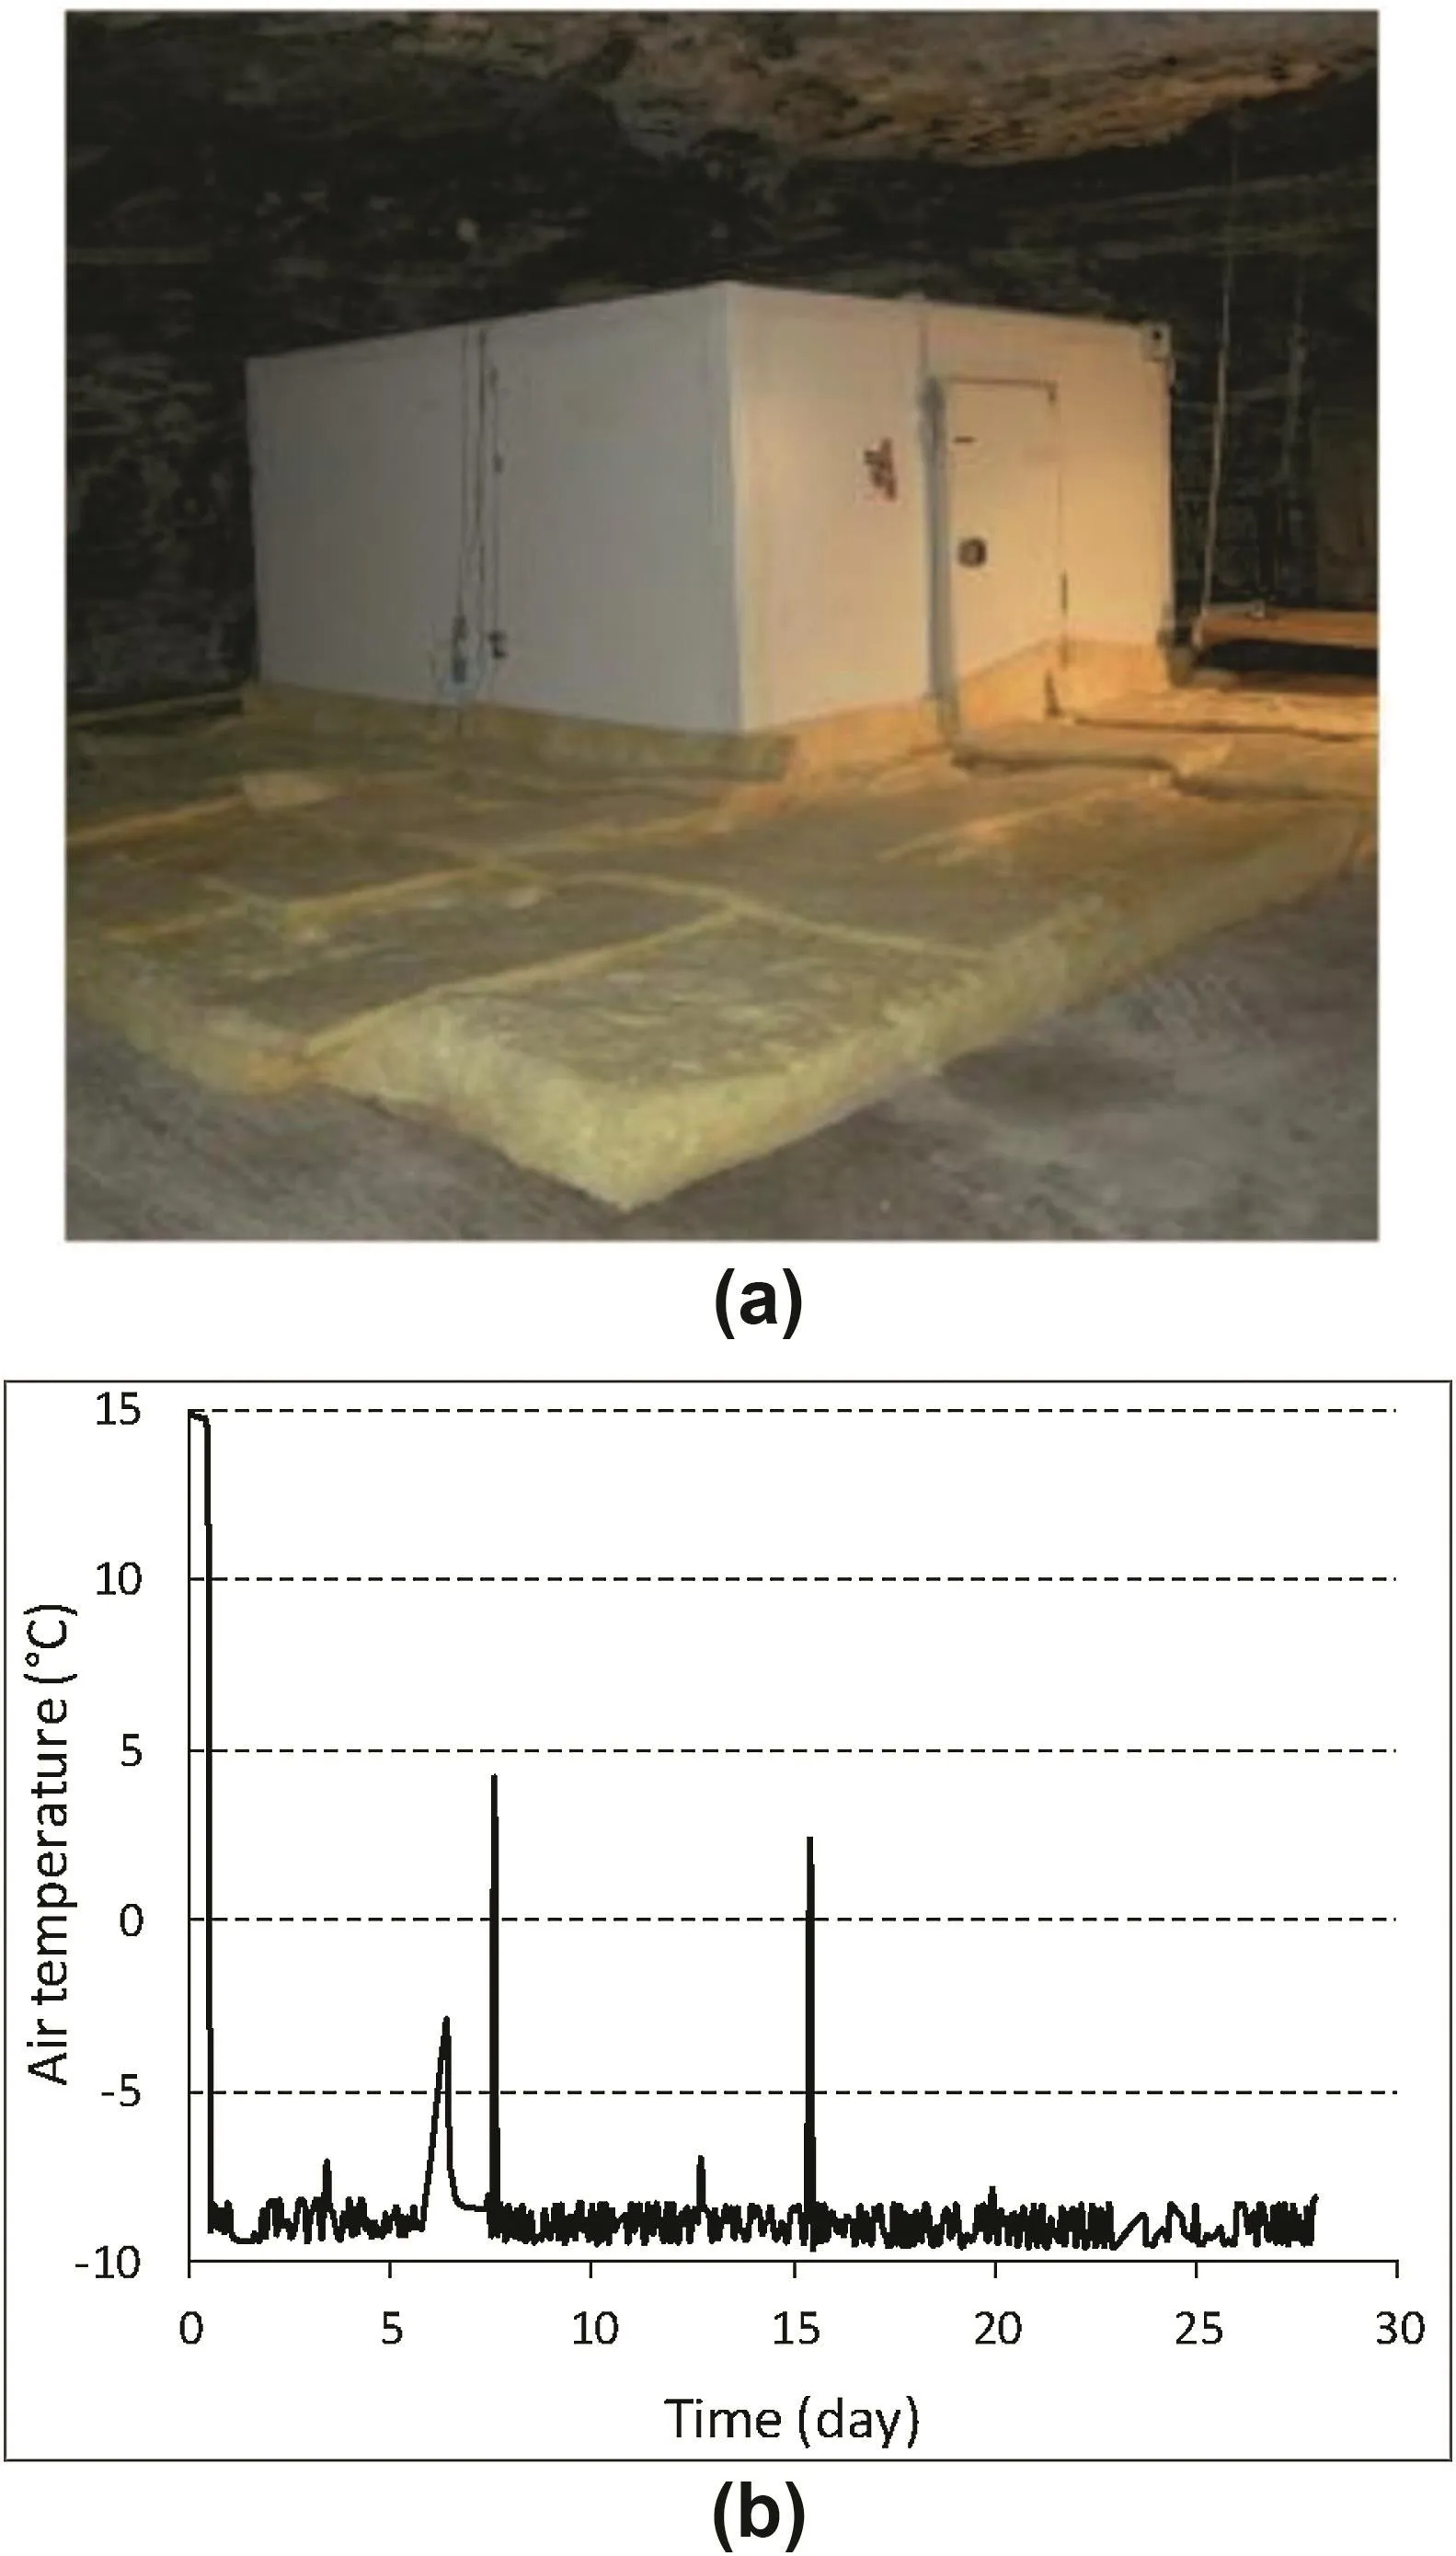
Fig.2.Cooling experiment.(a)View of the cooling chamber(Hévin et al.,2016);and(b)Time evolution of air temperature inside the chamber during the first cooling stage.
3.Thermo-mechanical numerical modeling
3.1.Governing equations
The modeling of the experiment under consideration requires thermo-mechanical(TM)coupling between the heat transfer and the mechanical response,which incorporates appropriate criteria for fracture initiation and propagation.The TM coupling considered is of the Duhamel-Neumann type,which is a weak TM coupling(Selvadurai and Suvorov,2016).The governing equations for the TM coupling are the heat equation and force equilibrium equations:

whereρis the density of the rock salt,Cpis the heat capacity,T is the temperature,is the heat flux,is the Cauchy stress tensor,is the gravitational acceleration,an∇·(·)is the divergence operator.
The symmetry of the Cauchy stress tensor ensures the equilibrium of momentum.Eqs.(1)and(2)need to be supplemented with the boundary conditions,the initial conditions and the constitutive laws for both heat transfer and mechanical behavior.

where λis the thermal conductivity,and ∇(·)is the gradient operator.
Regarding the mechanical behavior,isotropic linear elastic material behavior is assumed.This assumption might seem simplistic since rock salt is known to be prone to creep;however,the duration of the experiment was not long with regard to the fracturing process and the creep effects can be neglected.Under this condition,the total strain is the sum of stress-induced elastic strain and thermal strain:
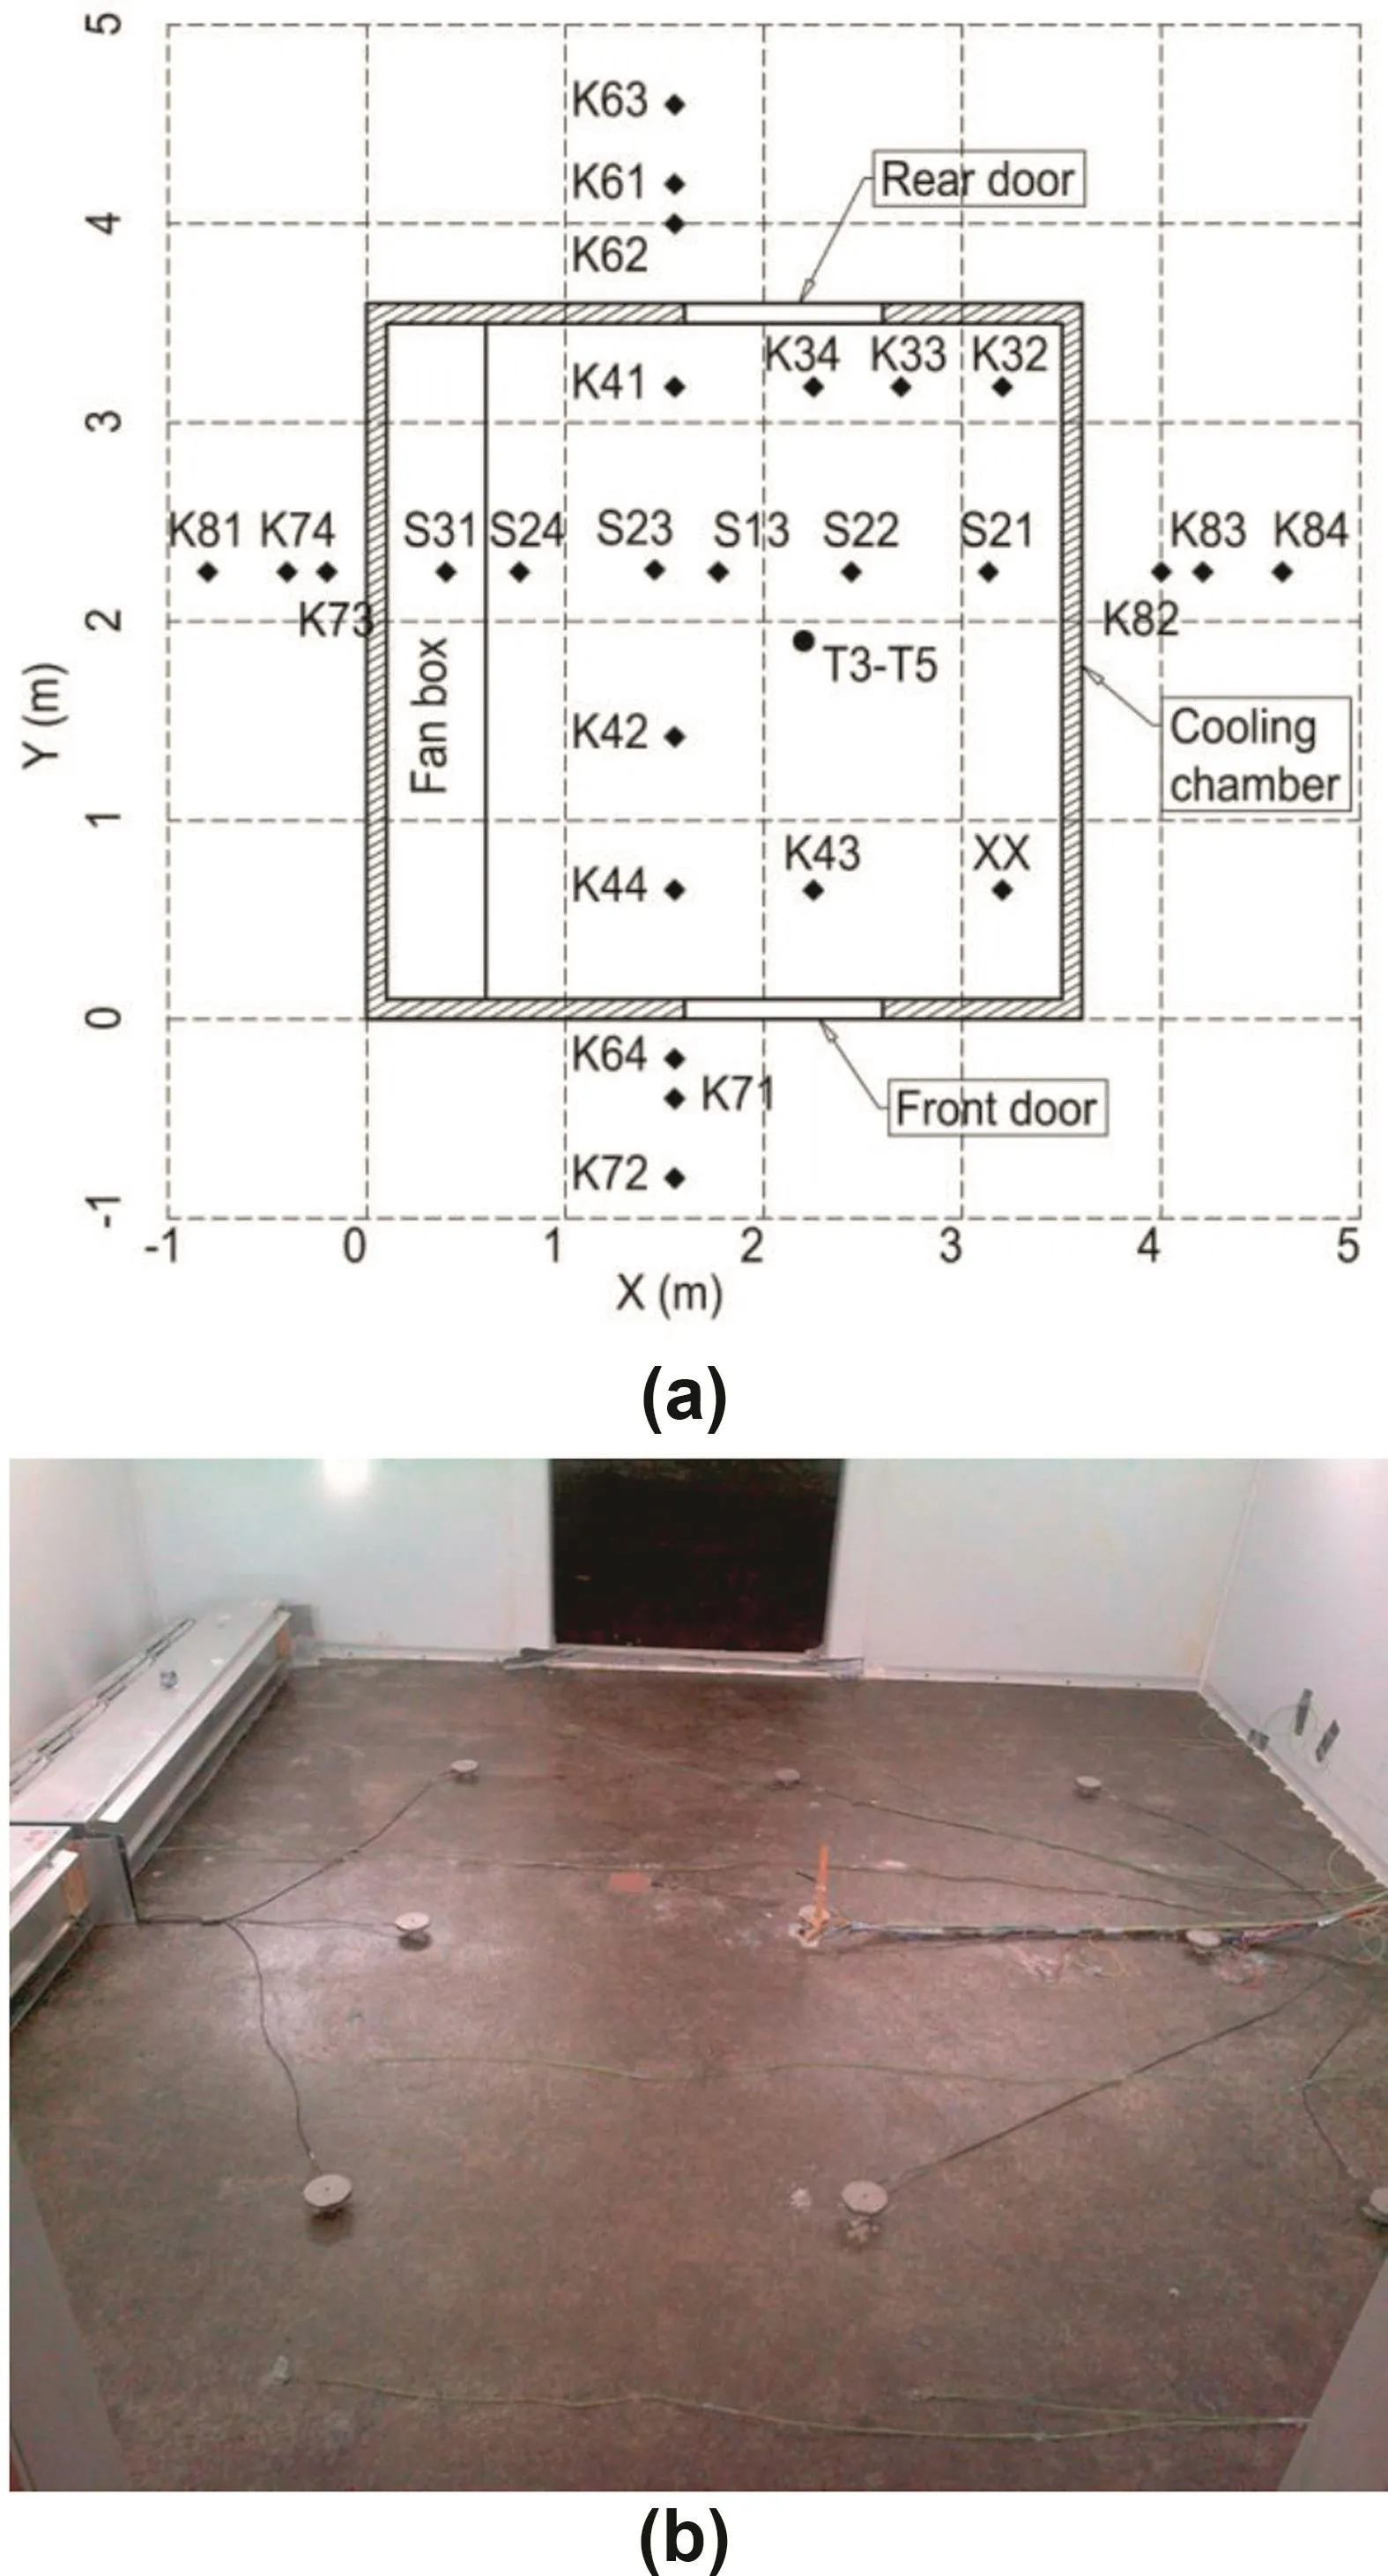
Fig.3.Layout of thermocouples.(a)Locations of thermocouples:Thermocouples K and S measured temperatures on the floor,and thermocouples T3,T4 and T5 measured temperatures at depths of 0.2 m,0.4 m and 0.8 from the floor’s surface,respectively;and(b)View from inside of the chamber with sensors on the floor and fans on the left(from Hévin et al.,2016).

where νis the Poisson’s ratio,E is the Young’s modulus,σ0is the initial stress tensor,αis the linear thermal expansion coefficient,T0is the initial temperature,I is the identity second-order tensor,and tr(·)is the trace operator.
The equations for the stresses in terms of the strains are found by inverting Eq.(4)as follows:

where K=E/(1-2ν)is the bulk modulus.
The term-3αK(T-T0)I in Eq.(5)is referred to as the thermal stress,which is often used as an estimate for stress due to temperature changes.However,thermal stress must be the result of both temperature changes and boundary constraint.
Fracture modeling is based on the theory of fracture mechanics.Since most rocks behave in a brittle manner under tensile stresses,tensile fractures are commonplace(Bieniawski,1967;Scholz,1968).The short-term behavior of rock salt is therefore mainly elasticbrittle(Bérest and Brouard,2003).Thus,a fracture is assumed to initiate when the tensile stress exceeds the tensile strength RT:

Once the fracture is initiated,its propagation is governed based on the fracture energy release rate.A mode I fracture will propagate when

where GIis the mode I energy release rate;and GICis the fracture toughness,which is a material property.
Under mixed-mode conditions,the equivalent fracture toughness is estimated using the BK law model(Benzeggagh and Kenane,1996):

where GIICandηare the material parameters to be determined experimentally,and Gequiv=GI+GII+GIIIis the mixed-mode fracture energy release rate.
3.2.Numerical method for fracture modeling
The XFEM was chosen to model fracture initiation and propagation.It was proposed by Belytschko and Black(1999)and Moës et al.(1999)to simulate crack growth without remeshing.The key idea in the formulation of this method is that the displacement field incorporates the discontinuity as an additional term in the displacement approximation.The conventional XFEM displacement approximation is given by

where NI(X)is the conventional shape function,uIis the nodal displacement variable,H(X)is the discontinuous jump function(Heaviside function),aIis the nodal enriched variable accounting for displacement discontinuity across the crack surfaces,bαIis the crack tip enriched variable,and Fα(X)is the asymptotic crack tip function defined as follows:
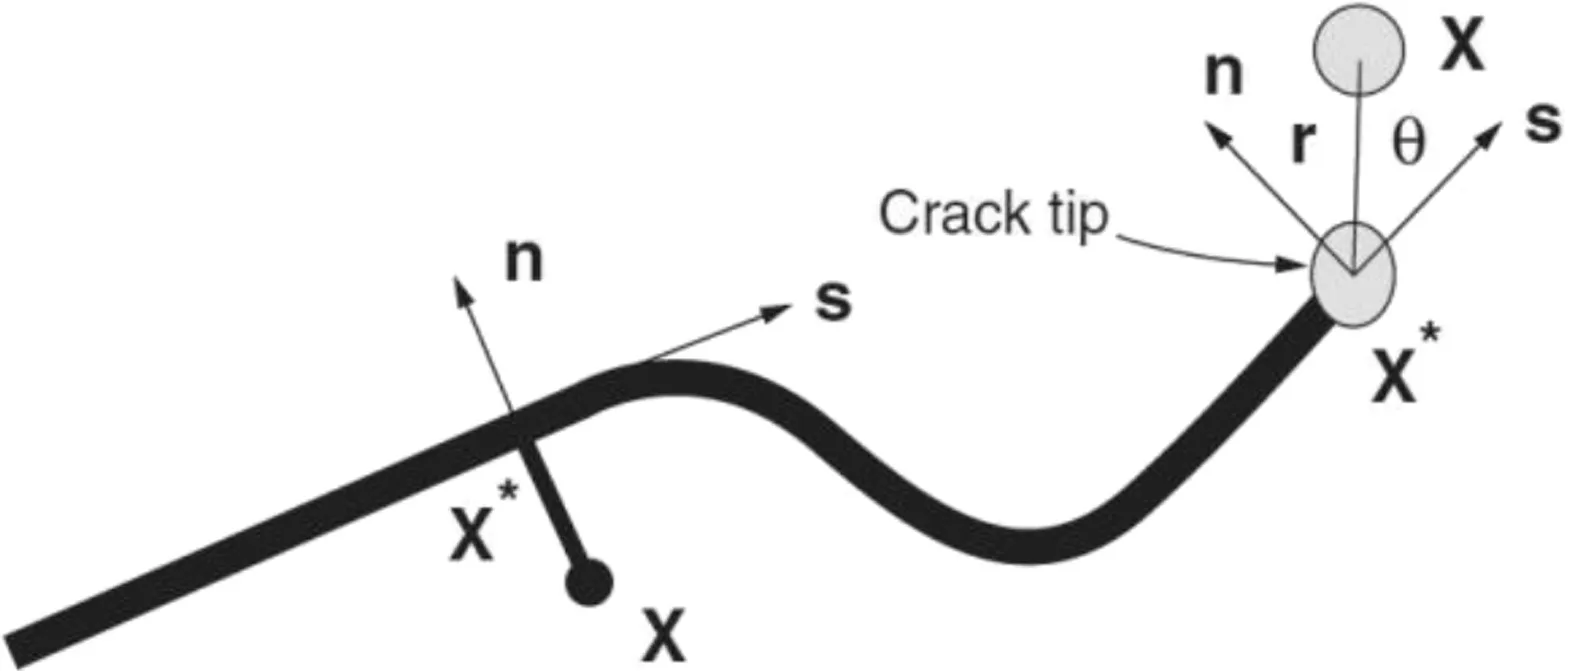
Fig.4.Illustration of normal and tangential coordinates for a smooth crack(Abaqus,2016).

Fig.4 illustrates the discontinuous jump function across the crack surfaces,which is given by

Fig.5.Geometric sub-domain used for heat transfer and fracture propagation simulations(dimensions are indicated in m).(a)Three-dimensional(3D)view;and(b)Top view.
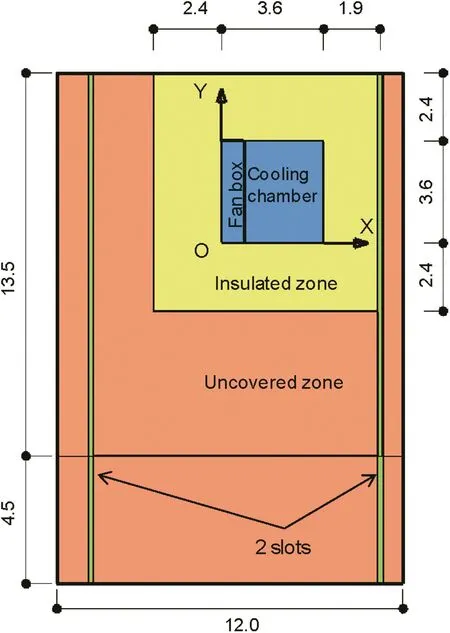
Fig.6.Convection zones for heat transfer simulation with different values of the heat transfer coefficient(measured in W/(m2°C))as follows:h=2 W/(m2°C)for the 2 slots,h=20 W/(m2°C)for the floor under the fan box,h=3.2X2-1.6X+19 for the floor inside the cooling chamber,h=0.2 W/(m2°C)for the insulated zone,and h=10 W/(m2°C)for the uncovered zone.Dimensions are indicated in m.

where X is a Gauss point,X*is the point on the crack closest to X,and n is the unit vector.
Compared to the classical FEM,XFEM possesses several advantages:(i)the crack path is arbitrary and independent of the mesh;and(ii)the stress singularity near the crack tip is captured through enrichment terms without the need for mesh refinement(Fries and Belytschko,2010).
4.Numerical simulations of rock fracturing during the cooling experiment
4.1.Introduction
The numerical modeling of the experiment under consideration consists of two sequential simulations:the heat transfer simulation followed by the fracture propagation simulation.The modeling was performed for the first cooling stage since the fracturing process due to temperature changes(both fracture initiation and propagation)occurred mainly during this stage of the experiment.

Table 1Physical and thermal properties of the rock salt and marl.
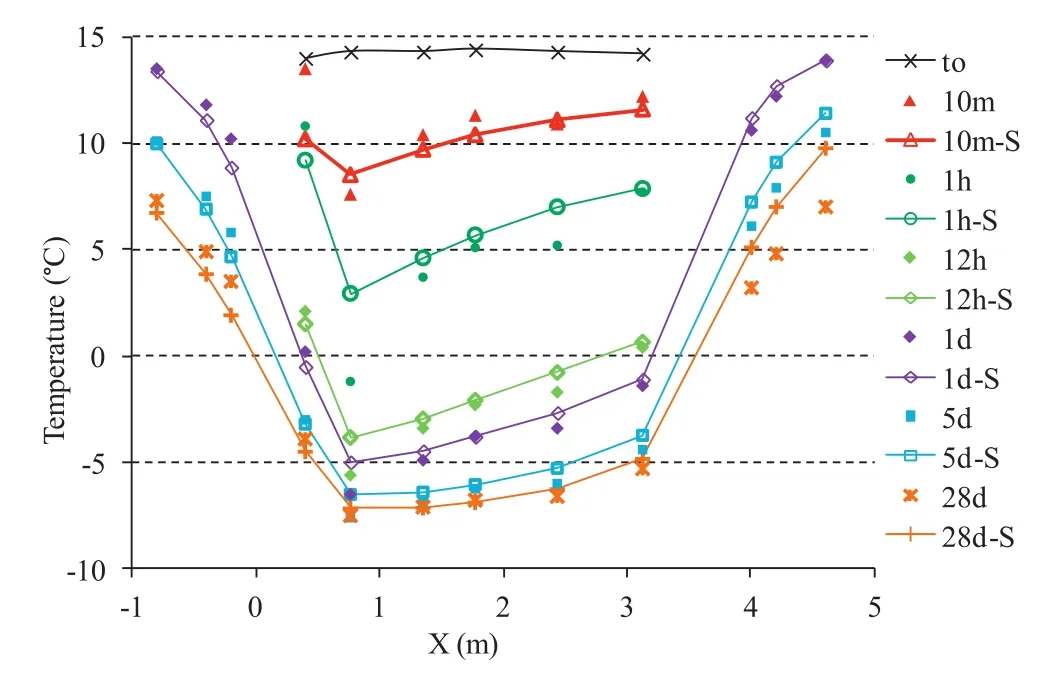
Fig.7.Temperatures along the main profile at different times:Simulations vs.measurement.Legends followed by an “S”represent computed results while those without“S”represent the measurements.The cooling chamber is located in 0≤ X ≤ 3.6 m.
The temperatures measured at different locations were used to calibrate the heat transfer model.The temperature field obtained from the heat transfer model was then introduced into the mechanical model for simulating the fracture initiation and propagation.Both the heat transfer and mechanical simulations used the same geometric domain and were performed using the finite element code Abaqus(2016).Instead of modeling the whole formation from the ground surface to the depth of the gallery,a subdomain was chosen,as displayed in Fig.5.The sub-domain consists of the tested 1.5 m-thick salt block and a 5 m-thick layer of marl.These dimensions were chosen to satisfy the boundary conditions used for the heat transfer simulation and will be justified later.
4.2.Heat transfer simulation
4.2.1.Initial and boundary conditions
Two types of heat transfer took place in the experiment,namely conduction inside the rock mass and convection at the air-rock mass interface.The basic relationship for the heat transfer by convection is

where h is the heat transfer coefficient;and Tais the sink temperature,which,in this case,is the air temperature.
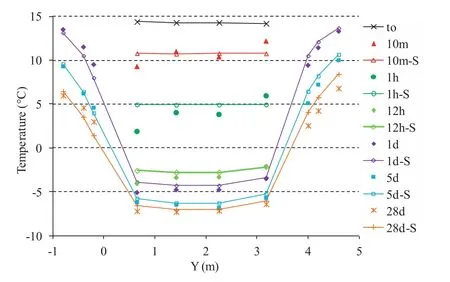
Fig.8.Temperatures along the transverse profile at different times:Simulation vs.measurements.The cooling chamber is located in 0≤Y≤3.6 m.
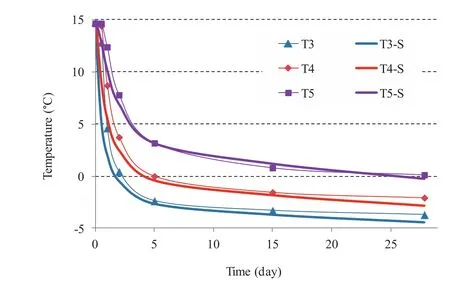
Fig.9.Time evolution of the temperature at depths of 0.2 m,0.4 m and 0.8 m measured by thermocouples T3,T4 and T5,respectively.
The different convection zones are represented in Fig.6.They are characterized by different values of h(measured in W/(m2°C))as follows(Hévin et al.,2016):h=2 W/(m2°C)for the 2 slots,h=20 W/(m2°C)for the floor under the fan box,h=3.2X2-1.6X+19 for the floor inside the cooling chamber,h=0.2 W/(m2°C)for the insulated zone,and h=10 W/(m2°C)for the uncovered zone.These values of h were determined by calibrating the temperature at the monitoring points on the floor and at different depths of the testing block.Other physical and thermal properties required for the simulation are given in Table 1.
For the simulation,the initial temperature in the whole domain was considered to be 14.5°C.The temperature was held constant at 14.5°C at all boundary planes:X=-5:7 m,X=6:3 m,Y=6 m,Y=-11:5 m,and Z=-6:5 m.
4.2.2.Numerical results of heat transfer simulation
In this section,the computed temperatures are compared with the experimental measurements.Temperatures along the main profile(along X-axis)and along the transverse profile(along Y-axis)are shown in Figs.7 and 8,respectively.The legends followed by an“S”represent the simulation results while those without“S”are the experimental measurements.As can be seen,the simulation results agree reasonably well with the test measurements.The temperatures inside the cooling chamber decreased quickly during the first few hours.Along the main profile,the average temperature decreased by about 4°C after 10 min and approximately 9°C after 1 h.Temperatures tended to stabilize after 5 d.Some discrepancies were observed in the first few minutes after the beginning of the cooling.This can be explained by the phase changes of fluid in the pore space that was not accounted for in the current numerical model.However,after 1 h,the temperature difference between the simulations and test measurements was less than 1°C,except for the thermocouple below the fan box.In fact,the convection condition under the fan box is difficult to be controlled and a constant value of the heat transfer coefficient may not be sufficient to describe the real convective conditions.
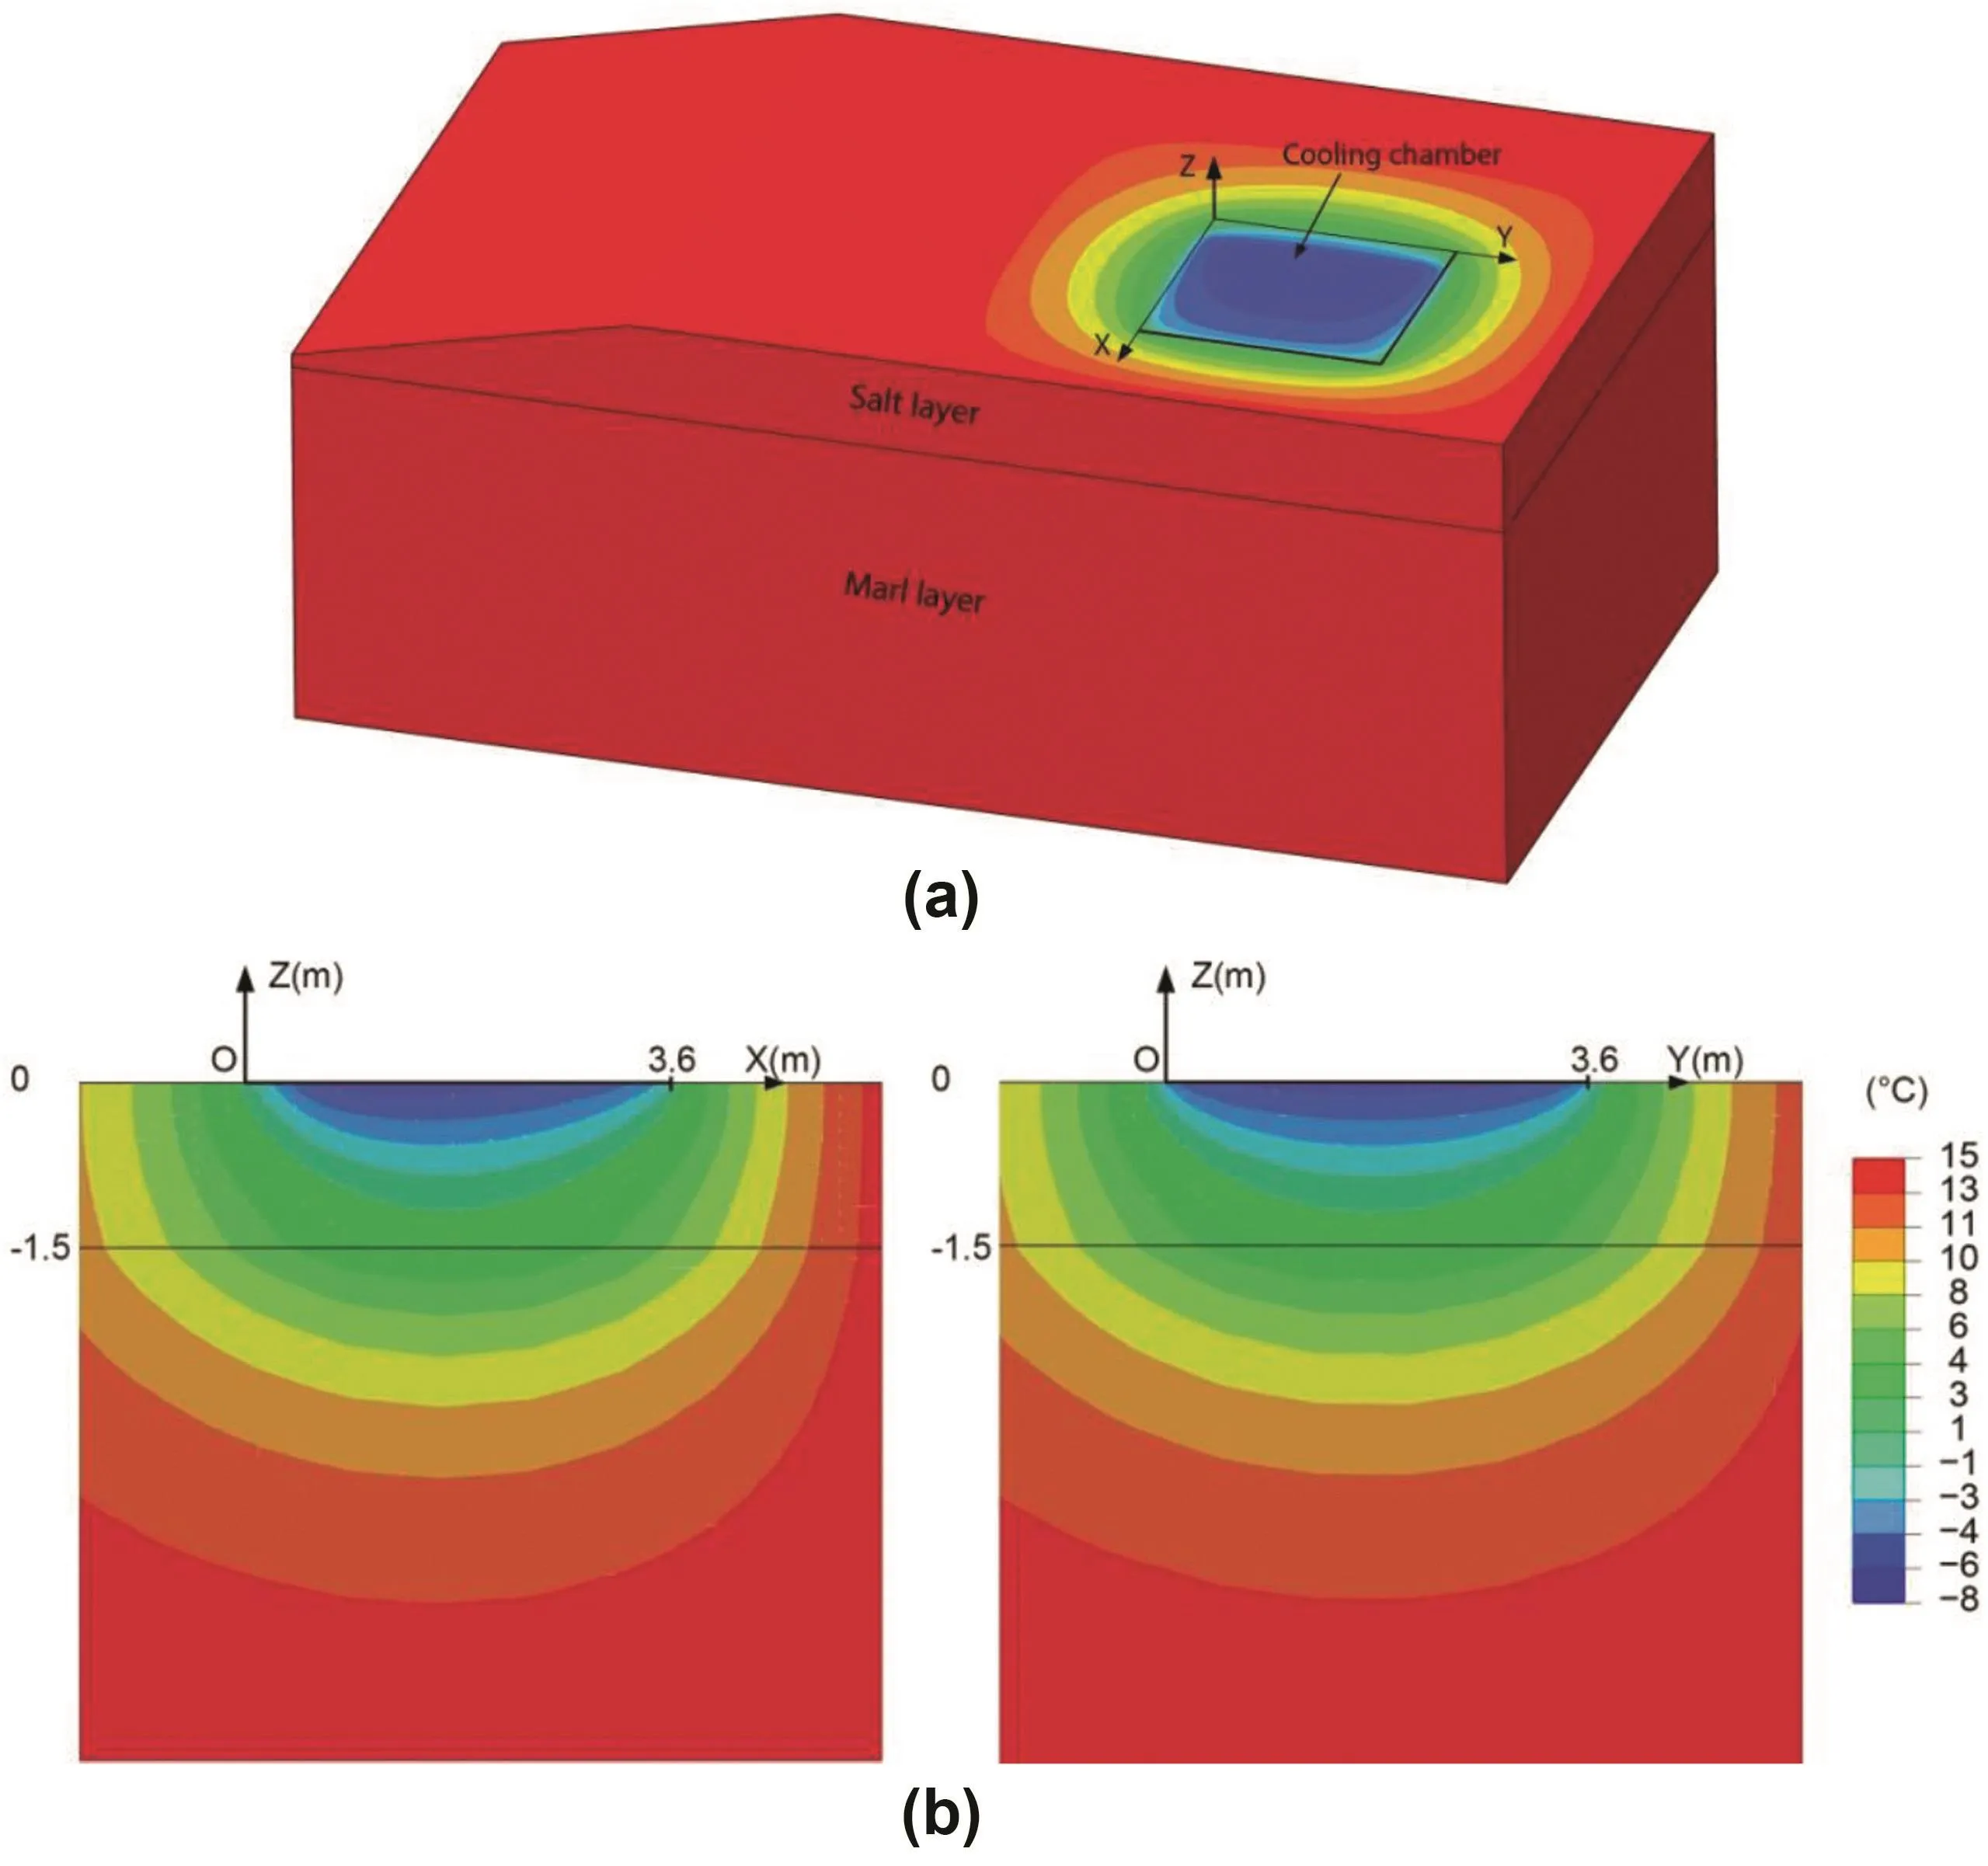
Fig.10.Temperature distribution at the end of the first cooling stage.(a)3D view;and(b)Cross-sections along the main profile(left)and along the transverse profile(right).
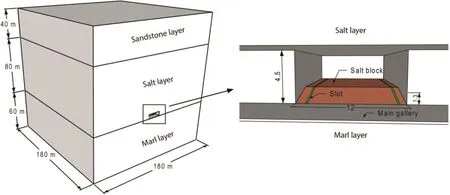
Fig.11.Geometric domain used for reproduction of the initial stress state(all dimensions are in m).
Time evolution of the temperature is also compared,for different depths,with the experimental values measured by thermocouples T3,T4 and T5,as displayed in Fig.9.Similar agreement between numerical results and test measurements was obtained.
A 3D view of the spatial distribution of the temperature at the end of the first cooling stage(day 28)is shown in Fig.10.Note that the cold fronts(surfaces with low temperatures)did not reach the boundaries of the model.This justified the dimensions chosen for the model and the constant temperature boundary condition used.Therefore,the computed temperature field is considered to be close to the real temperature observed in the rock mass and will be introduced into the mechanical model.
4.3.Simulation of a thermally-induced fracture
4.3.1.Initial stress initialization
As explained above,the mechanical simulation of the fracture propagation was performed using the same sub-domain as in the heat transfer simulation.However,the initial stress state was first reproduced using a full model with dimensions of 180 m×180 m×180 m(Fig.11),which consisted of three layers,i.e.from top to bottom,a 40 m-thick sandstone layer,an 80 m-thick rock salt layer,and a 60 m-thick marl layer.All lateral faces and the bottom face of the domain are constrained.The simulation was performed in 3 steps.In the first step,the geostatic stress is applied.The geostatic stress is the lithostatic stress and is supposed to be isotropic.The second step simulates the excavation of the main gallery and the niche.In the third step,the two slots are excavated.The densities of the salt and marl are presented in Table 1.The density of the upper layer of sandstone is 2500 kg/m3.The thermo-mechanical properties of all 3 rocks are listed in Table 2.The stresses computed in the domain of interest will be extracted and used as initial stresses in the sub-model for fracture propagation using the submodeling technique in Abaqus(2016).
The stress distributions(σXXand σYY)on the floor of the cooling chamber at different times are shown in Fig.12.Note that the excavation of the niche has the same effect on both σXXand σYYas they both decrease from-2.85 MPa to about-2 MPa(note that compressions are negative).Conversely,the excavation of the 2 slots modifiesσXXandσYYdifferently.As can be seen in Fig.12c,the stress σXXwas more relaxed than σYY,decreasing from-2 MPa before excavation of the slots to about-1.4 MPa afterwards.This is due to the directions of the slots,which are normal to the X-axis.
4.3.2.Fracture propagation modeling
For fracture propagation modeling,a sub-model is used(Fig.5).All the lateral faces and the bottom face are displacement constrained.This boundary condition is justified because its effects on the salt block,which is the region of interest,are limited due to the presence of the two slots.Indeed,the two parallel slots isolated the salt block from lateral contact with the walls of the niche.The initial stress state used in the current simulation was taken from the initial stress state initialization model in Section 4.3.1,for the corresponding geometric domain.The mechanical properties of the salt required for the fracture propagation modeling are typical of those found in the literature.A tensile strength for the salt of 2.75MPa,and fracture toughness GIC=GIIC=22 J/m2were used(Silberschmidt and Silberschmidt,2000;Wang et al.,2016).
Fig.13 shows the stresses in directions X and Y(σXXon the left,andσYYin the middle)and the temperature(on the right)on the floor of the cooling chamber at different times during the first cooling stage.Note that the stressσXXinside the chamber,which is compressive prior to the cooling,changed to tension 1 h after the start of cooling.It was also greater thanσYYand increased upon further cooling.At about 4.5 h,whenσXXexceeded the tensile strength of the rock salt,two cracks were initiated in two locations at a distance of about 1.1 m from the fan box(i.e.Xcrack=1.6 m),as shown in Fig.13c.The locations of the two cracks were right in front of the fans where the temperature was the most reduced.The cracks then propagated rapidly and coalesced into one crack across the chamber after 5 h,as shown in Fig.13d.The location and the time at which the first crack appeared were consistent with the observations made on site.Indeed,Hévin et al.(2016)reported that the macro-crack was visible after about 6 h of cooling at Xcrack=1.5 m.

Table 2Thermo-mechanical properties of the rock salt,marl and sandstone.
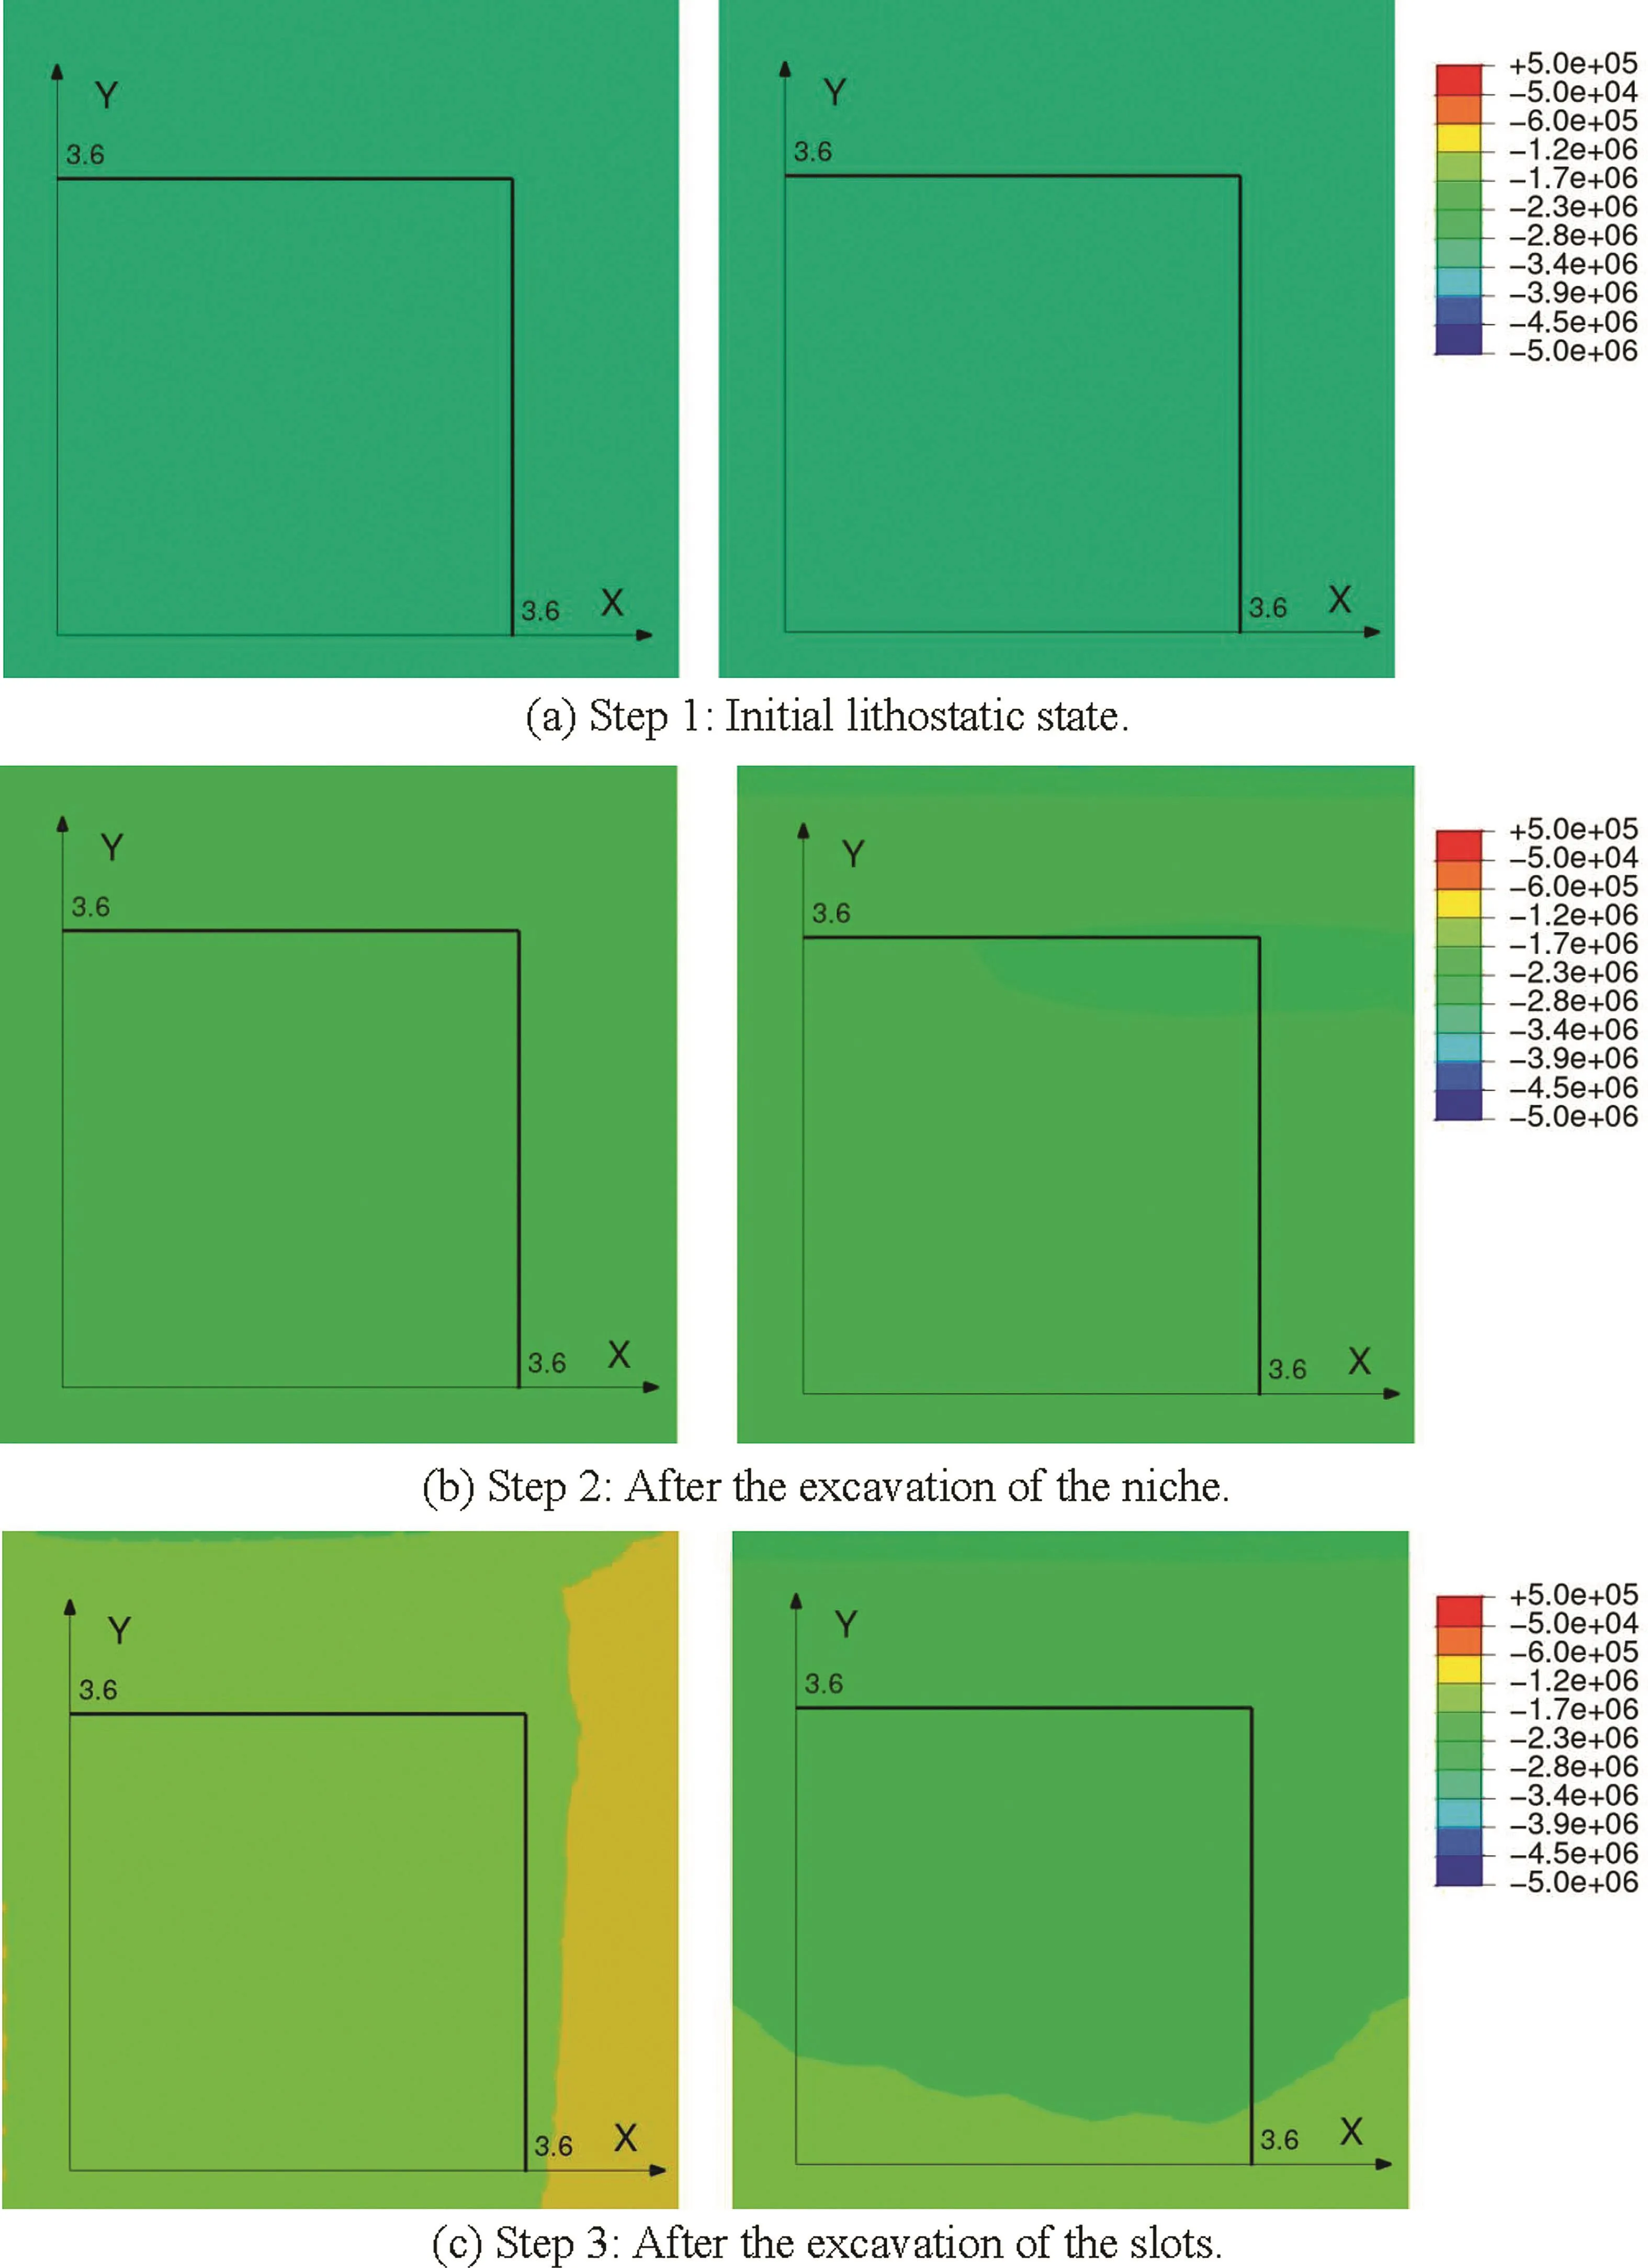
Fig.12.Stresses(σXXon the left and σYYon the right)on the floor of the cooling chamber at different steps(unit:Pa).
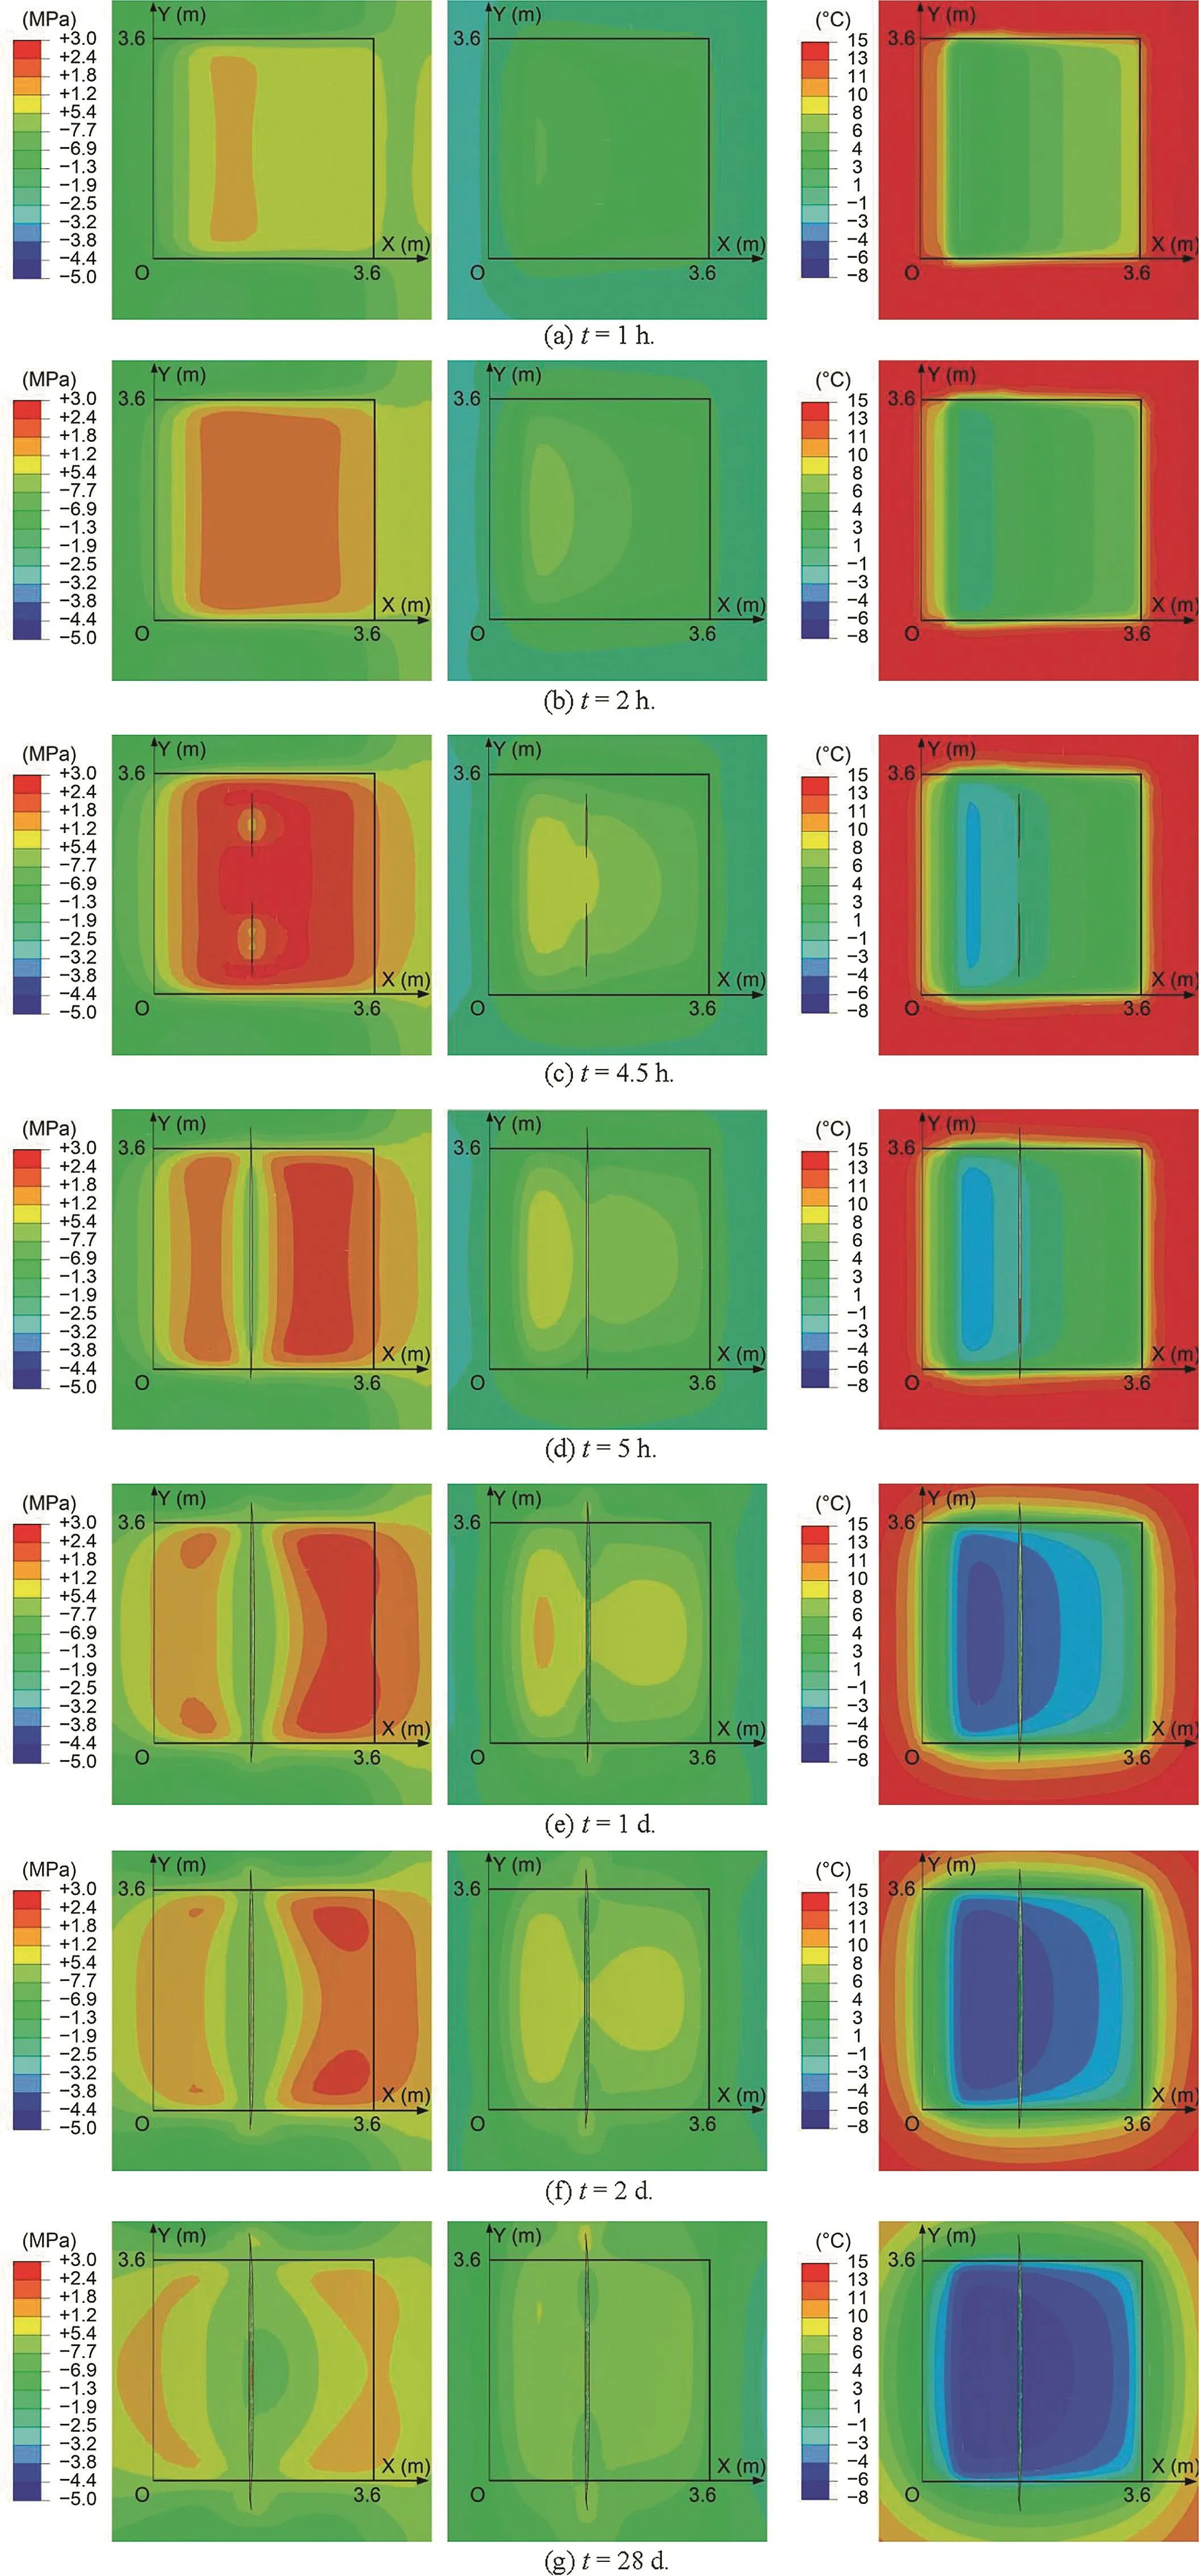
Fig.13.Numerical results(σXXon the left,σYYin the middle,and the temperature on the right)on the floor of the cooling chamber at different times during the cooling stage.
Stress relaxation was also noticed around the cracks at 5 h.After 5 h,the macro-crack on the floor did not propagate further.The region of maximum tensile stress was shifted farther from the fan box,as can be seen in Fig.13d-g.At the end of the first cooling stage,the temperature distribution became more homogeneous and steady.This caused a decrease in the amplitudes of bothσXXandσYYat the end of the first cooling stage.For instance,the maximumσXX,which was about 2.4 MPa after 5 h,became close to 1 MPa at day 28.
Although the crack stopped propagating on the floor of the cooling chamber after 5 h,the temperature decreases caused the crack to propagate deeper into the salt block.Fig.14 shows the crack areas on the Y-Z plane at different times.The crack’s depth at 5 h was about 0.3 m.As the cooling continued,the crack gradually penetrated deeper into the rock mass;after 1 d,it was about 0.8 m deep.The downward crack penetration slowed and stabilized after 5 d.This tendency of evolution was also observed in the experiment.The maximum crack depth at day 28 was approximately 1.15 m,which was consistent with the depth observed on site,about 1.25 m.
The time evolutions of the crack depth and the crack aperture on the floor of the cooling chamber at Y=1.8 m are illustrated in Fig.15.Note that both the depth and aperture of the crack increased rapidly during the first few hours,after which the rates slowed down and stabilized after 5 d.The crack aperture reached a maximum of 0.65 mm after 2 d.The computed crack aperture was of the same order as that observed experimentally,which was about 1 mm(Hévin et al.,2016).The crack aperture then slightly decreased after 5 d;this crack evolution was consistent with that observed experimentally.This is because the temperature distribution became more homogeneous after 5 d,causing the stresses(including σXX)to relax and decrease the aperture.
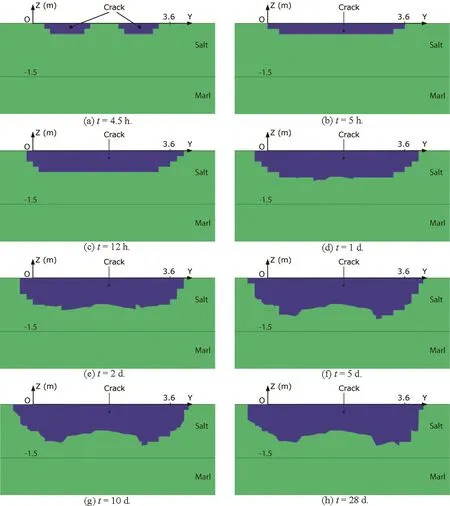
Fig.14.Crack areas on the Y-Z plane at different times during the cooling stage.The crack areas are shaded in blue.
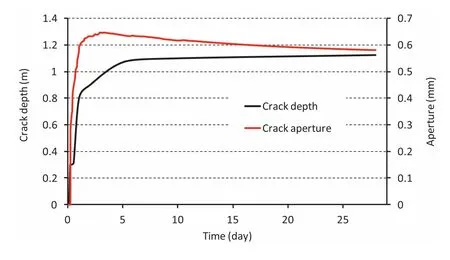
Fig.15.Time evolution of maximum crack depth and crack aperture at Y=1.8 m.
5.Conclusions
Numerical simulation of a large-scale experiment showed how fractures develop in rock salt due to rapid cooling.Despite some uncertainties on the TM material properties(thermal expansion coefficient,and elasticity modulus)and on the initial geostatic state of stress,the simulation has satisfactorily reproduced the primary experimental measurements and observations.The latter include the fracture’s location,orientation and geometry,as well as timing of the fracture onset.The numerical simulation also explains the time evolution of the fracture geometry.The depth of the fractures,which is about 1.25 m,might not be considered detrimental to the tightness of the storage cavern,but it still can cause instability to the cavern in the event where fractures coalesce and isolate a block of rock on the roof the cavern.In this case,tensile stresses caused by the dead-weight of the block could induce failure of the rock.Moreover,thermal fractures allow the stored gases at high pressure to penetrate into and cause stress concentration around the fracture tips,potentially pushing the thermal fractures to propagate further.
Compared to classical continuum approaches(such as elastoplasticity,and damage mechanics),fracture mechanics describes the actual behavior of brittle rocks under tensile stresses-the initiation of discontinuities(fractures)and their propagation.XFEM allows a representation of the fracture geometry independent of the finite element mesh while still being able to capture the stress and strain singularities around the fracture tips.This approach could be useful in the computation of many other geo-structures where fracturing is the predominant mode of failure.Therefore,such a numerical approach might be used to improve the design of rock salt caverns in order to guarantee their integrity in terms of both tightness and stability.
Conflicts of interest
The authors wish to confirm that there are no known conflicts of interest associated with this publication and there has been no significant financial support for this work that could have influenced its outcome.
 Journal of Rock Mechanics and Geotechnical Engineering2018年5期
- Journal of Rock Mechanics and Geotechnical Engineering的其它文章
- Pullout behavior of polymeric strip in compacted dry granular soil under cyclic tensile load conditions
- A comparative study between gravel and rubber drainage columns for mitigation of liquefaction hazards
- Bearing behavior and failure mechanism of squeezed branch piles
- Experimental evaluation of mechanically stabilized earth walls with recycled crumb rubbers
- Dynamic properties and liquefaction behaviour of cohesive soil in northeast India under staged cyclic loading
- Saturated anisotropic hydraulic conductivity of a compacted lateritic soil
