A Fast-Fractional Flow Reserve Simulation Method in A Patient with Coronary Stenosis Based on Resistance Boundary Conditions
Wenxin Wang, Dalin Tang, Boyan Mao, Bao Li, Xi Zhao, Jian Liu and Youjun Liu,
Abstract: Fractional flow reserve (FFR) is the gold standard to identify individual stenosis causing myocardial ischemia in catheter laboratory. The purpose of this study is to present a fast simulation method to estimate FFR value of a coronary artery, which can evaluate the performance of vascular stenosis, based on resistance boundary conditions.A patient-specific 3-dimensional (3D) model of the left coronary system with intermediate diameter stenosis was reconstructed based on the CTA images. The resistance boundary conditions used to simulate the coronary microcirculation were computed based on anatomical reconstruction of coronary 3D model. This study was performed by coupling the 3D coronary tree model with the lumped parameter model (0D model). The flow rate and pressure of coronary tree were calculated in twenty minutes. In addition, the effect of inlet pressure and myocardial mass on FFRss values has been investigated. The results showed that the effect of myocardial mass was greater than the effect of inlet pressure on FFRss. This FFRss simulation method can quickly and accurately assess the influence of coronary stenosis in aid clinical diagnosis.
Keywords: Computational fluid dynamics, fractional flow reserve, resistance boundary condition.
1 Introduction
Invasive fractional flow reserve (FFR) is the gold standard for determining whether a coronary artery stenosis causes ischemia [De Bruyne, Pijls, Kalesan et al. (2012); Pijls and Sels (2012); Lee, Jung, Hwang et al. (2016); Ma, Liu, Hou et al. (2017); Yong,Javadzadegan, Fearon et al. (2017)]. FFR can only be measured using invasive coronary artery catheterization, which limits its widespread use in clinical practice. The data have shown that the application rate of FFR in clinical is less than 6% in America [Fischer,Samady, McPhweaon et al. (2002)]. Syntax Score is usually used as a combination of several validated angiographic classifications aiming to grade the patients’ coronary arteries with their location, lesion severity and complexity [Capodanno, Capranzano, Di Salvo et al. (2009)]. However, there are more and more studies that showed the severity and location of coronary stenosis have no absolute correlation with myocardial ischemia.To date, with the development of imaging technology, invasive and non-invasive imaging methods, such as computed tomography angiography (CTA), optical coherence tomography (OCT), quantity coronary angiography (QCA) and intravascular ultrasound(IVUS), have been widely used in numerical simulation [Kim, Vignon-Clementel,Coogan et al. (2010); Sen, Asrress, Petraco et al. (2012); Sen, Escaned, Malik et al.(2012); Lee, Jung, Hwang et al. (2016); Lee, Lee, Shin et al. (2017); Seike, Uetani,Nishimura et al. (2017); Seike, Uetani, Nishimura et al. (2018)]. Based computational fluid dynamics modeling, FFR derived CTA (FFRct) is a noninvasive functional index for coronary artery disease [Taylor, Fonte, Min et al. (2013)]. The non-invasive multiscale predictive model of FFRct has cost several hours in some recent studies [Taylor,Fonte, Min et al. (2013); Renker, Schoepf, Wang et al. (2014); Wang, Mao, Wang et al.(2016); Zhao, Liu, Li et al. (2016).].
To implement and improve the numerical simulation, it is key that how to use the different personal patient data. However, due to the deep location of coronary arteries, it is hard to gain the coronary flow rate by Doppler ultrasound. FFR clinical measurement is invasive and very expensive. In this case, it is an effective solution to use the resistance model as the outlet boundary conditions. It is unreasonable in some studies that setting four to five times of the flow rate at rest state as the outlet boundary conditions at hyperemia. Because when the coronary resistance is reduced, it is different that the reduction of outlet pressure in different patients.
The aim of this study is to develop a fast simulation method based steady-state calculation method, which could compute the flow rate and pressure of patient-specific coronary artery and predict FFR value (FFRss) at hyperemia condition from CTA images.The 0D/3D-coupled method was used to perform a numerical simulation by coupling the lumped parameter model and 3D vascular sub-models.
2 Methods
2.1 Study design
In the previous study, we used coupled 0D/3D geometrical multi-scale model with the physiological measurement data based transient calculation [Wang, Mao, Li et al. (2018);Wang, Mao, Li et al. (2016); Zhao, Liu, Li et al. (2016)]. In this present study, we used 0D/3D geometrical multi-scale model as the flow resistance model and the steady state computational method.
The main purpose of this study was to propose a numerical simulation method that could fast calculate coronary FFRss value derived from coronary CTA image and could noninvasively predict myocardial ischemia. This study was approved by the research ethics committee of Beijing University of Technology and Peking University People’s Hospital.The patient’s records or information have been anonymized prior to analysis.
2.2 CTA images and FFR measurements acquisition
In this study, the CTA images and FFR measurements of the patient were provided by the department of cardiology of Peking University People’s Hospital in China. The patient was suffering from stable angina. Based CTA image, the myocardial mass of the patient is 126.01 g, which was calculated by United Imaging Healthcare UIDeal AWS software system.
CTA image acquisition was performed on 64 detector row CT scanners. The 3D geometry of coronary arteries was reconstructed from CTA images with a slice thickness of 1 mm. The simultaneous acquisition of multi-slice enabled the images of coronary and aorta in a single breath hold. The initial data window was positioned at 50%-70% of R-R interval.
FFR measurement was preformed using Radi-Analyzer Xpress 12711 and Pressure WireTMCertusTM12006 (which are ST. Jude Medical, Inc.). Hyperemia was intravenous administration of adenosine triphosphate (ATP) at a rate of 0.14-0.18 mg/ (kg*min). FFR measurements were performed before any intervention was performed in this study. The clinical FFR value was 0.82, measured at the left anterior descending artery (LAD).
The reconstructed 3D geometry model and the location (cross-section) of clinical measured FFR were shown in Fig. 1.

Figure 1: The 3D model with the locations of FFR measurement and stenosis
2.3 Computational models
Previous studies have reconstructed total coronary arteries, including aortic and coronary arteries [Wang, Mao, Li et al. (2018); Wang, Mao, Wang et al. (2016); Zhao, Liu Li et al.(2016)]. In this paper, the left coronary system was reconstructed. The patients suffered from a moderate (60-70 percent) stenosis on left anterior descending artery (LAD). In the 3D model, it was assumed that the vessel walls were rigid. Blood flow was modeled as an incompressible viscous Newtonian fluid with a density of 1050 kg/m3and dynamic viscosity 0.0035 Pa·s. Navier-Stokes and continuity equations were solved using the commercial software solver ANSYS-CFX.
Firstly, the boundary conditions of the patient 3D coronary models were supplied by the 0D part (lumped parameter model, LPM). The inlet boundary of 3D coronary model was set as the aortic pressure (Pa), which can be similar to the rest mean arterial pressure(MAP) [Razminia, Trivedi, Molnar et al. (2004)]. Pa can be computed by the cuff-based systolic (SBP) and diastolic blood pressure (DBP) and the heart rate (HR) as shown Eq.(1) [Sharma, Itu, Zheng et al. (2012)]. The inlet pressure of this patient is 68 mmHg.

Secondly, based the patient 3D myocardial mass of left ventricle (LV), the total coronary flow rate can be calculated as shown in Eq. (2). The coronary flow was calculated assuming myocardium requires 0.8 mL/min/g of blood at rest condition [Canty (2012)].

A power law relationship between the flow rate and the vessel reference radius was established in previous study [Itu, Sharma, Suciu et al. (2016)]. The flow rate of every coronary artery branch can be calculated according to the expression in Eq. (3) and Eq.(4). Qlc is the flow rate of left coronary system, while Qrc is the flow rate of right coronary system. Dlmc and Drmc is the diameter of left and right main coronary artery separately. Qm is the total flow rate of m grade, while Qmn is the flow rate of n branch in m grade, and n is the number of branches in the m grade.

Next, coronary resistance at the rest and hyperemia state can be calculated according to the expression in Eqs. (5) and (6). According to calculation, the pressure drops were little in the normal coronary arteries, so that the coronary outlet pressure was set as Pa at the rest state. Rn-res represents the afterload resistance of the n branch at the rest condition,while Rn-hyp represents that at hyperemia condition.

The last step is to perform the CFD simulation with the Rn_hyp as outlet resistances at hyperemia. The convergence criteria were set as the RMS of residual type with 10-4residual target.
3 Results
3.1 Resistance boundary conditions and FFRss
The resistance boundary conditions at rest state and hyperemia state were used in this study. In the coronary artery, FFR is defined as the ratio of distal coronary pressure (Pd)to the pressure observed in the aortic (Pa) at the hyperemia condition in this study [Pijls,De Bruyne, Peels et al. (1996); Pijls and Sels (2012); Lee, Ryu, Shin et al. (2017)].
The resistance of coronary arteries and FFRss values were list in Tab. 1. The clinical FFR value was 0.82. At the same location of clinical measured FFR, FFRss values was 0.811.
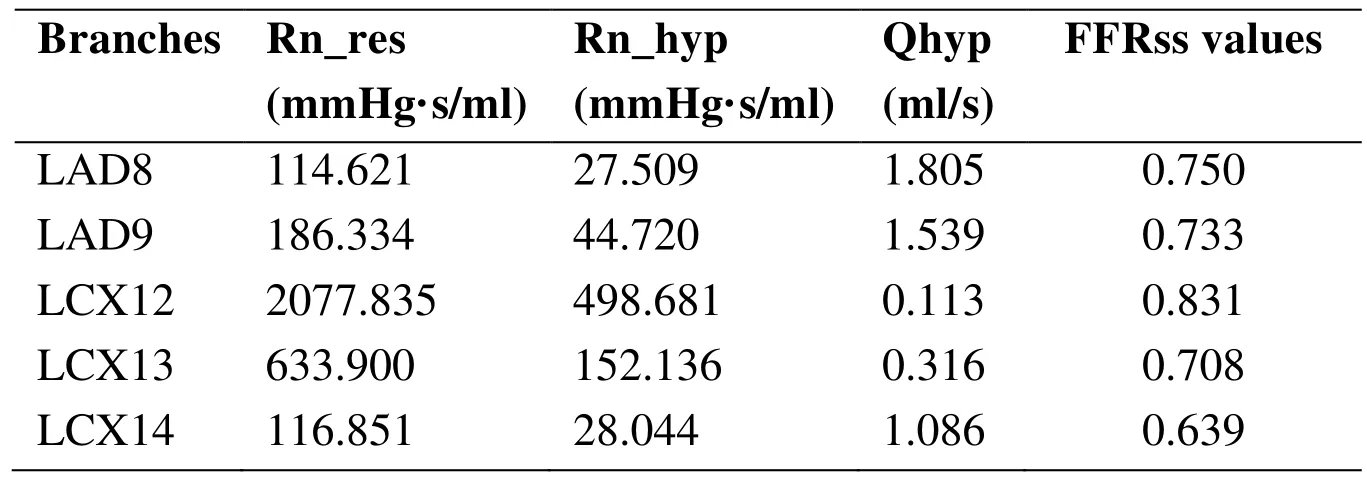
Table 1: The resistance of coronary arteries and FFRss of values
3.2 Effect of inlet pressure on FFRss values
To explore the effect of inlet (aortic) pressure on FFRss values, six cases with different inlet pressure were added which shown in Tab. 2. The percentages in the brackets represent the increment (or decrement) of inlet pressure. The left anterior descending artery (LAD), which supplies blood to the left ventricle, is a very important blood vessel.Therefore, LAD 8 and LAD9 branches were both calculated and illustrated in Tab. 2.While, only LCX12 branch of LCX arteries was calculated and illustrated.
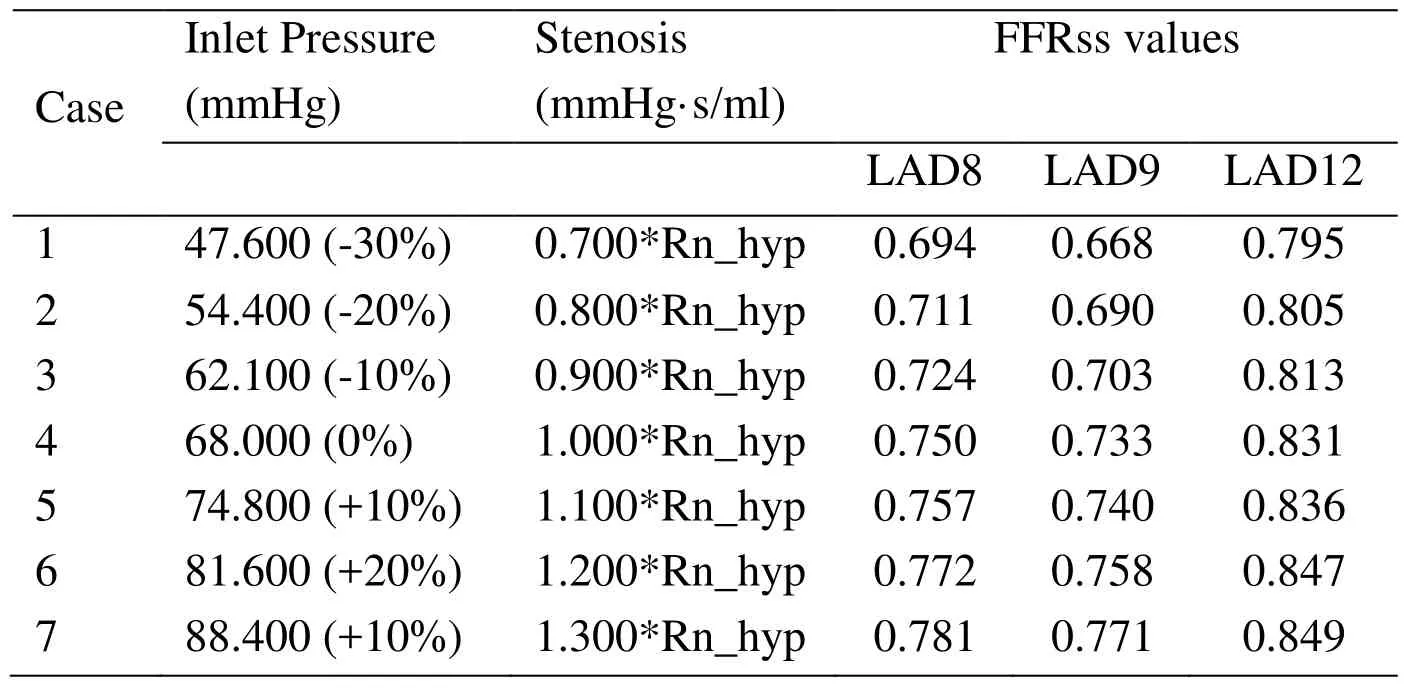
Table 2: FFRss values of Patients with different inlet pressure
The effect of inlet pressure on FFRss was illustrated in Fig. 2. All coronary branches were analyzed and depicted. It can be found that: with the different inlet pressure, it has more effect on LCX14 than LAD8 and LCX12.
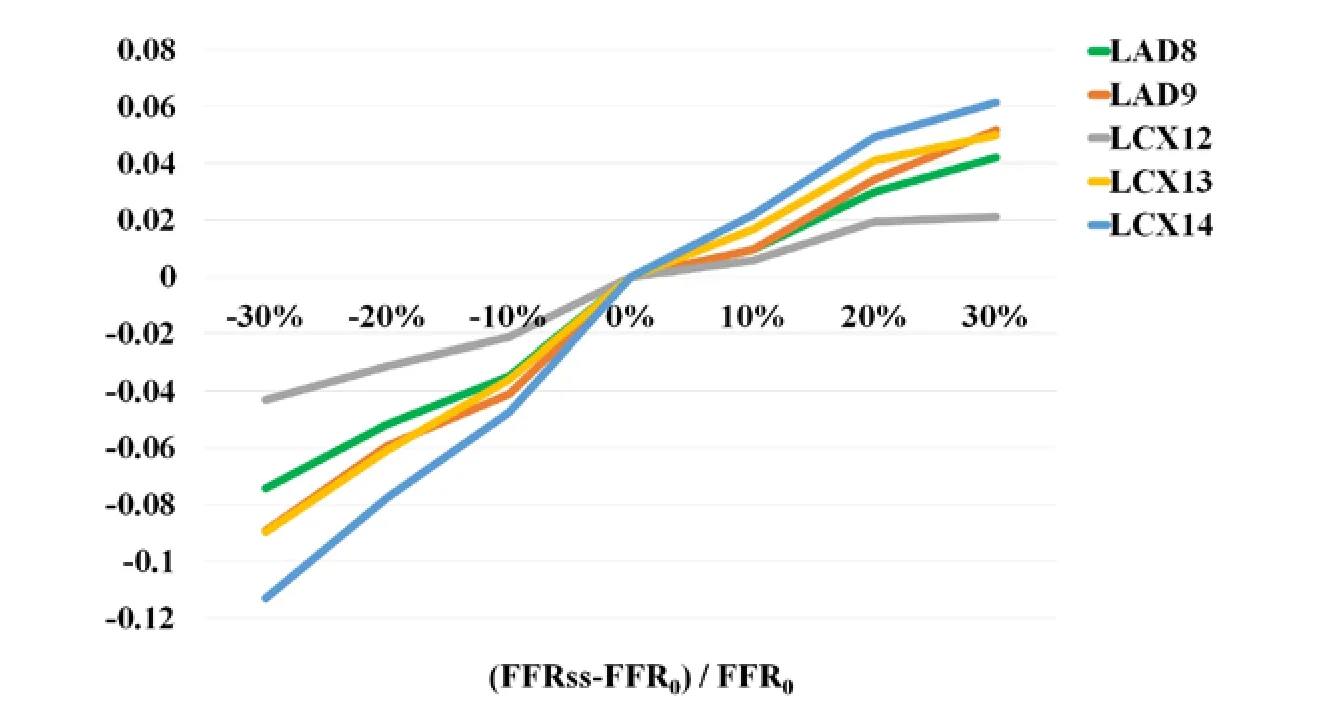
Figure 2: Effect of inlet pressure on FFRss
3.3 Effect of myocardial mass on FFRss values
To explore the effect of mass on FFRss values, six cases with different mass were added,as shown in Tab. 3. The effect of myocardial mass on FFRss values was illustrated in Fig.3. It can be found that: With the different myocardial mass, it has more effect on LCX14 than LAD8, LAD9 and LCX12.
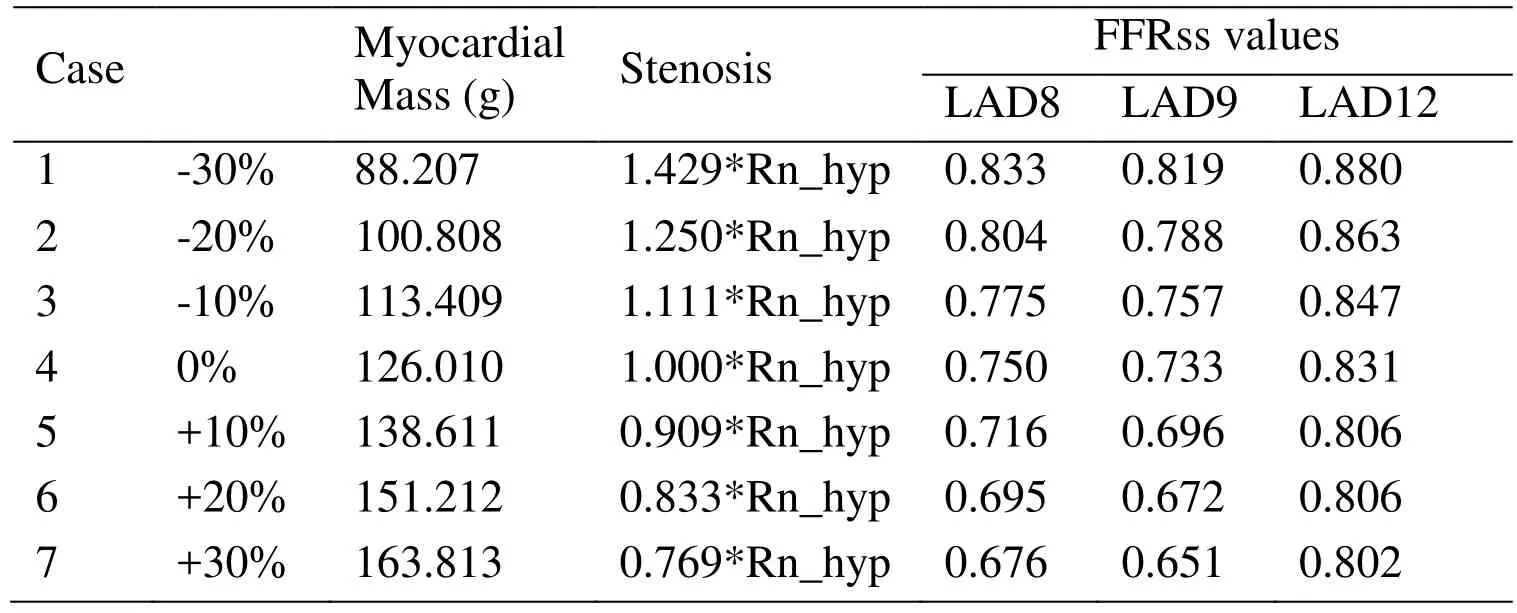
Table 3: FFRss values of patients with different myocardial mass
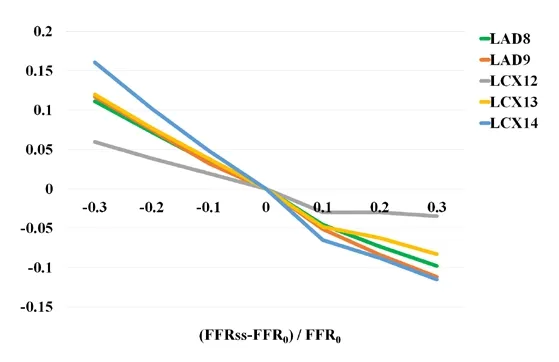
Figure 3: Effect of myocardial mass on FFRss
4 Discussion
In this study, we present a fast and accurate method to quantifying FFRss by coupling a 3D model with a LPM based on steady- state calculation method. There were multiple main findings from this research.
4.1 A fast simulation method of FFRss value
This study proposed a fast simulation method to solve the coronary artery hemodynamics based on CTA images. After the patient’s 3D model was reconstruction, the FFRss numerical calculation usually costs 20-30 minutes. Whereas our previous computed models often cost more than one hour [Zhao, Liu, Li et al. (2015); Zhao, Liu, Ma et al.(2015); Wang, Liu, Zhao et al. (2016); Zhao, Liu, Li et al. (2016)].
4.2 Resistance boundary conditions
The resistance boundary conditions were used in this paper. The coronary afterload resistance at hyperemia state is 24% of the afterload at rest state, which could be 18%-32% in different patients [Kim, Vignon-Clementel and Coogan (2010)]. It is very important for FFR value calculation to define the boundary conditions of threedimensional coronary model. It is used to bridge 3-dimensional (3D) coronary model with coronary microcirculation (which is invisible in CTA images).
In case 4, the ratio of Flow rate at rest state and that at hyperemia state (Qres/Qinitial) on every branch were analyzed in Tab. 4. It is not difficult to find that the flow changes(Qres/Qinitial) of coronary branches are different. In case 4, the flow rate of LAD9 at hyperemia condition is 4.217 times that at rest condition. While, the flow rate of LCX14 at hyperemia condition is 1.866 times that at rest condition. In some studies, they used constant Qres/Qinitial as the outlet boundary conditions. It would ignore the effect of coronary flow reserve on flow rate of different coronary arteries [Ma, Liu, Hou et al.(2017)]. Therefore, it is more accurate to apply the resistance than flow rate as the boundary conditions in coronary arteries simulation.

Table 4: The ratio of flow rate of coronary branches
4.3 Future work and limitation
This study still has some limitation. Firstly, there was some factors that can affect hemodynamics simulate results: 3D images resolution, the rigid wall hypothesis. Secondly,the fluid-structure interaction was not used because it would cost much time in the 3D calculation. Thirdly, this simulation method was validated only with 13 cases of one patient.Here, only single coronary system and moderate stenosis cases were studied. However, this simulation method results with those above limitations can still be used in clinical coronary prediction, because relative differences for patients from the same models are meaningful.We should continue improve our technology for more accurate results and investigate more patient cases to further validate the simulation method. Combining with the Positron emission tomography (PET) technology and CFD simulation, new diagnosis methods for evaluating the coronary function index should be researched.
5 Conclusion
To date, evaluating the flow rate and pressure of coronary microcirculation remains a big challenge in hemodynamic numerical simulation due to the complexities of cardiovascular mechanics. The present study provided a fast-numerical simulation of FFRss based on patients’ 3D model and the coronary resistance boundary conditions.
Compared with those above methods, this FFRss study can quickly and noninvasively assess the level of myocardial ischemia and avoid the deviations when simulating the coronary vascular beds in maximally dilated (hyperemia) condition.
Acknowledgement:This study was financially supported by the National Natural Science Foundation of China (11832003, 11772016, 11472022). The authors thanked all the participants in this study.
 Computer Modeling In Engineering&Sciences2018年8期
- Computer Modeling In Engineering&Sciences的其它文章
- Angle of Attack Between Blood Flow and Mitral Valve Leaflets in Hypertrophic Obstructive Cardiomyopathy: An In Vivo Multipatient CT-based FSI Study
- The Analysis of Wall Shear Stress Modulated by Acute Exercise in the Human Common Carotid Artery with an Elastic Tube Model
- Hemodynamics of Enhanced External Counterpulsation with Different Coronary Stenosis
- Influence of Clip Locations on Intraaneurysmal Flow Dynamics in Patient-specific Anterior Communicating Aneurysm Models with Different Aneurysmal Angle
- Computational Fluid Dynamics Analysis of Shroud Design on Hemodynamic Performance and Blood Damage in a Centrifugal Blood Pump
- Numerical Analyses of Idealized Total Cavopulmonary Connection Physiologies with Single and Bilateral Superior Vena Cava Assisted by an Axial Blood Pump
